Effect of Sand Gradation on the Shear
Parameters in the Soil Sample a Case Study in
Kadapa District
D. Janaki Ramudu1, Dr. T. Kiran Kumar2
Post Graduate student of Civil Engineering, KSRM College (Autonomous), Kadapa, India1 Associate professor, Department of Civil Engineering, KSRM College (Autonomous), Kadapa, India2
ABSTRACT: Shearing strength of a soil is the most difficult to comprehend in view of the multitude of factors known to affect it. A lot of maturity and skill may be required on the part of the engineer in interpreting the results of the laboratory tests for application to the conditions it the field. The shear strength of soils is an important aspect in many foundation engineering problems such as the bearing capacity of shallow foundations and piles, the stability of the slopes of dams and embankments, and lateral earth pressure on retaining walls.
A soil have been mixed with different gradations of sand to form a different soil-sand mixtures. The main purpose is to observe the effects of different soil-sand mixture on behavior of shear strength. The direct shear test is conducted with shear boxes without performing initial consolidation in large boxes. The test procedure is conducted about 50% soil-50% sand mixtures seems to be threshold composition and changes are found by increasing the gradations of sand content in drained shear test Mainly Direct Shear test is conducted to find out the soil-sand mixture which tends to maximum shear strength is 1.58 kg/cm2, Maximum cohesion and Minimum angle of internal friction will be 1.16 kg/cm2 and 15˚48’, and decreases the seepage through the sand.
I. INTRODUCTION
‘Shearing Strength’ of a soil is perhaps the most important of its engineering properties. This is because all stability analyses in the field of geotechnical engineering, whether they relate to foundation, slopes of cuts or earth dams, involve a basic knowledge of this engineering property of the soil. ‘Shearing strength’ or merely ‘Shear strength’ may be defined as the resistance to shearing stresses and a consequent tendency for shear deformation.
Shearing strength of a soil is the most difficult to comprehend in view of the multitude of factors known to affect it. A lot of maturity and skill may be required on the part of the engineer in interpreting the results of the laboratory tests for application to the conditions in the field.
Granular soils of sands may derive their shear strength from the first two sources, while cohesive soils or clays may derive their shear strength from the second and third sources. Highly plastic clays, however, may exhibit the third source alone for their shearing strength. Most natural soil deposits are partly cohesive and partly granular and as such, may fall into the second of the three categories just mentioned, from the point of view of shearing strength. The shear strength of a soil cannot be tabulated in codes of practice since a soil can significantly exhibit different shear strengths under different field and engineering conditions.
In this study, it was aimed to observe shear strength behaviour of soil - sand mixtures. Two series of experiments were performed. In all series, behaviour of shear strength under different testing conditions was investigated against increasing fine materials in the mixtures.
1.1 Objectives of the present study:
1. To study the properties of soil 2. To study the properties of sand
II. LITERATURE REVIEW
Direct shear testing, as was first used by Coulomb in 1776 (Lamb and Whitman 1969), has long been used to estimate the strength parameters for the analysis of slope stability, retaining wall, and bearing capacity problems. More recently, direct shear testing techniques have been extended to measure interface friction between soils and reinforcing elements in reinforced soil applications (Haussmann 1990; Lee and Manjunath 2000) and soils and foundation elements (Abderrahim and Tisot 1993).
The effect of particle size on shear strength of granular materials is investigated using direct shear tests. Small direct shear test (60 mm by 60 mm by 24 mm deep) were conducted for particles passing the sieves with opening size of 2.36 mm. Meanwhile, particles passing the standard 20 mm sieves were tested using large direct shear test (300 mm by 300 mm by 200 mm deep). The large direct shear tests and the small direct shear tests carried out using the same shearing rate of 0.09 mm/min and similar normal stresses of 100, 200 and 300 kPa. The results show that the peak and residual shear strength increases as particle size increases.
The experimental results were compared with the values predicted by the suggested approach and showed good agreement. As the developed model depends on the residual interface friction angle (δr) between the helix surface and the surrounding sand, results of δr, extracted from different sand samples, are presented for use in this suggested relationship on site. Also, the values of KT found in this work were compared with those of field and laboratory tests on
helical piles in sand reported in the literature.
III. STUDY AREA
Sample is collected from EGUPALLE near KADAPA. The soil sample is collected from a vast area of black cotton soil. The experiments are conducted in Geotechnical laboratory of KSRM College of Engineering, which is located near Krishnapuram village, KADAPA.
IV. MATERIALS AND METHODOLOGY
4.1 MATERIALS
In this process the materials are locally available soil sample and river sand. The soil sample is collectedfrom Egupalle near Kdapa. The experimental investigations on soil sample are done to understand the index and engineering properties of the collected soil sample. This experimental study helps to classify the soil. The obtained values of index and engineering properties of the soil.
The sand samples are collected from the Pennariver near chennuru and the experimental investigations on sand sample are done to understand the index and engineering properties of the collected sand sample. Finally we determine the shear stress variation to changing the percentages of sand and soil samples.
4.2 METHODOLOGY
In this study, the soil sample is collected from Egupalle near Kdapa. The experimental investigations on soil sample are done to understand the index and engineering properties of the collected soil sample. This experimental study helps to classify the soil. The index and engineering properties of the soil are Liquid limit(IS: 2720-Part-5-1970), Plastic limit(IS: 2720-Part-5-1970), Plasticity index, Standard proctor compaction test(IS code-2131-1981), Free swell index(IS 2720-part-40-1977), Sieve analysis(IS 2720-part-4-1975), Specific gravity(IS 2720-Part-3, sec-1, 1980), and Direct shear test(IS 2720-part-13-1972)
In this study deals with experimental investigation carried on sand to classify the sand sample. The sand sample is collected from the PennaRiver near chennuru. The index and engineering properties of the sand are Sieve analysis(IS 2720-part-4-1975), Specific gravity(IS 2720-Part-3, sec-1, 1980), Direct shear test(IS 2720-part-13-1972).
V. RESULT AND DISCUSSIONS
5.1 EXPERIMENTAL INVESTIGATION ON SOIL SAMPLE:
Table 5.1.1: Properties of the soil
5.1.2Shear strength of soil (IS 2720-part-13-1972)
The shear strength is calculated for the 100% soil sample based on (IS 2720-part-13-1972) values are tabulated in table 5.1.2. The curve is plotted by taking normal stress on x-axis and shear stress on y-axis
Table: 5.1.2 Data sheet for shear strength of soil S.no Normal
stress (kg/cm2)
Maximu m shear force
(kg)
Shear stress (kg/cm2)
Shear strength (kg/cm2)
1 1 48.07 1.33
1.473 2 2 53.58 1.48
3 3 58.17 1.61
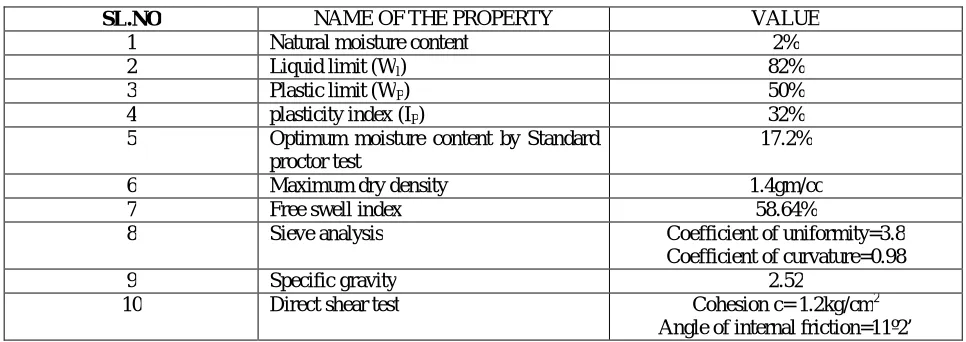
Figure5.1.3 : variation between normal stress and shear stress of soil SL.NO NAME OF THE PROPERTY VALUE
1 Natural moisture content 2% 2 Liquid limit (Wl) 82%
3 Plastic limit (WP) 50%
4 plasticity index (IP) 32%
5 Optimum moisture content by Standard proctor test
17.2% 6 Maximum dry density 1.4gm/cc 7 Free swell index 58.64%
8 Sieve analysis Coefficient of uniformity=3.8 Coefficient of curvature=0.98 9 Specific gravity 2.52
Result :
From the table 5.1.1 the soil will be classified as clayey silt. From the table 5.1.2 shear strength of soil is 1.473 kg/cm2
From the graph 5.1.3 the cohesion is 1.2kg/cm2 and angle of internal friction is 11˚2' .
5.2 EXPERIMENTAL INVESTIGATION ON SAND:
Table 5.2.1: Properties of the sand
SL.NO NAME OF THE PROPERTY VALUE
1 sieve analysis Coefficient of uniformity=1.87 Coefficient of curvature=0.87 2 Specific gravity 2.65
3 Direct shear test Cohesion c= 0 kg/cm2 Angle of internal friction=35º1’
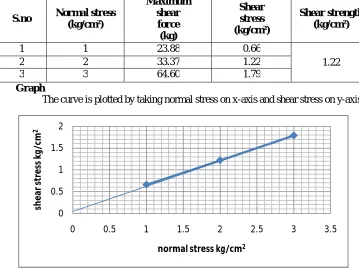
5.2.2 Shear strength of the sand (IS 2720-Part-13-1972)
The shear strength is find out for the 100% sand sample based on (IS 2720-Part-13-1972) andthe values are tabulated in table 5.2.2
Table 5.2.2: Data sheet for shear strength of sand
S.no Normal stress (kg/cm²)
Maximum shear
force (kg)
Shear stress (kg/cm²)
Shear strength (kg/cm²)
1 1 23.88 0.66
1.22 2 2 33.37 1.22
3 3 64.60 1.79
Graph
The curve is plotted by taking normal stress on x-axis and shear stress on y-axis
Figure 5.2.3: variation between the normal stress and shear stress of sand
Result:
From the table 5.2.1 the sand will be classified as poorly graded sand. From the table 5.2.2 shear strength of sand is 1.22 kg/cm2
0 0.5 1 1.5 2
0 0.5 1 1.5 2 2.5 3 3.5
sh
e
ar
s
tr
es
s
kg
/c
m
2
From the graph 5.2.3 the cohesion is 0 kg/cm2 and angle of internal friction is 35˚1'.
5.3 EXPERIMENTAL INVESTIGATION ON SOIL - SAND MIXTURE
In this study shear parameters of soil will be mixing the sandin different gradations (4.71, 2, 1, 0.6, 0.425, 0.3,0.15, 0.075 mm) and shear parameters were determined. In this the each grade of sand will be mixed with soil. The study on the variation of cohesion and angle of internal friction for each grade is done in the respective chapter.
In this study the shear strength is calculated for the mix proportion of 50% sand retained on 2 mm sieve and clay of 50% andthe values are tabulated.
Table 5.3.1: 2 mm-RETAINED SAND (50%) and CLAY (50%)
S.no
Normal Stress (kg/cm²)
Maximum Shear
force (kg)
Shear stress (kg/cm²)
Shear strength (kg/cm²)
1 1 18.72 0.52
0.89 2 2 34.2 0.92
3 3 44.28 1.23
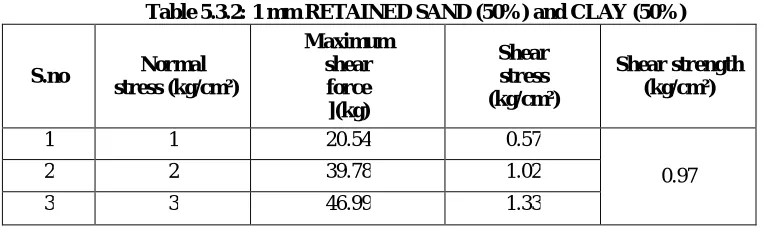
In this study the shear strength is calculated for the mix proportion of 50% sand and clay of 50% andthe values are tabulated.
Table 5.3.2: 1 mm RETAINED SAND (50%) and CLAY (50%)
S.no Normal stress (kg/cm²)
Maximum shear force ](kg)
Shear stress (kg/cm²)
Shear strength (kg/cm²)
1 1 20.54 0.57
0.97 2 2 39.78 1.02
3 3 46.99 1.33
Table 5.3.3:0.6 mm RETAINED SAND (50%) and CLAY (50%)
In this study the shear strength is calculated for the mix proportion of 50% sand and clay of 50% andthe values are tabulated.
S.no Normal stress (kg/cm²)
Maximum shear
force (kg)
Shear stress (kg/cm²)
Shear strength (kg/cm²)
1 1 29.27 0.6
1.02 2 2 39.5 1.03
Table 5.3.4: 0.425 mm RETAINED SAND (50%) and CLAY (50%)
In this study the shear strength is calculated for the mix proportion of 50% sand and clay of 50% andthe values are tabulated.
S.no Normal stress (kg/cm²)
Maximum shear force (kg)
Shear stress (kg/cm²)
Shear strength (kg/cm²)
1 1 23.14 0.64
1.06 2 2 34.26 1.05
3 3 54.65 1.51
Table 5.3.5: 0.3mm RETAINED SAND (50%) & CLAY (50%)
In this study the shear strength is calculated for the mix proportion of 50% sand and clay of 50% andthe values are tabulated.
S.no Normal stress (kg/cm²)
Maximum shear force
(kg)
Shear stress (kg/cm²)
Shear strength (kg/cm²)
1 1 38.67 1.07
1.45 2 2 50.49 1.52
3 3 64.33 1.78
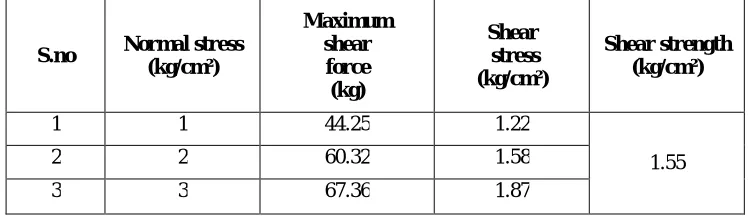
Table 5.3.6: 0.15 mm RETAINED SAND (50%) &CLAY (50%)
In this study the shear strength is calculated for the mix proportion of 50% sand and clay of 50% andthe values are tabulated.
S.no Normal stress (kg/cm²)
Maximum shear force
(kg)
Shear stress (kg/cm²)
Shear strength (kg/cm²)
1 1 44.25 1.22
1.55 2 2 60.32 1.58
3 3 67.36 1.87
In this study the shear strength is calculated for the mix proportion of 50% sand and clay of 50% andthe values are tabulated.
S.no Normal stress (kg/cm²)
Maximum shear force
(kg)
Shear stress (kg/cm²)
Shear strength (kg/cm²)
1 1 49.42 1.37
1.66 2 2 57.5 1.59
3 3 73.48 2.04
Results:
Results for Shear strength:
From the table 5.3.1, 5.3.2, 5.3.3, 5.3.4, 5.3.5, 5.3.6, and 5.3.7 shear strength of soil-sand mixture is 0.89 kg/cm2, 0.97 kg/cm2,1.02 kg/cm2,1.06 kg/cm2,1.45 kg/cm2,1.55 kg/cm2,1.66 kg/cm2. In this study the sand gradation is decreasing in the soil then the shear strength of soil-sand mixture will be increasing.
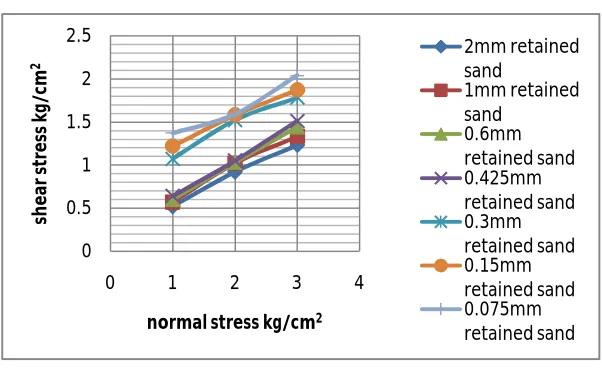
The graph plotting between the normal stress and shear stress
Fig 5.3.8: C – Ø graph for each gradation of sand sample
Results for angle of internal friction:
From the graph 5.3.8 angle of internal friction of soil-sand mixture at each sand gradations of 2mm, 1mm, 0.6mm, 0.425mm, 0.3mm, 0.15mm, and 0.075mmis 35˚25’, 33˚2’, 32˚3’, 25˚48’, 22˚48’, 19˚19,and 15˚48’. The sand gradation will be decreasing in the soil sample then the angle of internal friction will be decreasing.
Graph
0 0.5 1 1.5 2 2.5
0 1 2 3 4
sh
e
ar
s
tr
e
ss
k
g/
cm
2
normal stress kg/cm2
2mm retained sand
1mm retained sand
The curve is plotted by taking sand gradation on x-axis and angle of internal friction on y-axis
Figure 5.3.9: comparisonof angle of internal friction for soil and different gradations of sand retained
Results for cohesion:
From the graph 5.3.8 cohesion of soil-sand mixture is at each sand gradations of 2mm, 1mm, 0.6mm, 0.425mm, 0.3mm, 0.15mm, and 0.075mm is 0.18 kg/cm2, 0.19 kg/cm2, 0.2 kg/cm2, 0.58 kg/cm2, 0.61 kg/cm2, 0.84 kg/cm2, and 1.16 kg/cm2. The sand gradation will be decreasing in the soil sample then the cohesion will be increasing.
Graph
The curve is plotted by taking sand gradation on x-axis and cohesion on y-axis
Figure 5.3.10: comparison of cohesion for soil and different gradations of sand retained
VI. CONCLUDING REMARKS
1. The density considered to conduct experimental investigation on sand-clay mixture is 2.1gm/cc.
2. Shear strength of soil sand mixture will be increasing to changing the gradations of sand in the soil sample.
3. The value of cohesion will be increasing to changing the gradations of sand in the soil sample.
4. The value of angle of internal friction will be decreasing to changing the gradations of sand in the soil sample.
5. Maximum cohesion will be 1.16(kg/cm2 ) and minimum cohesion will be 0.18 (kg/cm2 )
6. Angle of internal friction will be at maximum 35°25' and minimum 15°48'.
7. Shear strength of soil sand mixture will be at maximum 1.58(kg/cm2) and minimum 0.89 (kg/cm2)
35.25 33.2
32.3
25.48
22.48
19.19
15.48
1 2 3 4 5 6 7
angle of internal friction for soil-sand
0.18 0.19 0.2
0.58 0.61 0.84
1.16
1 2 3 4 5 6 7
REFERENCES
1. Lamb, T. W., and Whitman, R. V., 1969, Soil Mechanics, John Wiley and Sons, NewYork.
2. Abderrahim, A., and Tisot, J. P., 1993, “Friction at the Cohesionless Soil-Structure Interface: Effect of Various Parameters According to a Classic Study and a New Approach,” Geotech. Test. J., Vol. 16, pp. 122–130.
3. Bauer, G. E., and Zhao, Y., 1993, “Shear Strength Tests for Coarse Granular Backfill and Reinforced Soils,” Geotech. Test. J., Vol. 16, pp. 115–121.
4. Head, K. H. (1982). Manual of Soil Laboratory Testing, Volume 2: Permeability, Shear Strength & Compressibility Tests, Robert Hartnoll Ltd., Bodmin, Cornwall.
5. Palmeira, E. M., and Milligan, G.W., 1989, “Scale Effects in Direct Shear Tests on Sand,” Proceedings of 12th International Conference on Soil Mechanics and Foundation Engineering, pp. 739– 742.
6. Adams, C.J. (1979) "Recycling Of Steel Plant Waste Oxides – A Review" CANMET Report
7. Pradip, D. Vaidyanathan, P. C. Kapur and B. N. Singh, (1990), "Production and properties of alinite cements from steel plant wastes", Cement and Concrete Research, Volume 20, Issue 1, January, Pages 15-24.
8. Young; Rom D. and Norris; David, (2004) "Process for using mill scale in cement clinker production", US Patent No. 6709510.
9. Azad A.M. SatheesKesavan, Sirhan Al-Batty,(2008),” Redemption of Micro scale Mill waste into commercial Nano scale Asset”,Key Engineering Materials, volume 380, pages-229-255
10. Stefania Tomasiello, Matteo Felitti ,(2010),” EAF slag in self- compacting concretes”, FactaUniversitatis Series: Architecture and Civil Engineering Vol. 8, No 1, 2010, 13 - 21
11. Gadre, A D ,Chandrasekaran, V S,(1995)” Swelling of black cotton soil using centrifuge modeling”, Journal of Geotechnical Engineering, Vol 120,issue no.5,pg914-919