Seismic Performance Evaluation of
Eccentrically Braced Frame Using PBPD
Method
Shreya S. Chintawar
Asst. Professor, Department of Civil Engineering, Sinhgad College of Engineering, Vadgaon(bk), Pune, India
ABSTRACT: Presented in this paper is the seismic performance evaluation of eccentrically braced frames using performance based plastic design method. For this, steel EBF is first designed using the PBPD method and then using elastic Design Method. The Lateral forces in the Elastic Design method are calculated using the Elastic Design Spectra and all the structural members are designed as elastic beam-columns based on Limit State Design Philosophy. The Lateral forces in the Performance Based Plastic Design Method are calculated using the inelastic spectral acceleration which is obtained by applying proper reduction factors. For the performance evaluation, nonlinear static pushover analysis is performed on frame with both PBPDand conventional design using SAP2000design and analysis software. Results prove the superiority of the PBPD method over the Elastic Design method in terms of safety and overall economy.
KEYWORDS:Eccentrically braced frames, Shear link, Yield mechanism, Target drift, Seismic performance.
I. INTRODUCTION
It is well known that structures designed by current codes undergo large inelastic deformations during major earthquakes. However, current seismic design approach is generally based on elastic analysis and accounts for the inelastic behaviour in a somewhat indirect manner. When struck by severe ground motions, however, the structures designed by such procedures have been found to undergo inelastic deformations in a somewhat “uncontrolled” manner. The inelastic activity, which may include severe yielding and buckling of structural members and connections, can be unevenly and widely distributed in the structure. This may result in rather undesirable and unpredictable response, sometimes total collapse, or difficult and costly repair work at best. The PBPD method is a direct design method where drift and yield mechanism, e.g. strong column–weak beam condition, are built in the design process from the very start. The design base shear for a specified hazard is calculated based on the reduction factors “Rμ” proposed by Newmark
(1982). Also, a new distribution of lateral design forces is used that is based on relative distribution of maximum storey shears consistent with inelastic dynamic response results (Chao et al., 2007). Plastic design is then performed to detail the frame members and connections in order to achieve the intended yield mechanism and behaviour. Thus, determination of design base shear, lateral force distribution and plastic design are three main components of the PBPD method.
II. PERFORMANCE BASED PLASTIC DESIGN METHOD
pseudo-velocity spectrum. The design base shear for a specified hazard level is calculated by equating the work needed to push the structure monotonically up to the target drift to the energy required by an equivalent EP-SDOF to achieve the same state. Plastic design is then performed to detail the frame members and connections in order to achieve the intended yield mechanism and behaviour.
III.DESIGN PROCEDURE OF ECCENTRICALLY BRACED FRAME
A. USING PBPD METHOD
Calculation of design lateral force and base shear-
βi= = ∑
. .
Fi=Cvi’V
Cvi’=(βi-βi+1) ∑
. .
Where
βi= shear distribution factor at level i
Vi, Vn= story shear forces at level i and at the top (nth) level, respectively
wi, wj= seismic weights at level i and j, respectively
hi, hj= heights of levels i and j from the ground, respectively
wn= seismic weight of the structure at the top level
hn= height of roof level from ground
T = fundamental structure period obtained by code specified methods or elastic dynamic analysis
Fi, Fn= lateral forces applied at level i and top level n, respectively
V = design base shear
α = dimensionless parameter, which depends on the stiffness of the structure, the modal properties, and the intended drift level
=− + + 4
2
α =(∑ ( − )ℎ). ∑
. .
.
βiVpr= βi . ∑ .(∑ ).∑
B. USING ELASTIC DESIGN METHOD
Calculation of Base Shear:- Vb= Ah.W
Where, Ah= . .
.
This Base shear Vb is distributed along the height of the Building as follows
Qi = Vb .∑
Where
Vb= Base shear
Ah= Design Horizontal Seismic Coefficient W = Total seismic weight of the structure Z = Zone factor
I = Importance factor
Sa/g = Average response acceleration coefficient Qi = Design lateral force at floor i
Wi = Seismic weight of floor i
hi = Height of floor i measured from base
n = Number of storey in the building is the number of levels at which the masses are located.
IV.DETAILS OF STRUCTURE AND BASIC DATA
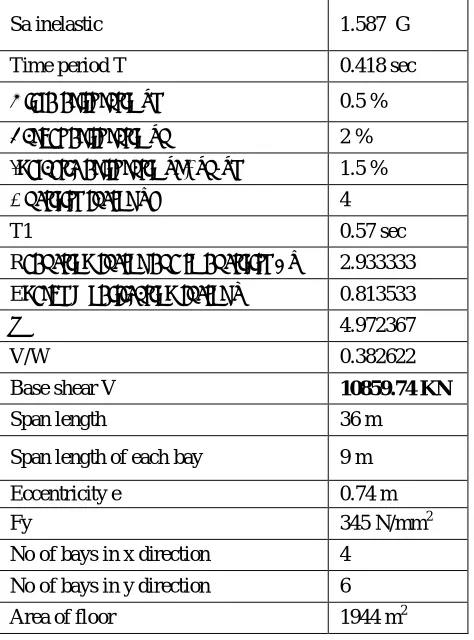
An EBF was designed by using PBPD procedure and LSM procedure. Elevation view of example is shown in figure below. A three storey structure is 36m*54m and 9m in height. The bays are 9m centre to centre in both directions with 4 bays in X direction and 6 bays in Y direction. (Goel et.al. PBPD design, Engg journal, third quarter). Table 1 shows seismic parameters for PBPD method of 3 Storey EBF. It consists of time period, drift ratio, ductility factor etc. base shear is calculated using all these parameters.
Table 1:-Seismic Parameters of 3 Storey EBF for PBPD
Sa inelastic 1.587 G
Time period T 0.418 sec
Yield drift ratio θy 0.5 %
Target drift ratio θu 2 %
Inelastic drift ratio θp=θu-θy 1.5 %
Ductility factor μs 4
T1 0.57 sec
Reduction factor due to ductility Rμ 2.933333 Energy modification factor γ 0.813533
Α 4.972367
V/W 0.382622
Base shear V 10859.74 KN
Span length 36 m
Span length of each bay 9 m
Eccentricity e 0.74 m Fy 345 N/mm2 No of bays in x direction 4
No of bays in y direction 6 Area of floor 1944 m2
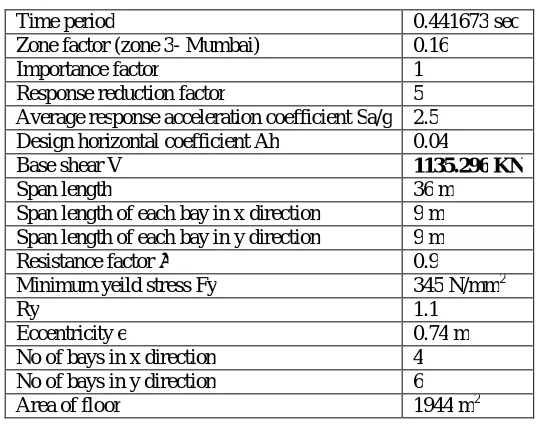
Table 2:-Seismic Parameters of 3 Storey EBF for Elastic Design Method
Time period 0.441673 sec Zone factor (zone 3- Mumbai) 0.16
Importance factor 1 Response reduction factor 5 Average response acceleration coefficient Sa/g 2.5 Design horizontal coefficient Ah 0.04
Base shear V 1135.296 KN
Span length 36 m Span length of each bay in x direction 9 m Span length of each bay in y direction 9 m Resistance factor ϕ 0.9 Minimum yeild stress Fy 345 N/mm2
Ry 1.1
Eccentricity e 0.74 m No of bays in x direction 4 No of bays in y direction 6 Area of floor 1944 m2
Figure 1 shows the elevation of 3 storey eccentrically braced frame model generated in SAP2000. It shows that bracings of EBF are present in first and last bay of model with some eccentricity.
Fig. 1:- Elevation of 3 storey eccentrically braced frame in SAP2000
PUSHOVERANALYSIS
As for the performance evaluation of 3 storey frame designed with PBPD method and conventional method, pushover analysis is performed using SAP2000 software. The displacement at the roof top is controlled for 2% lateral drift. For 3 storey PBPD frame, since the method is displacement based and yield mechanism is preselected after the analysis it can be verified whether the yield mechanism is as intended. For 3 storey LSM frame, frame was designed by using Limit state method. Thereafter pushover analysis was carried out for verifying the results. In both the cases controlled displacement was taken as 0.18m which is 2% of building height.
V. RESULTS AND DISCUSSION
Table 3:- Sections Used For Shear Link and Beam
Floor Shear link Beam Roof ISWB600-1 ISWB600-1 2nd ISWB600-2 ISWB600-2 1st ISWB600-2 ISWB600-2
Table 4 shows sections used for Braces and Columns. ISHB indicates Indian Standards Heavy Beams.
Table 4:- Sections Used For Braces and Columns
Floor Braces Columns
Roof ISHB450-2 with 400x20mm cover plates 2ISWB600-2 with 700x30mm cover plates 2nd ISHB450-2 with 400x20mm cover plates 2ISWB600-2 with 700x30mm cover plates 1st ISHB450-2 with 400x20mm cover plates 2ISWB600-2 with 700x30mm cover plates
Figure 2 shows formation of hinges in 3 storey EBFdesigned using PBPD method where bracings are present in first and last bay of EBF in X direction.
Fig 2:-Formation of hinges for 3 storey PBPD frame in Shear Link
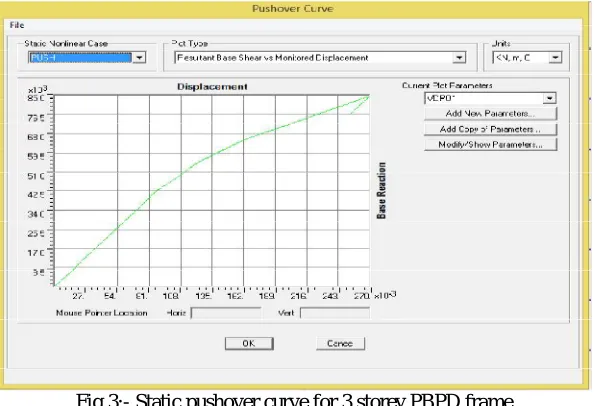
Figure 3 shows snapshot of Static Pushover Curve for 3 storey PBPD frame after Pushover Analysis is done in SAP2000
Fig 3:- Static pushover curve for 3 storey PBPD frame
Fig 4:- Formation of hinges for 3 storey LSM frame in Column
Figure 5 shows snapshot of Static Pushover Curve for 3 storey LSM frame after Pushover Analysis is done in SAP2000
Fig 5:- Static pushover curve for 3 storey LSM frame
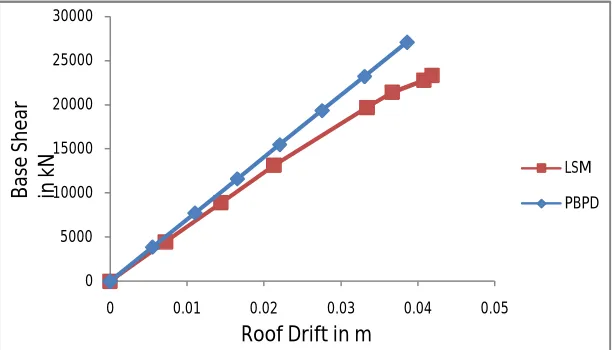
Graph 1 shows comparison of 3 storey EBF designed using Limit state method and Performance Based Plastic Design method with respect to Base Shear (in KN) and Roof Drift (in m).
Graph 1:- Comparison of LSM and PBPD for 3 storey frame
0 5000 10000 15000 20000 25000 30000
0 0.01 0.02 0.03 0.04 0.05
LSM
PBPD
Roof Drift in m
Base
S
h
ear
in
k
From above Pushover graph and formation of hinges, it can be said that hinges are formed in shear link only in PBPD Frame which is intended yield mechanism but in LSM frame, hinges are formed randomly i.e. in beams and columns also. Comparison graph of PBPD and LSM frame clearly shows that PBPD frames resist more shear than LSM frame for same loading conditions.
Table 5 shows comparison between LSM and PBPD frame with respect to weight of material used to design that frames. Also shows the weight ratio between two frames.
Table 5:- Comparison of Material Weight between LSM and PBPD frame
Weight in kN LSM PBPD PBPD/LSM Beam 2228.29 2170.11 0.97 Column 1264.40 2023.04 1.6 Braces 318.25 327.5 1.03 Total 3810.94 4520.65 1.18
VI.CONCLUSIONS
1. All the inelastic activity was confined to the shear links in PBPD frames as intended. On the other hand, inelastic activity in the conventional frames occurred in a somewhat less controlled manner among the frame members including columns.
2. Section provided for PBPD and conventional method for beams is same with small variation.
3. Section options clearly show the strong-column weak-beam phenomenon followed in the PBPD design through column tree equilibrium.
4. For same displacement, PBPD design frame resist more shear than conventional design frame.
5. It can be seen from table no. 5 that LSM frames (conventional) generally have heavier beams and lighter columns while the PBPD frames are opposite. The total weight of both frames is almost equal, but the PBPD frame shows better performance.
REFERENCES
[1] G.W. Housner(1960), “The plastic failure of frames during earthquake”, Division of engineering, California institute of technology, Pasadena,
California.
[2] Egor P. Popov and Michael D. Engelhardt (1988), “Seismic eccentrically braced frames”, J.Construct.Steel research 10.
[3] SutatLeelataviwat, Subash C. Goel, BozidarStojadinovic, M.EERI(1999), “Toward performance based seismic design of structures”,
Earthquake spectra, Volume 15, No.3.
[4] Chao, S.H. and Goel, S.C. (2006), “Performance-Based Seismic Design of EBF Using Target Drift and Yield Mechanism as Performance
Criteria,” Report No. UMCEE 05-05, Department of Civil and Environmental Engineering, University of Michigan, Ann Arbor, MI.
[5] J.W. Bermanand M. Bruneau, (2008), “Development of self-stabilizing links for eccentrically braced frames”, The 14th World conference on
Earthquake Engineering, Beijing, China.
[6] Wen-Cheng Liao and Subhash C. Goel, (2012), “Performance based plastic design and energy based evaluation of seismic resistant RC
moment frame”, Journal of Marine science and technology, Vol 20, No.3
[7] K.K.Sangle, K.M Bajoria, V. Mhalungkar,(2012) “Seismic analysis of high rise steel frame building with and without bracing”, The 15th World
conference on Earthquake Engineering, Lisboa.
[8] IS-1893:2000: “Criteria for Earthquake Resistant Design of Structures”.
[9] IS-800:2007: “General Construction in Steel Code of Practice.”
[10] S. Krishan.,[2008] “Modelling steel moment frame and braced frame buildings in three dimensions using FRAME3D,” 14th World conference
on Earthquake engineering October 12-17, Beijing, China.
[11] M. Naeemi and M. Bozorg., [2009] “Seismic performance of knee braced frame,” world academy of science,engineering and technology 50
[12] C.C. McDaniel and C.M.Uang, et. al.,[2003]. “Cyclic Testing of Built-up Steel Shear Links for the New BayBridge,” ASCE Journal of