Copyright to IJIRSET DOI:10.15680/IJIRSET.2016.0505071 7129
Failure Load Estimation of Pin loaded
Composite Plates Using Mathematical Models
K.Sridevi
Assistant Professor, Dept. of Mech. Engg, Faculty of Tech. and Engg, The M. S. University of Baroda, Vadodara, India
ABSTRACT: The aim of this paper is to develop mathematical models to study the failure loads of fiber glass reinforced woven epoxy composite plates with two holes subjected to traction forces by two rigid pins. The equations are developed using existing experimental results. To understand the effect of joint geometry on the failure loads the geometrical parameters like the edge distance to the hole diameter (E/D), the distance between center of two holes-to-hole diameter (K/D), the width of the specimen-to-holes-to-hole diameter (W/D) were varied. Here Quadratic models and Full Cubic models are found to be very efficient. A comparison of the results from mathematical models with the experimental results from literature show that they are in good agreement with each other. So, for estimation of the failure loads within the range of E/D, K/D and W/D considered for the study, the mathematical models developed are found to be efficient.
KEYWORDS: composite plate, pinloading, failure load
I. INTRODUCTION
Composite materials are in wide use in structural components of mechanical and civil applications. Huge structures are generally made by joining small parts together. Mechanical fastening by bolted joints is a common technique of joining two parts. They have the advantage of being able to be removed without destroying the structure. Also they are not sensitive to the surface preparation, temperature or humidity. But if the joint is not designed properly considering appropriate geometrical parameters then they act as areas of stress concentration and eventually fail. The knowledge of failure strength of a joint helps in selecting the appropriate joint size in a given application. The capability of a composite structure to withstand any physical load can be evaluated either by physical testing or any advanced computational method. Performing physical tests on composites is destructive and costly. So, implementing advanced computational techniques to determine the failure loads are preferred after some experiments are done.
Owing to the significance of the problem, several investigators have developed procedures to determine the strength of pin joints in composite materials. Aktas [1] has done experimental and numerical study to determine the failure behaviour of glass epoxy composite plates with single pinned hole and two serial pinned holes. The numerical study was performed by using ANSYS and Yamada-Sun failure criteria were used. Cesar Echavarrıa et al. [2] have developed
Copyright to IJIRSET DOI:10.15680/IJIRSET.2016.0505071 7130
observed that the failure modes and bearing strength are closely affected by the geometrical parameters, stacking sequence and bolt pretension. An increase in bolt pretension positively affected the failure of the composite joint. Ozen and Sayman [8] investigated experimentally and numerically the first failure load and bearing strength behaviour of pinned joints of glass fiber reinforced woven epoxy composite pre pregs with two serial holes subjected to traction forces by rigid pins. Soykok et al. [9] have carried experiments to understand the effect of thermal condition and tightening torque on the failure load and failure behavior of glass epoxy composite joints. It was observed that the load carrying capacity of the joint decreased by increasing the temperature level. The tightening torque was observed to increase the joint strength. In the present work, mathematical models are developed to predict the failure loads of composite pin joints. The results obtained from the mathematical models are compared with the experimental results of [8].
II. FAILURE MODES IN MECHANICAL JOINTS
Failure in mechanical joints can be classified into three types 1. normal or tearing mode
2. shearing mode
3. bearing or crushing mode
These three modes of failure are shown in Fig. 1. A joint fails in one of these three modes or a combination of these. The strength of the joint is the least of normal, shearing and bearing strengths. The mode of failure depends on the type of strength, which is the least. In general, failure of a joint means either the failure of the plate or the failure of the pin / joint. The normal mode of failure occurs for plate while shearing and bearing modes of failure occur either for plate or pin depending on which one is weaker. In the present work, the pin is considered to be rigid and therefore the failure is considered only in the plate.
III. PROBLEM DEFINITION
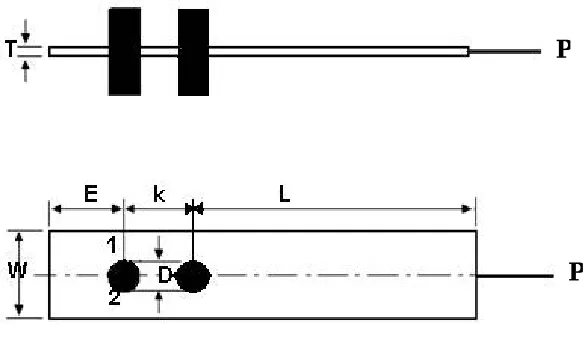
The effect of joint geometry is evaluated by varying the ratio of edge distance to the hole diameter (E/D), the ratio of width of the specimen to the hole diameter (W/D) and the ratio of distance between center of two holes to the hole diameter (K/D) from 1-4, 2-4 and 3-4 respectively. The geometry of the composite specimen is shown in Fig 2. Here E is the edge distance of the first hole from one end of the plate, K is the distance between the two holes, W represents the width of the plate and T is the thickness of the plate. The diameter of the holes is shown as D. The total length of the plate is L+K+E. The diameter of the holes, thickness of the plate and the total length of the plate are taken constant as 5mm, 0.8mm and 80mm respectively. A moment of 3Nm is applied on the plate and a load P is applied to the plate along the longitudinal axis. The plate is symmetric with respect to the longitudinal axis. The material properties considered for the study, given by [8], are shown in Table 1. Different specimens are obtained by varying E/D, W/D and K/D but keeping the parameters D, T and total length as constant. Mathematical models are developed to obtain the
(a) (b) (c)
Fig.1. Modes of failure (a) normal (b) bearing (c) shear
Copyright to IJIRSET DOI:10.15680/IJIRSET.2016.0505071 7131
failure loads of different specimens. The results obtained from mathematical models are compared with experimental results and correlations are observed.
IV. MATERIAL PREPARATION
Composite laminated plates were manufactured by woven glass fiber–epoxy prepregs and consist of four laminas. The glass fiber–epoxy prepregs were cured about 4 hours at 1200 C under 0.2 MPa pressure and then held constant for 2 hours under the same pressure at 1000 C. Subsequently, the laminate was cooled to the room temperature and after the manufacturing plate thickness was measured as 0.8 mm and volume fraction of glass fiber was approximately calculated as 57%.
The mechanical properties of the glass fiber–epoxy pre pregs composite plate which were obtained from the experimental study have been given in Table 1.
Table 1: Material properties of the plate.
E1 (GPa) G12(GPa) µ12 Xt (MPa) XC (MPa) S(MPa) Vf(%)
22.3 7.5 0.14 295.6 143.9 83.9 57
V. EXPERIMENTAL STUDY
To find the first failure load and the bearing strength, a series of experiments were performed. In order to evaluate the effect of joint geometry, the ratio of edge distance-to-upper hole diameter (E/D), the ratio of distance between center of two holes-to-hole diameter (K/D), and the ratio of width of the specimen-to-hole diameter (W/D) were systematically varied during experiments from 1–4, 3–4 and 2–4, respectively. To measure the effect of preload moment, 3 Nm moment was applied to the each specimen configurations. The experiments were carried out in tension mode by the Instron Tensile Machine [8]. The first failure load and mode of failure were observed.
Fig 2 Geometry of the specimen
Copyright to IJIRSET DOI:10.15680/IJIRSET.2016.0505071 7132
VI. MATHEMATICAL MODELLING
Based on the experimental data available, mathematical equations have been developed to predict the failure loads of specimens with different geometries by using curve expert software. The equations have two independent variables in W/D ratio as x1 and E/D ratio as x2. The failure load P is the dependent variable. The thickness of the specimen and the
diameter of the hole are constant for all the specimens. Quadratic and Full Cubic models are found to be best suited to determine the failure loads for the existing problem. Equations are developed for specimens with K/D ratios equal to 3 and 4 wherein each case W/D varies from 2-4 and E/D varies from 1-4.
The advantage from these equations is that they can be used to predict the failure load of specimens with other geometric parameters within the given range i.e. for E/D and W/D ratios for which experiments have not been done. Thereby the cost and time in carrying out the physical tests is saved. The drawback with this method is that it does not indicate the mode of failure that takes place. But as the width of the specimen increases with increase in W/D ratio, the load bearing cross sectional area increases and hence the normal strength increases. Similarly as the edge distance of the first hole increases with increase in E/D ratio, the shear strength of the specimen increases. So the specimen tends to fail in bearing mode. Hence, the mathematical models are best suited to obtain the results for failure loads after some experiments are carried.
For K/D=3, Quadratic equation is found to be best suited and is given by P = a + b*x1 + c*x2 + d*x12 + e*x22 + f*x1*x2
whereas for K/D=4, Full-cubic equation is suited and is given as
P = a + b*x1 + c*x2 + d*x12 + e*x22 + f*x13 + g*x23 + h*x1*x2 + i*x12*x2 + j*x1*x22
wherein the values of the co-efficients a, b, c, d, e, f, g, h, i and j are given in Table 2. Here model 1 represents specimens with K/D=3, model 2 for specimens with K/D=4
Table 2: Co-efficients of the model developed
MODEL a b c d e f g h i j
1 300.41 495.75 269.73 -74.5 -106 139.59
2 -438.5 1424.4 -294.1 -292.6 -118.79 22.37 39.61 416.57 -2.45 -72.12
VII. RESULTS AND DISCUSSION
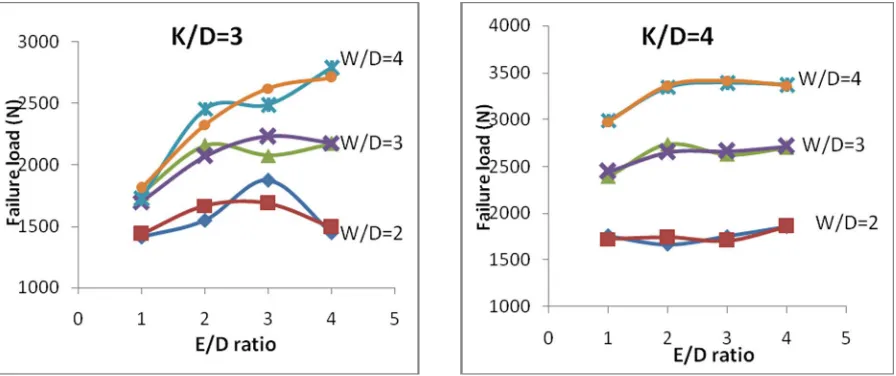
Glass epoxy composite plates with two serial pinholes subjected to traction forces by rigid pins are studied. Mathematical models were developed to determine the failure loads of specimens with different geometries. Fig. 3 represents the graphs showing the comparison between the existing experimental results and the results obtained from the mathematical models for different E/D, W/D and K/D ratios. Also, Table 3 gives the performance indices of mathematical model in comparison to experimental results. Mathematical models follow the same trend as that of experimental results.
With the increase in K/D, for constant W/D and E/D ratios the value of failure load P increases as the distance between the holes increases.
For a constant K/D, as E/D is kept constant, the failure load is found to increase considerably with increase in W/D. But when K/D=3 and E/D=1 the increase in failure load is very less with the increase in W/D ratio.
Copyright to IJIRSET DOI:10.15680/IJIRSET.2016.0505071 7133
Table 3: Performance indices of mathematical model
MODEL RMSE
CORRELATION COEFFECIENT
MEAN ABSOLUTE
ERROR
MEAN DISCREPANCY
RATIO
1 106.9021 0.967183 93.60767 0.999839
2 41.63612 0.997851 33.10833 0.999377
VII. CONCLUSIONS
In this paper, mathematical models have been developed to predict the failure loads of glass epoxy composite plates with two holes subjected to traction force by rigid pins.
When W/D=2, the specimens fail at lower loads for both K/D=3 and K/D=4. So geometrically when W/D=2 specimens are weak.
When E/D is constant, as W/D increases the failure load increases. The margin in the increase of failure load increases and then slightly decreases as E/D varies from 1-4.
Mathematical models show the same trend in the failure loads of specimens, when compared with the experimental models. So, for estimation of the failure loads within the range considered for the study, the mathematical models developed prove to be efficient with the given values of Correlation Co-efficient, Maximum Absolute Error, Mean discrepancy ratio and Root Mean Squared Error.
The use of mathematical equations is recommended after some experiments are done as it saves lot of experimentation time.
Copyright to IJIRSET DOI:10.15680/IJIRSET.2016.0505071 7134 REFERENCES
[1] Aktas, A., “Failure analysis of serial pinned joints in composite plates,” Indian Journal of Engineering and Material Sciences, Vol 18, 102-110,
2011
[2] Cesar Echavarrıa , Peer Haller , Alexander Salenikovich, “Analytical study of a pin–loaded hole in elastic orthotropic plates,” Composite Structures 79, 107–112, 2007
[3] Chang, F.K., Scott, R.A., Springer, G.S., “Strength of Mechanically Fastened Composite Joints,” Journal of Composite Materials, 16, 470-494,
1982
[4] Kadir Turan, Mete Onur Kaman, Mustafa Gur, “Progressive failure analysis of laminated composite plates with two serial pinned joints,” Mechanics of Advanced Materials and Structures 22, 839–849, 2015
[5] Khashaba, U.A., Sebaey, T.A., Alnefaie, K.A., “Failure and reliability analysis of pinned-joints composite laminates: Effects of stacking sequences,” Composites: Part B 45, 1694–1703, 2013
[6] M.B. Whitesiden, S.T.Pinho, P.Robinson, , “Stochastic failure modelling of unidirectional composite ply failure,” Reliability Engineering and
System Safety 108,1–9, 2012
[7] Murat Pakdil, “Failure analysis of composite single bolted- joints subjected to bolt pretension,” Indian journal of Engineering and Material Sciences, Vol. 16, 79-85, 2009
[8] Ozen, M., Sayman, O., “Failure loads of mechanical fastened pinned and bolted composite joints with two serial holes,” Composites: Part B
42, 264-274, 2011
[9] Soykok, I.F., Sayman, O., Ozen, M., Korkmaz, B., “Failure analysis of mechanically fastened glass fiber/epoxy composite joints under thermal