Detection of Proximity to Voltage Collapse by
Using L –Index
Elfadil.Z. Yahia
1, Mustafa A. Elsherif
2, Mahmoud N. Zaggout
3Assistant Professor, Department of Electrical Engineering, Misurata University Misurata, Libya1
Lecturers, Department of Electrical Engineering, Misurata, University Misurata, Libya2,3
ABSTRACT: Several systems are considered for the National Grid of Sudan show strong signs of voltage instability or voltage collapse. It is proposed in this work to investigate the proximity of power systems to voltage instability with special reference to the National Grid. This work describes real life application in detection of proximity to voltage collapse by using L-index method. The research challenge was found out an appropriate method for detection voltage collapse in an effective manner. This work reflects that through case study conducted in National Grid of Sudan. The work is started with L-index method or technique. The L-indices for a given load condition are computed for all load buses and the maximum of L-indices gives the proximity of the system to voltage collapse. This work reports an analytic synthesis of real experience acquired to solve problems concerning with detection voltage collapse in National grid. Our methods provided several results. The validity of results was discussed with the known IEEE 14-bus system, IEEE 30-bus system, in addition to other methods. In this paper after detection of proximity to voltage collapse a compensation method of mitigating the voltage collapse by supplying the reactive power at load buses is discussed and compares the results with and without compensation.
KEYWORDS:L-index method, voltage collapse, National Grid of Sudan, Voltage stability.
I. INTRODUCTION
Vol. 4, Issue 3, March 2015
this paper after detection of proximity to voltage collapse compensation methods of mitigating the voltage collapse by supplying the reactive power at load buses is discussed and compare the results with and without compensation. . On comparison of the results at the load buses it is seen that with capacitor bank at the load buses voltage collapse is mitigated in spite of heavily loading the system. This paper is organized as follows. In section II, describes the problem formulation of the L-index. Section III presents the case study for IEEE 14-bus, IEEE 30-bus as benchmark and Sudan National Grid. In section IV, presents results and discussions, and finally section V a conclusion is drawn by discussing the results.
II. PROBLEMFORMULATION
In order to become of practical value the indicator L has to be extended to the multi-node system, there are two categories of nodes which have to be distinguished. One is characterized by the behaviour of the PQ-node which stands for a type of consumer node, the other comprise the generator nodes which may be given by a PV-node or by the slack node. The transmission system itself is linear and allows a matrix representation of the power systems. The power system can be expressed as [14]:
𝐼𝑏𝑢𝑠 = 𝑌𝑏𝑢𝑠𝑉𝑏𝑢𝑠 (1)
Consider a system where,
n=total number of buses, with 1, 2…g generator buses (g) g+1, g+2,…,g+s SVC buses(s),
g+s+1, g+s+2,….., n the remaining buses(r=n-g-s)
A load flow result is obtained for a given system operating condition, which is otherwise available from the output of on-line state estimator.
𝐼𝐺 𝐼𝐿 = 𝑌
𝐺𝐺 𝑌𝐺𝐿
𝑌𝐿𝐺 𝑌𝐿𝐿 𝑉 𝐺
𝑉𝐿 (2)
𝐼𝐺= 𝑌𝐺𝐺𝑉𝐺+ 𝑌𝐺𝐿𝑉𝐿
𝐼𝐿= 𝑌𝐿𝐺𝑉𝐺+ 𝑌𝐿𝐿𝑉𝐿 Where 𝐼𝐺, 𝐼𝐿 and 𝑉𝐺, 𝑉𝐿represent currents and voltages at the generator nodes and load nodes and j=g+1, g+2,…..,n. Therefore
𝑉𝐿= 𝑌𝐿𝐿 −1𝐼𝐿− 𝑌𝐿𝐿 −1𝑌𝐿𝐺𝑉𝐺 (3)
𝐼𝐺= 𝑌𝐺𝐿 𝑌𝐿𝐿 −1𝐼𝐿+ (𝑌𝐺𝐺− 𝑌𝐺𝐿 𝑌𝐿𝐿 −1𝑌𝐿𝐺)𝑉𝐺 (4)
Equations 3and 4 in matrix form
𝑉𝐿 𝐼𝐺 =
𝑌𝐿𝐿 −1 𝑌𝐿𝐿 −1𝑌𝐿𝐺
𝑌𝐺𝐿 𝑌𝐿𝐿 −1 𝑌𝐺𝐺− 𝑌𝐺𝐿 𝑌𝐿𝐿 −1𝑌𝐿𝐺 𝐼 𝐿
𝑉𝐺
Rearranging the above matrix we get,
𝑉𝐿 𝐼𝐺 = 𝑍
𝐿𝐿 𝐹𝐿𝐺
𝐾𝐺𝐿 𝑌𝐺𝐺 𝐼 𝐿
𝑉𝐺 (5)
Where 𝐹𝐿𝐺 = − 𝑌𝐿𝐿 𝑌𝐿𝐺 are the required values which are obtained by repeated solutions of sparse linear equations. An L-index value away from 1 and close to 0 indicates improved system security. For an unloaded system with
generator/ load buses voltage 1.0
0
0, the L indices for load buses are close to zero, indicating that the system has maximum stability margin. For a given network, as the load/ generation increases, the voltage magnitude and angles change near maximum-power-transfer condition and the voltage stability indexj
L (at bus j) values for load buses
The L-index value for the
j
node can be rewritten as,𝐿𝑗 = 1.0 − 𝐹𝑗𝑖
𝑉𝑖
𝑉𝑗 ∠𝜃𝑗𝑖 + 𝛿𝑖− 𝛿𝑗
𝑖=𝑔
𝑖=1 (6)
𝐿𝑗 = 1.0 − 𝐹𝑗𝑖
𝑉𝑖
𝑉𝑗 𝐹𝑗𝑖
𝑟+ 𝑗𝐹
𝑗𝑖𝑚
𝑖=𝑔
𝑖=1 (7)
where
𝐹𝑗𝑖𝑟 = 𝐹𝑗𝑖𝑐𝑜𝑠 𝜃𝑗𝑖 + 𝛿𝑖− 𝛿𝑗
𝐹𝑗𝑖𝑚 = 𝐹𝑗𝑖𝑠𝑖𝑛 𝜃𝑗𝑖 + 𝛿𝑖− 𝛿𝑗
III. CASESTUDY
A single-line diagram of the IEEE 14-bus standard system extracted from [15]. It consists of five synchronous machines; two of them are providing both active and reactive power at buses 1 and 2, and the generators at buses 3, 4 and 5 are basically synchronous condensers; the base total loading level of the system is 259 MW and 81.3 MVar. The IEEE 30-bus test case is one of the widely used test cases available from the power system test case archive [15, 16]. Bus 1 and 2 are providing both active and reactive power, and the generators at buses 3, 4, 5 and 6 are basically synchronous condensers. All the remaining buses are load buses. The base total loading level of the system is 283.4 MW and 126.2 MVar.
The simplified one line diagram of Sudan National Grid is given in the Appendix. The system consists of 45-bus in two parts: a 500 kV system at bus 17, 18, 26 , 27 and a 220 kV system at the remaining buses ; the 220 kV network forms the backbone of the transmission system in the Sudanese National Grid, the maximum power can be generated in the Sudan is a round 1700 MW which comes from four power plants, Roseires, Khartoum North, Garri, and Merow, it has 41 transmission lines, 35 load buses, 8 tap-changing transformers, the base total loading level of the system is 1550 MW and 807.1 MVar [6].
IV.RESULTSANDDISCUSSION
The L-index varies in the range between 0 (for no load) to 1 (voltage collapse point). This index was implemented using MATLAB. Results are obtained for the IEEE (14-bus, 30-bus) systems as benchmark and the Sudan National Grid (SNG).
A. IEEE 14-bus System
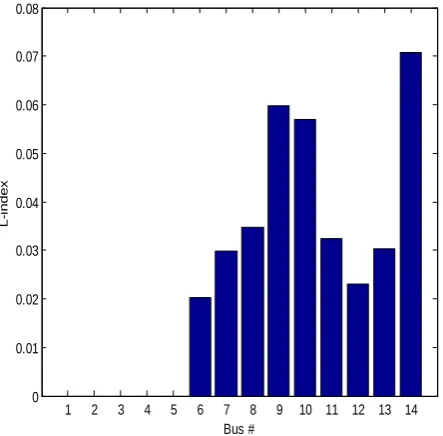
The IEEE 14-bus system is used as a benchmark test system. Result of a load flow simulation is used to illustrate how L-index predicts the voltage stability margin, and the results of the L-index computation are shown in table 1. It can be seen from the table 1 that the order of the worst load buses with the largest L-indices for the base and the critical case without compensation are almost the same. Therefore, bus 14 represents the weakest bus in the system.
Table: 1IEEE 14-bus L-index for the base case and voltage stability limit
Base case Voltage stability limit
Bus # L-index Bus # L-index
14 0.0708 14 1
9 0.0598 9 0.7912
10 0.0569 10 0.7641
8 0.0348 11 0.3245
11 0.0325 8 0.3108
13 0.0302 13 0.2348
7 0.0299 12 0.1469
12 0.023 7 0.1385
Vol. 4, Issue 3, March 2015
Figures 1, 2 shows the L-index versus the bus number without compensation; figure 1 represents L-index method for the base case and figure 2 represents L-index at voltage stability limit. For both case bus 14 represents the weakest bus in the system.
As indicated from Figs. 2 and 3, the maximum L-index at bus 14 is 1 and 0.588 respectively, therefore fig 3 after compensation the value will reduce from 1 to 0.588.
Fig. 1 IEEE 14-bus L-index for the base case without compensation
Fig. 2 IEEE 14-bus L-index for voltage stability limit without compensation
1 2 3 4 5 6 7 8 9 10 11 12 13 14
0 0.01 0.02 0.03 0.04 0.05 0.06 0.07 0.08
Bus #
L
-i
n
d
e
x
1 2 3 4 5 6 7 8 9 10 11 12 13 14
0 0.1 0.2 0.3 0.4 0.5 0.6 0.7 0.8 0.9 1
Bus #
L
-i
n
d
e
Fig. 3 IEEE 14-bus L-index for voltage stability limit with compensation
B. IEEE 30-bus System
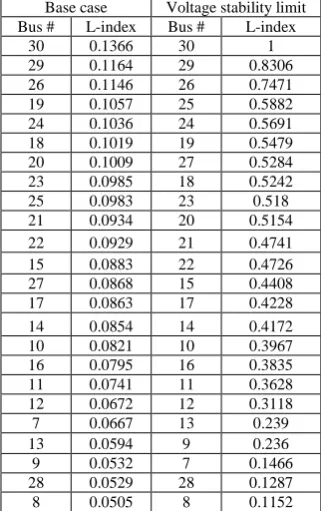
The IEEE 30-bus system is used as a benchmark; table 2 shows the order of the worst load buses with the largest L-indices for the base case and voltage stability limit without compensation are the same. Therefore, bus 30 represents the weakest bus in the system.
Table 2: IEEE 30-bus L-index for the base case and voltage stability limit
Base case Voltage stability limit
Bus # L-index Bus # L-index
30 0.1366 30 1
29 0.1164 29 0.8306
26 0.1146 26 0.7471
19 0.1057 25 0.5882
24 0.1036 24 0.5691
18 0.1019 19 0.5479
20 0.1009 27 0.5284
23 0.0985 18 0.5242
25 0.0983 23 0.518
21 0.0934 20 0.5154
22 0.0929 21 0.4741
15 0.0883 22 0.4726
27 0.0868 15 0.4408
17 0.0863 17 0.4228
14 0.0854 14 0.4172
10 0.0821 10 0.3967
16 0.0795 16 0.3835
11 0.0741 11 0.3628
12 0.0672 12 0.3118
7 0.0667 13 0.239
13 0.0594 9 0.236
9 0.0532 7 0.1466
28 0.0529 28 0.1287
8 0.0505 8 0.1152
1 2 3 4 5 6 7 8 9 10 11 12 13 14
0 0.1 0.2 0.3 0.4 0.5 0.6 0.7
Bus #
L
-i
n
d
e
Vol. 4, Issue 3, March 2015
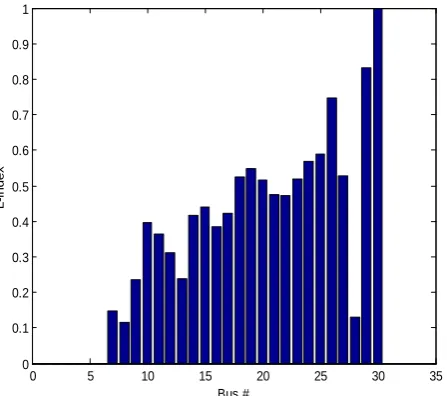
Figures 4, 5 shows the L-index versus the bus number without compensation; figure 4 represents L-index method for the base case and figure 5 represents L-index at voltage stability limit. For both cases bus 30, 29 and 26 represents the weak buses; therefore bus 30 is weakest bus in the system. In case of comparing between fig. 5 and 6 the maximum L-index at bus 30 is reduce from 1 in fig. 5 to 0.475 in fig. 6 it seem very clear the effect of compensation.
Fig. 4 IEEE 30-bus L-index for the base case without compensation
Fig.5 IEEE 30-bus L-index for voltage stability limit without compensation
0 5 10 15 20 25 30 35
0 0.02 0.04 0.06 0.08 0.1 0.12 0.14
Bus #
L
-i
n
d
e
x
0 5 10 15 20 25 30 35
0 0.1 0.2 0.3 0.4 0.5 0.6 0.7 0.8 0.9 1
Bus #
L
-i
n
d
e
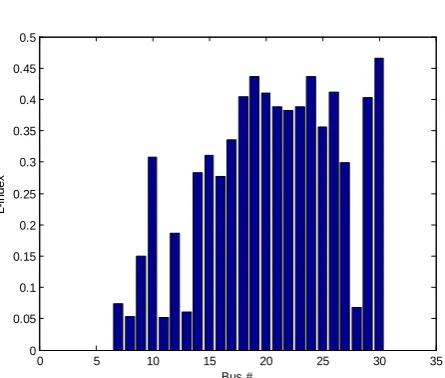
Fig.6 IEEE 30-bus L-index for voltage stability limit with compensation
C. Sudan National Grid
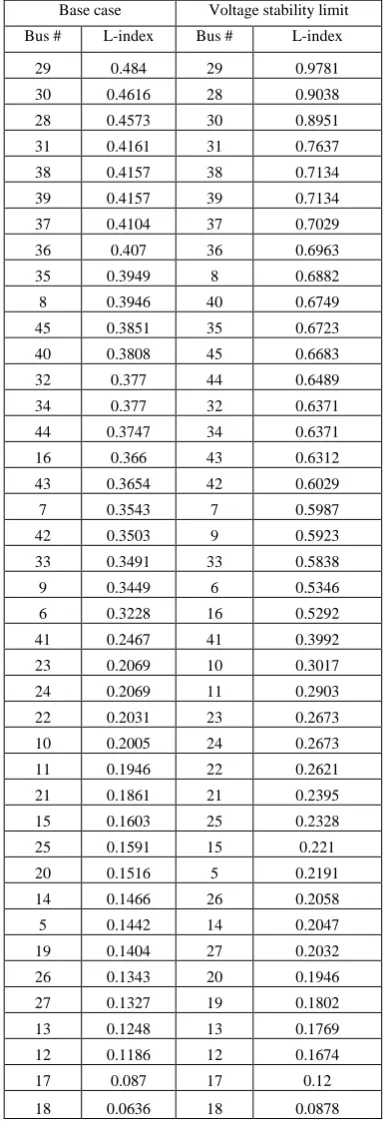
A single line diagram showing the Sudan National Grid is attached in appendix A. After intensive simulation of base and critical cases, the L-index computation of the worst buses in the system is listed in the table 3, which provides the results of the base and critical cases. It can be seen from the table 3 that the order of the worst buses with the largest L-indices for the base and the critical cases without compensation are almost the same. Based on these results it can be conclude that the buses of central areas which are representing 29, 28 and 30 are weakest buses for both cases.
Figures 7, 8 shows the L-index versus the bus number without compensation; figure 5 represents L-index method for the base case and figure 8 represents L-index at voltage stability limit. For both case the weakest bus is # 29 and further, it can be seen that buses 28 and 30 are standing out as the most critical. Therefore, the central area represents the weakest buses in the grid. Thus indicating an improvement in the voltage stability margin for the system. A comparison is also made between figs. 8 and 9 it is very clear that the maximum value of l-index is reduced from 0.9781 at bus 29 in fig. 8 to 0.489 in fig. 9 a reduction of about 50%, which indicating an improvement in the system voltage stability margin.
Fig. 7 Sudan National Grid L-index for the base case without compensation
0 5 10 15 20 25 30 35
0 0.05 0.1 0.15 0.2 0.25 0.3 0.35 0.4 0.45 0.5
Bus #
L
-i
n
d
e
x
0 5 10 15 20 25 30 35 40 45 50
0 0.1 0.2 0.3 0.4 0.5 0.6 0.7
Bus #
L
-i
n
d
e
Vol. 4, Issue 3, March 2015
Table 3: Sudan National Grid L-index for the base case and voltage stability limit
Base case Voltage stability limit
Bus # L-index Bus # L-index
29 0.484 29 0.9781
30 0.4616 28 0.9038
28 0.4573 30 0.8951
31 0.4161 31 0.7637
38 0.4157 38 0.7134
39 0.4157 39 0.7134
37 0.4104 37 0.7029
36 0.407 36 0.6963
35 0.3949 8 0.6882
8 0.3946 40 0.6749
45 0.3851 35 0.6723
40 0.3808 45 0.6683
32 0.377 44 0.6489
34 0.377 32 0.6371
44 0.3747 34 0.6371
16 0.366 43 0.6312
43 0.3654 42 0.6029
7 0.3543 7 0.5987
42 0.3503 9 0.5923
33 0.3491 33 0.5838
9 0.3449 6 0.5346
6 0.3228 16 0.5292
41 0.2467 41 0.3992
23 0.2069 10 0.3017
24 0.2069 11 0.2903
22 0.2031 23 0.2673
10 0.2005 24 0.2673
11 0.1946 22 0.2621
21 0.1861 21 0.2395
15 0.1603 25 0.2328
25 0.1591 15 0.221
20 0.1516 5 0.2191
14 0.1466 26 0.2058
5 0.1442 14 0.2047
19 0.1404 27 0.2032
26 0.1343 20 0.1946
27 0.1327 19 0.1802
13 0.1248 13 0.1769
12 0.1186 12 0.1674
17 0.087 17 0.12
Fig. 8 Sudan National Grid L-index for voltage stability limit without compensation
Fig. 9 Sudan National Grid L-index for voltage stability limit with compensation
V. CONCLUSION
This paper has discussed the formulation of L-index method in detail. The higher values for L- indices are indicative of most critical buses and thus maximum of L-indices is an indicator of proximity in the system to represent voltage collapse. Simulation results of the L-index were carried out on IEEE 14-bus system, IEEE 30-bus system (as benchmark) and the Sudan National Grid system. The results clearly indicate that L-index is stable in all cases above. The L-index based voltage stability index is simple to compute and it provides a quantitative means to review the voltage stability of the system at any given operating point. On comparison of the results at the load buses it is seen that with a capacitor bank at the load buses voltage collapse is mitigated in spite of heavily loading the system in case of comparing the status of compensated and uncompensated it is seen that the power transfer capability of the bus has
0 5 10 15 20 25 30 35 40 45 50
0 0.1 0.2 0.3 0.4 0.5 0.6 0.7 0.8 0.9 1
Bus #
L
-i
n
d
e
x
0 5 10 15 20 25 30 35 40 45 50
0 0.05 0.1 0.15 0.2 0.25 0.3 0.35 0.4 0.45 0.5
Bus #
L
-i
n
d
e
Vol. 4, Issue 3, March 2015
been increased after the addition of shunt capacitor. The comparison can best be achieved with help of the graph showing the Lindex in figures of compensated and uncompensated and this method of compensation is lowest cost compare with the other methods.
REFERENCES
[1] Thukaram , B. D., and Kashyap, K. H., "Artificial Neural Network Application to Power System Voltage Stability Improvement," in
TENCON 2003. Conference on Convergent Technologies for Asia-Pacific Region, pp. 53-57, 2003.
[2] Yorino, N., Sasaki, H., Masuda, Y., and Et al., ''An investigation on Voltage Stability Problems'', IEEE Transactions on Power Systems, Vol. 7,
No 2, pp 600-607, 1992.
[3] Tamura, Y. M., and Iwamoto, H. S., '' Relationship Between Voltage Instability and Multiple Load Flow Solutions in Electric Power Systems'',
IEEE Transaction on Power Apparatus and Systems, PAS-102, No 5, pp. 1115-1125 , 1993.
[4] Lof, P.A., Anderson, G., and Hill, D. J. , '' Voltage Stability Indices of the Stressed Power Systems'', IEEE Transactions on Power Systems,
Vol. 8, No. 1, pp. 326-335, 1993.
[5] Jinli, Z., and Yixin, Y., "Equivalent Network for Determination of Voltage Stability Limit", IEEE School of Electrical and
Automation Engineering Tianjin University, China, 2003.
[6] Yahia, F. Z., Doud, K. R., and Mohamed, D. E., ''Method of Computing Maximum Loadability Using Continuation Power Flow, Case Study
National Grid of Sudan'' , Proc of ICCEEE Conference, Sudan 26-28, august 2013.
[7] Bansilal, Thukaram, D., and Parthasarathy, K., ''Optimal Reactive Power Dispatch Algorithm for Voltage Stability
Improvement’’, Electrical Power and Energy Systems, Vol. 18, No. 7, pp. 461-468, 1996.
[8] Huang, G.M., and Nair, N.C., ''Voltage Stability Constrained Load Curtailment Procedure to Evaluate Power System Reliability
Measures'', IEEE Transactions on Power Systems, 2002.
[9] Sode –Yome, A., Mithulan, N. , and Lee, K.Y., "A Maximum Loading Margin Method for Static Voltage Stability in Power Systems", IEEE
Transactions Power Systems, Vol. 21, pp.799- 808, 2006 .
[10] Ruan, S. Y., Li, G. J., Ooi, B. T. and Sun Y.Z., "Power System Damping from Real and Reactive Power Modulations of Voltage Source
Converter Station", IET Genera, Transmission. & Distribution Journal 2, pp 311-320, 2008.
[11] Ahmed, N. A. , and Miyatake, M., " A novel Maximum Power Point Tracking for Photovoltaic Application under Partially Shaded Insulation
Conditions", Electric Power Systems Res. 8, pp777–784, 2008.
[12] Blaabjerj, F., Chen, Z., and Kiaer, S.B., " Power Electronics as Efficient Interface in Dispersed Power Generation Systems ", IEEE Transactions Power Electron, No 19, pp1186-1194, 2004.
[13] Khan, M.M., Arifin, S., Haque, A., and Al-Masood, N., “ Stability Analysis of Power System with the Penetration of
Photovoltaic Based Generation”, International Journal of Energy and Power Engineering, Vol. 2, No. 2, pp. 84-89, 2013.
[14] Kessel P., and Glavitsch, H., “Estimating the Voltage Stability of a Power System,” IEEE Transactions Power Delivery, Vol.
PWRD- 1, pp 346-354, 1986.
[15] University of Washington Power System Test Case Achieve, http://www.ee.washington.edu/research/pstca
APPENDIX
1
2
3
4
5
6
7
8
9
1
0
1
1
1
2
1
3
1
4
1
5
1
6
1
7
1
8
1
9 20 21 22 23 24
2
5
2
6 27
2
8
2
9
3
0
3
1
3
2
3
3
3
4
3
5
3
6
3
7
3
8
3
9
4
0
4