Decimated and Undecimated Wavelet
Transforms Based Estimation of Images
Koteswararao M
1, Dr. V.V.K.D.V. Prasad
2M.Tech Student, Gudlavalleru Engineering College, Krishna, Andhra Pradesh, India1
Professor of ECE, Gudlavalleru Engineering College, Krishna, Andhra Pradesh, India2
ABSTRACT: Estimating the images using wavelet transform is very popular method in different applications. In this paper a new thresholding function is developed with the combination of SCAD function and Soft function, it is introduced for wavelet based estimation of images. The performance of this function is tested by decimated and undecimated wavelet transforms. The qualities of image denoising are tested by the root mean square error (RMSE) and peak signal to noise ratio (PSNR). The performance of the new thresholding function gives better results than compared to decimated and undecimated wavelet transforms.
KEYWORDS: Wavelet transform, image denoising, decimated wavelet transform, undecimated wavelet transform, new thresholding function
I. INTRODUCTION
In many applications images are used. They will be transmitted from one place to another place, in this process some noise will be added to the images. Image denoising is used to produce good estimates of the original image from noisy observation. In image denoising so many methods like Gaussian filter, Non local mean, DUDE, Bilateral, Wiener filter, and Wavelet transform etc, .Out of this method mostly used technique for image denoising is wavelet transform. In this wavelet transform, the shrinkage method is popular method for estimation of images.
II. ALGORITHM FOR IMAGE DENOISING
In the field of image processing major problem occurred with noisy image. Estimation of images used to produce the good estimator for the original image from noisy image. The algorithm for the image denoising involves the following steps
a. The wavelet transform is applied on the noisy image
b. The output of the wavelet transform is noisy image wavelet coefficients c. Then the threshold value is fixed by applying the threshold rule d. The wavelet coefficients are changed using the threshold function e. The output of this function is applied to the inverse wavelet transform f. It gives the de-noised image or original image
The above algorithm for image denoising is implemented with different noise levels, different images and different wavelets. These results are compared across the different methods.
III.DECIMATED AND UNDECIMATED WAVELET TRANSFORM
Universal Method: This method was developed by Donoho and Johnstone. This is a universal thresholding method not depending on thresholding filter selected. The threshold value is calculated by
λ=σ 2𝑙𝑜𝑔𝑙
Where σ is the standard deviation, l is the length of the signal and λ is the threshold value
Undecimated wavelet transform: Undecimated means there is no decimation. Undecimated wavelet transform is applied on both down sampling in the forward wavelet transform and up-sampling in the inverse wavelet transform process.
Translation Invariant Method: Donoho and Coifman are introduced the translation invariant rule, it consists of carrying out shrinkage on each basis and taking the average of the obtained de-noised signals. There are two challenging effects present a improved detection of singularities due to taking into account all the shifts in the analysis and an effect of more powerful smoothing due to the averaging of the de-noised signals on each basis. A good cooperation consists of using quite unbalanced wavelet with a small support and applying soft shrinkage. This method can get better the compensation of the edges and it is also used for estimation of images.
IV.SHRINKAGE FUNCTION
Threshold rules are applied on the data and simply determine the shrinkage function. There are different categories of shrinkage functions
Soft Shrinkage Function: If the coefficient value (p) is greater than the threshold value (λ), then it taken as the difference between coefficient value and threshold value otherwise the value is zero.
𝑆 𝑝, 𝜆 = 𝑠𝑔𝑛 𝑝 𝑝 − 𝜆 𝑓𝑜𝑟 𝑝 ›𝜆
0 𝑜𝑡𝑒𝑟𝑤𝑖𝑠𝑒 Algorithm for soft shrinkage function
a. The coefficient values are taken as input to this function.
b. If the coefficient value is greater than the threshold value, then it taken as the difference between coefficient value and threshold value
c. If the coefficient value is less than the threshold value, then it taken as the zero value
SCAD Function:
SCAD (p, λ) =
sign p max 0, p − 𝜆 if p ≤ 2λ 𝛼 − 1 𝑝 − 𝛼𝜆 𝑠𝑖𝑔𝑛 𝑝
if 2λ ≤ p < 𝛼𝜆 p if |p| > 𝛼𝜆
Where α=3.7, SCAD means smoothly clipped absolute deviation
New Thresholding Function:
Algorithm for new thresholding function
a. New thresholding function is newly designed filter in this project.
b. It is developed based on the arithmetic mean of the SCAD function and soft thresholding function.
c. If the coefficient value (p) is greater than the thresholding value (λ), then it allows the function value,
otherwise it’s taken the twenty percentage of coefficient value with output of function.
V. RESULTS AND DISCUSSION
coefficients are modified according in to the thresholding function and apply the inverse wavelet transforms on the image finally get the original image or denoising image. The performance of the denoising is evaluated by using the PSNR & RMSE.
RMSE is defined as root mean squared error between original image and denoising image
RMSE = 1
𝑛 𝑋 𝑖 − 𝑋 𝑖
2 𝑛
𝑖=1
PSNR=20 log10 (255/√𝑀𝑆𝐸)
Where 𝑋 𝑖 the original image is 𝑋 𝑖 is the de-noised image, n is number of samples. The simulation experiment is repeated 100 times and average values are taken the process is conducted on different images and the results are same. This simulation is developed in MATLAB environment. The results of images for σ=10, 20 and 30 using Soft, SCAD and new thresholding filter with translation invariant method and top rule method are shown in Table 1 and Table2. Table 3 indicates the denoising results using universal method. The original and de-noised images using new thresholding filter with translation invariant method and Top rule method are shown in Figs a-d. Fig e shows de-noised image using universal method. Graph 1-6 show the comparison of the results of translation invariant, top rule and universal methods.
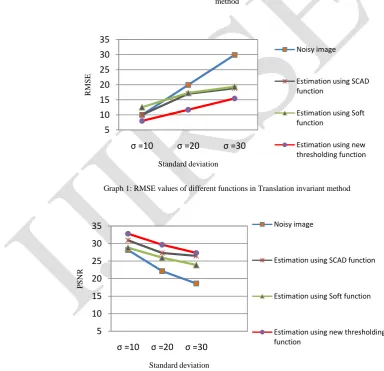
For σ=10, RMSE is 9.9789 and PSNR is 28.1491 are obtained on denoising of noisy image with SCAD filter and RMSE is 12.5291and PSNR is 26.1724 are obtained with soft thresholding function using translation invariant method (Table1). For new thresholding function RMSE of 8.0126 and PSNR of 30.0554are obtained (Table 1). From the above values, we can observe the new thresholding function performs better than the SCAD and soft thresholding function. Similarly performance is obtained for the remaining values σ=20 and 30 (Table 1).
Using Top Rule method, for σ =10, RMSE of 8.6680 and PSNR of 29.3725 are obtained on denoising of noisy image with SCAD thresholding filter and RMSE of 7.7700 and PSNR of 30.3224 are obtained with soft thresholding filter and RMSE of 8.6898 and PSNR of 29.3506 are obtained with new thresholding function similarly for σ=20, 30 are calculated (Table 2). ). From the above values, we can observe the new thresholding function performs better than the Soft function.
Using Top Rule method, for σ =10, RMSE of 8.6680 and PSNR of 29.3725 are obtained on denoising of
noisy image with SCAD thresholding filter and RMSE of 7.7700 and PSNR of 30.3224 are obtained with
soft thresholding filter and RMSE of 8.6898 and PSNR of 29.3506 are obtained with new thresholding
function similarly for σ=20, 30 are calculated (Table 2). ). From the above values, we can observe the new
thresholding function performs better than the Soft function.
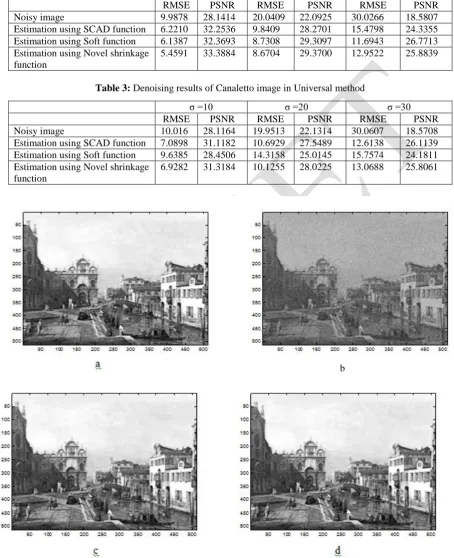
Using Universal method, for σ =10, RMSE of 9.5243 and PSNR of 28.5541are obtained on denoising of noisy image with SCAD thresholding filter and RMSE of 13.6533and PSNR of 25.4261are obtained with soft thresholding filter and RMSE of 9.6893 and PSNR of 28.4049 are obtained with new thresholding function similarly for σ=20, 30 are calculated (Table 3). From the above values, the new thresholding function performs better than the SCAD function.
Table 1: Denoising results of Canaletto image in Translation invariant method
σ =10 σ =20 σ =30
RMSE PSNR RMSE PSNR RMSE PSNR
Noisy image 9.9616 28.1642 19.9724 22.1222 29.9724 18.5964 Estimation using SCAD function 7.2515 30.9223 11.0058 27.2984 12.0765 26.4920 Estimation using Soft function 9.2539 28.8043 12.8294 25.9667 16.3175 23.8777 Estimation using new
thresholding function
Table 2: Denoising results of Canaletto image in Top method
Table 3: Denoising results of Canaletto image in Universal method
σ =10 σ =20 σ =30
RMSE PSNR RMSE PSNR RMSE PSNR
Noisy image 9.9878 28.1414 20.0409 22.0925 30.0266 18.5807 Estimation using SCAD function 6.2210 32.2536 9.8409 28.2701 15.4798 24.3355 Estimation using Soft function 6.1387 32.3693 8.7308 29.3097 11.6943 26.7713 Estimation using Novel shrinkage
function
5.4591 33.3884 8.6704 29.3700 12.9522 25.8839
σ =10 σ =20 σ =30
RMSE PSNR RMSE PSNR RMSE PSNR
Noisy image 10.016 28.1164 19.9513 22.1314 30.0607 18.5708 Estimation using SCAD function 7.0898 31.1182 10.6929 27.5489 12.6138 26.1139 Estimation using Soft function 9.6385 28.4506 14.3158 25.0145 15.7574 24.1811 Estimation using Novel shrinkage
function
6.9282 31.3184 10.1255 28.0225 13.0688 25.8061
Fig. 1 Image denoising (a) Original image (b) noisy image(σ=30) (c) de-noised image using new thresholding function with Translation invariant method (d) de-noised image using new thresholding function with Top method (e) de-noised image using new thresholding function with Universal
method
Graph 1: RMSE values of different functions in Translation invariant method
Graph 2: PSNR values of different functions in Translation invariant method 5
10 15 20 25 30 35
σ =10 σ =20 σ =30
R
M
S
E
Standard deviation
Noisy image
Estimation using SCAD function
Estimation using Soft function
Estimation using new thresholding function
5 10 15 20 25 30 35
σ =10 σ =20 σ =30
P
S
N
R
Standard deviation
Noisy image
Estimation using SCAD function
Estimation using Soft function
Graph 3: RMSE values of different functions in Top method
Graph 4: PSNR values of different functions in Top method
Graph 5: RMSE values of different functions in Universal method 5 10 15 20 25 30 35
σ =10 σ =20 σ =30
R M S E Standard deviation Noisy image
Estimation using SCAD function
Estimation using Soft function
Estimation using new thresholding function 5 10 15 20 25 30 35
σ =10 σ =20 σ =30
P S N R Standard deviation Noisy image
Estimation using SCAD function
Estimation using Soft function
Estimation using new thresholding function 5 10 15 20 25 30 35
σ =10 σ =20 σ =30
R M S E Standard deviation Noisy image
Estimation using SCAD function
Estimation using Soft function
Graph 6: PSNR values of different functions in Universal method
VI.CONCLUSION
In this paper, new thresholding function for wavelet thresholding denoising of image is proposed. The performance of this filter is evaluated for Canaletto image using decimated and undecimated wavelet transforms. These results are compared with existing soft and SCAD functions. In the undecimated wavelet transform the new thresholding function performs better results than compare to SCAD and soft function. In decimated wavelet transform, the new thresholding function gives better results than compared to soft function in Top method and new thresholding function gives better results than compared to SCAD function in Universal method.
VII. ACKNOWLEDGEMENT
The authors place on record their thanks to the authorities of Gudlavalleru Engineering College, A.P for the facilities they provided.
REFERENCES
[1]. Donoho,D.L.,(1995),DenoisingbySoftThresholding,IEEE Trans.InformationTheory,Vol.41,No.3,pp613-627
[2]. Manjitkaur,(2013), image denoising using wavelet transform, International Journal Of Engineering And Computer Science vol. 2, No 10 , pp
2932-2935
[3]. Sanjay Jangra, RavinderNathRajotiya(2013) An Improved Threshold Value for Image Denoising Using Wavelet Transforms, Sanjay Jangra et al
Int. Journal of Engineering Research and Applications ISSN : 2248-9622, Vol. 3, Issue 6, Nov-Dec 2013, pp.1893-1897
[4]. Hari Om, Mantosh Biswas (2012), an Improved Image Denoising Method Based on Wavelet Thresholding, Journal of Signal and Information
Processing, vol. 3, pp 109-116
[5]. Rajesh Kumar Rai, Trimbak R. Sontakke , Implementation of Image Denoising using Thresholding Techniques, International Journal of
Computer Technology and Electronics Engineering (IJCTEE) Vol. 1 , Issue 2
[6]. Dr.V.V.K.D.V.Prasad (2013) ‘A New Wavelet Packet Based Method for Denoising of Biological Signals’, International Journal of Research in
Computer and Communication Technology, Vol.2, Issue.10, pp.1056-1062.
[7]. AkhileshBijalwan, Aditya Goyal, NidhiSethi, (2012) Wavelet Transform Based Image Denoise Using Threshold Approaches, International
Journal of Engineering and Advanced Technology (IJEAT) ISSN: 2249 – 8958, Volume-1, Issue-5, June 2012
[8]. RubanBrar, Rajesh Kumar (2013), Image Denoising Using Wavelet Thresholding Hybrid Approach Proceedings of SARC-IRAJ International
Conference, 22nd June 2013, New Delhi, India, ISBN: 978-81-927147-6-9
[9]. Virendra Kumar, Dr. Ajay Kumar (2013), Simulative analysis for Image Denoising using wavelet thresholding techniques, International Journal
of Advanced Research in Computer Engineering & Technology (IJARCET) Volume 2, No 5, May 2013
[10]. Dr.V.V.K.D.V.Prasad (2008) ‘Denoising of Biological Signals Using Different Wavelet Based Methods and Their Comparison’, Asian Journal
of Information Technology, Vol.7, No.4, pp.146-149. 5
10 15 20 25 30 35
σ =10 σ =20 σ =30
P
S
NR
Standard deviation
Noisy image
Estimation using SCAD function
Estimation using Soft function
BIOGRAPHY
KOTESWARARAO M received the B.Tech degree in Electronics and Communication Engineering in 2011 from Nalanda institute of engineering & technology, M.Tech pursuing Digital Electronics and Communication Systems in Gudlavalleru engineering college.