Simulating Vertical Soil Variability for a Generic Site
Sujit K. Samaddar1 and Zahira Cruz-Perez2 1
Branch Chief, Office of New Reactors, U.S. Nuclear Regulatory Commission, Washington, DC 2
General Engineer, Office of New Reactors, U.S. Nuclear Regulatory Commission, Washington, DC
ABSTRACT
One of the main sources of uncertainty in a site response analysis is the approximations introduced in analytically simulating the actual behavior of the soil during a specified level of ground shaking. The soil is represented by a series of horizontal layers that represent the site soil profile. Soil profiles from any site show variations in soil properties both horizontally and vertically. A column of soil taken from different locations of a site may not only vary in physical properties but also in the depth of a given soil strata. This paper reviews the effect that variation in depth, as would result from sloping soil layers, has on site response analysis using an equivalent linear methodology and a horizontally layered site model. The study proposes limits for this variation that can be accommodated within the assumptions of a uniformly layered site model.
INTRODUCTION
Ground motion as a result of seismic activity has been the propellant for the dynamic analysis of structures founded on the upper layers of the soil profile. The input motion in the dynamic analysis of a structure is based on the knowledge of either the seismic motion at the free-surface, the motion at base rock or a rock outcrop. The procedures, that include the effect of the local site soils in the determination of the free surface ground motion, are termed as site response analysis. At this juncture, it is important to clarify the distinction between the two terms: characterization and idealization. Site characterization is the process of identifying the distribution of the materials and their associated physical properties and behavior over the depth of the soil column. Idealization is the analytical representation of these physical characteristics of the material in the soil column and is often a simplification from the real behavior for numerical analysis.
Of the many methods for evaluating the effect of local site conditions on ground response during a seismic activity probably the most widely used is the one dimensional equivalent linear site response analysis. In this methodology the site is assumed to be composed of a series of horizontal layers of infinite extent in the horizontal direction with uniform soil properties through the entire depth and horizontal extent of each layer. This model of the soil system is subjected to upward propagating horizontal shear waves from the underlying rock formation. The ground surface response of such a system is the site response or free-field response. Different computer programs have utilized this model of the soil system in determining a solution to the analytical problem, of these possibly the most widely used is the computer program SHAKE: A Computer Program for Earthquake Response Analysis of Horizontally Layered Sites [1].
The necessity to include the non-linear behavior of soils in the site response models has been identified in many technical papers. Different methods to account for this non-linearity have also been proposed [2], [3], [4] & [5]. To account for the variability of the soil properties associated with each layer a statistical measure is applied to the mean property. In most cases the mean local site specific soil properties are modified using some statistical measure of soil properties determined from field investigations. Other investigators have explored probabilistic approaches to quantify the variability in soil properties. For site specific analysis the free-field responses and the subsequent soil structure-interaction results are usually bounded by the results of three separate cases namely the best estimate, upper bound and the lower bound. The essential differences between the proposed methodologies have been in the derivation of the bounding cases. In this model as well as in other models investigators have established that there are variations in the free-field motion due to the changes in the height of the soil column. This paper explores the effect of changes in the depth of individual layers in a soil column on the free-field motion as a result of uniformly sloping soil strata.
SCOPE
In analytical models the variation in the physical properties is idealized by bounding the analysis using multiple soil columns or statistically varying soil properties for each soil layer. The effect of the slope in the soil profile is ignored in the analytical model. This study attempts to identify the maximum fluctuation of a layer depth without influencing the free field response in an attempt to quantify the maximum slope in a soil layer that can be tolerated in the idealization scheme. The study takes a soil profile and the associated soil layer properties and analyzes the profile for different layer depths for a specified ground motion. The resulting free field spectrum is used as a normalizing spectrum. A series of analysis is
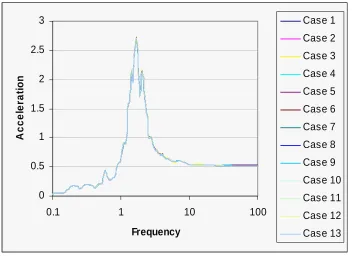
series of site response analysis for a set of soil profiles that duplicate varying degrees of sloped soil layers. A base case soil profile is established which is 45.72 m(150) in height with two 1.52m (5) deep layers and fifteen 3.05 m(10) deep layers. The profile has three types of material sand, clay and base rock. Each of the material is associated with its respective properties. The material properties include soil density; damping verses strain data, and shear wave velocities for each soil layer. The input motion is the TCU070 -W horizontal time history of the 1999 Chi Chi earthquake. Using this information the site response analysis is conducted using SHAKE. To simulate a single sloping layer in the profile, a series of thirteen case were analyzed varying the soil layer depth at different soil layer without changing the over all height of the soil column. Starting with Layer 2 the soil depth was increased in Layer 2 by 1.52m and decreased in Layer 3 by 1.52m. This process was carried through the height of the soil column layer by layer. The change in the layer depth represents about a 10 degree slope over 30.48 m. The effect of these changes in the soil column on the response at the surface is shown in Figure 1.
0 0.5 1 1.5 2 2.5 3
0.1 1 10 100
Frequency
A
ccel
er
at
io
n
Case 1
Case 2
Case 3
Case 4
Case 5
Case 6
Case 7
Case 8
Case 9
Case 10
Case 11
Case 12
Case 13
Figure 1
0 0.5 1 1.5 2 2.5 3
0.1 1 10 100
Frequency
A
ccel
er
at
io
n
Series 21 Series 22 Series 23 Series 24 Series 25 Series 26
Figure 2
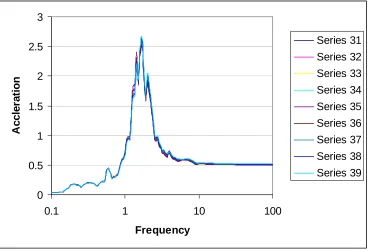
A subsequent series of analysis was conducted using the same generic soil profile but increasing the change in the layer depth to 3.05m which is approximately 30 degree slope at 61m. As like the previous cases individual layer depths were increased and decreased in pairs keeping the over soil column height the same as the base case. The responses from this set of analyses are shown in Figure 3.
0
0.5
1
1.5
2
2.5
3
0.1
1
10
100
Frequency
A
ccl
er
at
io
n
Series 31
Series 32
Series 33
Series 34
Series 35
Series 36
Series 37
Series 38
Series 39
30.48m 30.48m
45.72m
Base
Figure 4
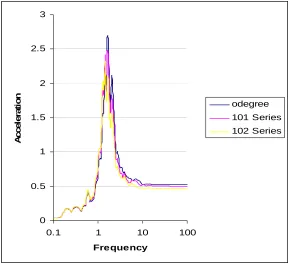
Three slope angles were investigated 10, 20 and 30 degrees. The site response was developed at three locations starting with the base location with a soil column height of 150 ft with a subsequent location at 30.48m(100) and a third location at 60.96m(200) away from the base. The 30.48m (100) and 60.96m (200) distances were used as they represent the borehole spacing normally used during characterization of nuclear plant site. The change in the height of the soil column with respect to the base was spread through the height of the soil column so as not to influence the shear wave velocity profile at any one layer. Two sets of analyses were made using each slope. The results from these analyses are presented in Figures 5 through 7.
0 0.5 1 1.5 2 2.5 3
0.1 1 10 100
Frequency
A
c
cel
er
at
io
n
odegree
101 Series 102 Series
0 0.5 1 1.5 2 2.5 3
0.1 1 10 100
Frequency
Ac
c
e
le
ra
ti
o
n
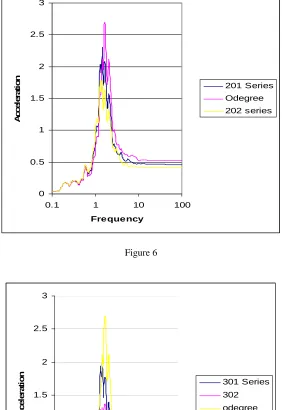
201 Series Odegree 202 series
Figure 6
0 0.5 1 1.5 2 2.5 3
0.1 1 10 100
Frequency
A
cce
ler
at
io
n
301 Series
302
odegree
Figure 7
The results are grouped by the slope of the layers and their distance from the base. O Degree in the Figures represent the base response 101 series represents the response of the soil column with a 10 degree slope at 30.48m(100) from the base.
If changes to the soil column depth are allowed then the response changes to the response are considerable as is seen in Figures 5 through 7. Bigger the change in the column height the more significant the difference in the response between the base case and the soil profile being evaluated. This is not an unexpected result and is consistent with the analytical model and numerical analysis scheme.
Recommendation
The authors recommend that caution be used when accepting the results of site response analysis for a site with known sloping layers. The statement of a numerical value for aslope is not an adequate criteria for acceptance especially if the height of the soil column is expected to change over the sloping layers. The site response analysis should reviewed in conjunction with the soil profile to ensure that the sloping layer do not increase the soil column height used for the site response analysis.
REFERENCES
Schnabel, P.B., Lysmer, J., and Seed, H.B., “SHAKE: A computer program for earthquake analysis of horizontally layered sites,” Report No. EERC 72-12,Earthquake Engineering Research Center, College of Engineering, University of California, Berkeley, 1972
Streeter,V.L., Wylie,E.B. and Richart,F.E., ”Soil motion computations by characteristics methods,” Proc., ASCE National engineering Conference, San Francisco, 1973.
Lee,M.K.W and Finn,W.D.L., “DESRA-2, Dynamic effective stress response analysis of soil deposits with energy transmitting boundary including assessment of liquefaction potential,”Soil Mechanics Series No.38, University of British Columbia, Vancouver, 1978
Prevost, J.H.,DYNA1D: a computer program for nonlinear seismic site response analysis-Technical documentation, Report NCEER-89-0025, National Center for earthquake engineering Research, Buffalo, New York, 1989.