Visualizing Collaborative Time-Varying Scientific
Datasets
J. M. Sharif
∗, M. S. S. Omar
†, M. S. A. Latiff
∗and M. A. Ngadi
∗†Bioinformatics Research Lab, Faculty of Science, University Technology of Malaysia, Johor, Malaysia
∗Department of Computer System & Communication, University Technology of Malaysia, UTM Skudai, 81310, Malaysia
Email: [email protected], [email protected], [email protected], [email protected] Telephone: (+607) 5532384 Fax: (+607) 5565044
Abstract— Our perceptive of the scientific datasets has largely relied on numerical and statistical analysis of data from experimental dimension and computer simulation result [4][14][11][12][13]. In particular, we consider a simulated 3D time-varying model of scientific datasets and examine the tem-poral correlation among datasets. Our goal is to contrive effective visual representations to assist scientists in ascertaining temporal correlation among intricate and apparently chaotic scientific datasets. We propose a hybrid application with combination of streamline, global and local color scale and opacity scheme for spatio-temporal collaborative depiction. We illustrated also few images that can offer an effective tool for visually mining 3D time-varying scientific datasets.
Keyword: scientific data, visualization, hybrid scheme, coding theory, color scale, time-varying data, spatio-temporal visualization, molecular dynamics, visual
representation
I. INTRODUCTION
A spatio-temporal data set is a collection of data where data values vary in both space and time. Abstractly, such a data set can be considered as a (continuous and discrete) specification of a function, F: Ed × T → Rn, where Ed denotes d-dimensional Euclidean space, T = R∗ ∩ {∞} the domain of time, and Rn an n-dimensional scalar field. Examples of such data sets include time-varying simulation results, films and videos, time-varying medical scans, geometrical models with motion or deformation, meteorological measurements and many more.
For lower dimensional spatio-temporal data sets, it is com-mon to visualise to such data sets using line graphs, bar charts or other pictorial representations of a similar nature. For more complex spatio-temporal data sets, such as time varying geometrical models, it is common to render a visualization of spatial data at each time step, and display a series of visualization in a temporal order as animation. However, viewing animation or movies in general, is a time-consuming and resource-consuming process.
In visual data mining, viewing movie in order to extract meaningful information also relies on viewer’s ability to remember characteristics of specific visual features in the movies as well as their skills interpreting various changes of these features correctly, often within a very a small window of time. Hence, the effectiveness of viewing usually declines rapidly when viewing period extends.
It is therefore highly desirable to use visualization to sum-marize meaningful information in higher dimensional spatio-temporal data sets. With a carefully prepared visualization which convey both spatial and temporal features, the human vision systems, perhaps the most intelligent vision system, may be able to interpret spatio-temporal features in the vi-sualization.
For example, in physics the existence of spatio-temporal collaborative in ion trajectories in glasses was suggested by experimental results. However, any detailed observation of such collaboration character is not possible at moment. Meanwhile, our understanding of the structure of the glass and the ion trajectories has been enhanced with computer simulation followed by statistical analysis. However due to the size and complexity of the time-varying data generated, the details of the structure-transport relationships in the data were usually overlooked in favour of ensemble average in sta-tistical analysis. Many scientific puzzles associating with the collaborative phenomena in ion trajectories remain unsolved and challenge the visualization technology to help uncover the spatio-temporal relationship between glass structure and ion trajectories.
During analysis, some of the data sets could be very big such as Beazleay and Lomdahl [1] were presented the method that can be used for very large scale molecular dynamic simulation. Meanwhile, Zhu et al. [16] were presented a grid technology and parallel rendering approach for visualizing a massive molecular datasets. Bulatov and Grimes [3] used a video visualization technique called MPEG-based method to generating a video clips that depict the animated movement of atoms. However, viewing animation or movie in general is a time-consuming and resources-consuming process.
ellipsoid. This method will modify some of the interesting point in our works which is the main objective to visualise a timeline events of ion trajectories.
Instead of clustering or grouping the trajectories, Huitema and van Liere [7] filter out uninteresting atom motion from the larger concerted motions. Same with Wiley et al. [15], they used a similar approach with fourier and hilbert method for filtering a frequency of sample trajectory. Horiuchi and Go [6] also used a similar approach on molecular dynamic trajectories to extract the lowest frequency mode from the simulation data. The method shown by Huitema, Horiuchi and Wiley will remove some of the interesting trajectory which is critical to our main purpose to visualise a timeline of trajectories.
The objective of this work is to develop effective visual representation and visualization techniques to help scientists extract meaningful spatial and temporal information from spatio-temporal datasets. In this paper, we propose a hybrid scheme that uses streamline for orientation, color scale and color number coding scheme for depicting a timeline events and zooming effect with transparency scheme for probability of collaboration. With a collection of visual examples, we demonstrate that this scheme can offer an effective tool for visually mining 3D time-varying datasets. We show that the visualization not only confirm the presence of collaborative phenomena in ion dynamics but also help identify the dynamic patterns and trigger events of such movements. This enables scientists involved to develop more elegant and comprehensive hypotheses about scientific datasets.
The ability to convey temporal as well as spatial information is critical in our particular application, where the scien-tists need a visual representations that can effectively high-light the correlation between different ions in their motions among seemingly chaotic trajectories especially in collabora-tive events. This particular challenging requirement provided this work with the principal motivation.
In the rest of this paper, we will describe the application concern and scientific background in Section 2. In this section, we will first examine the methods that can convey orientation information to viewers. We will devote most of our focus to the visualization of temporal information in order to confirm and identify the time series activities in the data sets. In Section 3, we will present some results of visual data mining process on glassy ion trajectories if there is a collaboration events, which will be followed by our concluding remarks in Section 4.
II. VISUALIZINGIONDYNAMICS
In this section, we will first examine the more challenging task for visualizing temporal information in order to identify the series of events and collaborative events. We will discuss the use of glyph, color and opacity in our visual representa-tions and present the methods for constructing and rendering composite visualization that convey a rich a collection of indistinguishable visual features for assisting in a visual data mining process.
A. Orientation
Given an ion trajectory as a series of n + 1 points,
p0, p1, ..., pn, we have n consecutive vector segments,
v1, v2, ..., vn, where vi = (pi−pi−1). One can visualise such a trajectory using streamlines or vector glyphs.
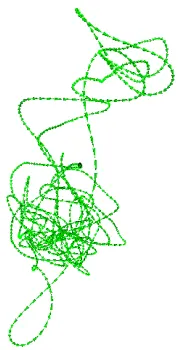
In Figure 1, even though each conical glyph, which rep-resents a vector segment, depict the instantaneous velocity at a given time interval with its length and the direction of the motion with its pointer but its does not much help to visualise a time series events and collaborative issues in ion dynamic without the combination of color scale. In the next section, we will shows the color scale can give more understandable about time series events in ion dynamics.
Fig. 1. A trajectory of sodium #169
B. Temporal Information
When using visualization to summarise a series of events along a timeline, perhaps the most difficult task is to associate a particular event with a precise moment on the timeline. This is useful not only determine the time of an event but also for the identification corresponding parties involved in collaborative, but collaborative events is not included at moment.
1) Global Color Scale: In order to shows the global
time-line of events on streamtime-line, we introduced Global Key Colors
Scale. In this scheme, we use a small set of color,c1, c2, ..., ck
(k >1), then we assigned a colors to specific vector in the vector series :
v1 vu ... vv ... vn
c1 c2 ... ci ... ck
segment indistinguishable. Moreover, it is possible to have the same or similar interpolated colors between different sets of consecutive key colors.
Fig. 2. Seven Key Colors for trajectory of sodium #169
2) Local Color Scale: In order to correlate each vector
segment with the timeline more accurately and hence to improve the differentiation of different vector segments, we introduce a Color Number Coding Scheme in our visualization. Given a small set of key colors, c1, c2, ..., ck (k > 1) and distinctive interval-color (e.g., while, black or grey depending on the background color), we code a group of consecutive
m vectors as a k-nary number, terminated by a vector in the interval-color. Givennas the total number of vectors and we always assign the interval-color to the first vector, we need to find the smallest integer mthat satisfies Equation 1;
((m+ 1)km)≥n (1)
For instance, when n = 1000, using two key colors, say red and green, we need in m = 7 color digits. We havem = 5 for k = 3, m = 4 for k = 4, and m = 2 when k reaches 19. The selection of m and k needs to address the balance between a smaller number of colors or a smaller number of color digits in each group of vectors. The former ensures more distinguishable colors in visualization, and the alter reduces the deductive effort for determine the temporal position of each vector. Figure 3 shows a quaternary color coding scheme for ion tracks with 1000 vectors.
III. COLLABORATIVEIONDYNAMICS
When collaborative events is takes place between ions in the simulation results then the possible method that we could used is opacity scheme. But the details of this scheme, implementation and result will become the future works of this study. Even in this paper we are not focusing on collaborative events but we extended a brief regarding transfer function that could be possible in our application.
By combining all the above methods, we provide an ef-fective visual representation for visualizing collaborative ion
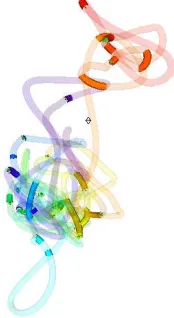
Fig. 3. Quaternary Color Coding Scheme on sodium #169 trajectory.
Fig. 4. Combination of visualization collaborative ion dynamics
dynamic. Figure 4 shows the example of collaborative events in ion dynamics.
The main objectives of this task is to discover if collab-oration is exhibited between ions in the simulation results. As described previously, there is not well-defined description about collaboration events, although experiments suggested the existence of collaboration phenomena. We, including the physicists involved, did not know in what form a collaborative event may display, in what way ions may cooperate with each others or what event may cause ions entering in or disengaging from collaboration. Therefore we have introduced a variable,
ψ, representing the probability of collaboration. Given a set of mhypothesized criteria of collaboration, we have :
Given two corresponding vector segments, va,i and vb,i, belonging to two different ion trajectories, we have:
ψ1=
1 2
va,i•vb,i
|va,i||vb,i|
D1
(3)
where D1 ≥ 0 is de-highlighting factor. The larger the D1 is, the less probable a vector is considered being involved in collaboration. With ψ1, va,i and vb,i are considered to be in collaboration, if they follow a similar direction.
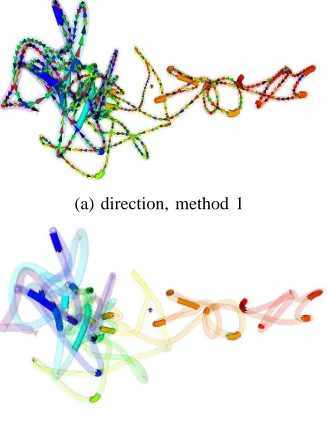
Once we have computed ψ ∈ [0,1], we can highlight or dehighlight the corresponding vector segments. Two different methods of highlighting the probability of collaboration are shown in Figure 5. We chosen a small sample because it is easy for clarification purpose. In (a), we apply an opacity of tube around the glyphs with a high ψ value, which in effect defines the opacity of the tube. In (b), we use the value of
ψ to modify an opacity of the corresponding tube and vector segment . When, if there is a high probability of collaboration, the tube and vector glyphs are fully opaque and if there is a low probability, they are almost totally transparent. The second method seems to convey information with more certainty to human observer.
(a) direction, method 1
(b) direction, method 2
Fig. 5. The possible collaboration between Na #211 and Na #106, whenψ
was computed withψ1 (only #106 is shown)
In Figure 5, (a) and (b) show the probability computed using ψ1 between each of the ion trajectories Na #106 with Na #211. From this visual examples, the scientists would be able to trigger the collaborative events effectively. Without highlighting and de-highlighting based on ψ, it would be difficult to observer this phenomena directly.
By combining some above-mentioned methods together, we provide an effective visual representation for visualizing spatio-temporal collaboration. With the help of global color scale, the scientists can determine the global time frame of
the events, for example, t = 0 can be easily found between two consecutive color. For more details, local color scale will help to determine which corresponding ions in collaboration. These will give such an idea to our future works to enhance the capability in helping the scientists to determine the corre-sponding parties involved in collaboration issues.
IV. CONCLUSION
We have developed an effective visual representation, which have combined from several schemes including streamlines for orientation, color scale for time series events and opacity scheme for collaborative events. Again, all these schemes can be beneficial also in another field of study like biophysics, bi-ological, bioinformatics or any collaboration events especially in time-varying events. In the future works, we plan to extend the works in conveying temporal information in a high degree of certainty before we go further on visualizing collaborative events in ion dynamics.
REFERENCES
[1] D. M. Beazley and P. S. Lomdahl. Lightweight computational steering of very large scale molecular dynamics simulations. In Conference on High Performance Networking and Computing. IEEE, 1996.
[2] C. Best and H.-C. Hege. Visualizing and identifying conformational ensembles in molecular dynamics trajectories. In Computing in Science and Engineering, pages 68–74, 2002.
[3] V. L. Bulatov and R. W. Grimes. Visualization of molecular dynamics simulations. In Eurographics UK Chapter, 1996.
[4] K. Funke. Jump relaxation in solid electrolytes. Progr. Solid State Chem, 22:111–195, 1993.
[5] H.L. Gordon and R.J. Somorjai. Fuzzy cluster analysis of molecular dynamics trajectories. volume 14, pages 249–264, Oct 1992.
[6] T. Horiuchi and N. Go. Peojection of monte carlo and molecular dynamics trajectories onto the normal axes : human lysozyme. In Proteins, volume 10, pages 106–116, 1991.
[7] H. Huitema and R. V. Liere. Interactive visualization of pro-tein dynamics. In Proceedings of Conference on Computer Graph-ics(VISUALIZATION 2000), pages 465–468. IEEE, Oct 2000. [8] J. Imada, P. Chapman, and S.M. Rothstein. Recognizing patterns in
high-dimensional data: automated histogram filtering for protein structure elucidation. In 19th International Symposium on High Performance Computing Systems and Applications, 2005. HPCS 2005, pages 238– 243. IEEE, May 2005.
[9] M.E. Karpen, D.J. Tobias, and C.L. Brooks. Statistical clustering techniques for the analysis molecular dynamics: Analysis of 2.2-ns trajectories of ypgdv. volume 32, pages 412–420, Jan 1993.
[10] S.L. Kazmirski, A. Li, and V. Daggett. Analysis methods for comparison of multiple molecular dynamics trajectories: Applications to protein unfolding pathways and denatured ensembles. volume 290, pages 283– 304, Jan 1999.
[11] K. L. Ngai. Analysis of nmr and conductivity-relaxation measurements in glassyli2s-sis2fast-ion conductors. Physical Review B, 48, 1993.
[12] K. L. Ngai, G. N. Greaves, and C. T. Moynihan. Correlation between the activation energies for ionic conductivity for short and long time scales and the kohlrausch stretchting parameter b for ionically conducting solid and melts. Phys. Rev. Lett, 80:1018–1021, 1998.
[13] K. L. Ngai, Y. Wang, and C. T. Moynihan. The mixed alkali effect revisited : importance of ion interactions. Journal of Non-Crystalline, 307-310:999–1011, 2002.
[14] W. Smith, G. N. Greaves, and M. J. Gillan. Computer simulation of sodium disilicate glass. Journal Chemical Physics, 103, 1995. [15] Adrian P. Wiley, Martin T. Swain, Stephen C. Phillips, Jonathan W.