Structural Optimization of Silica-Based
2
×
2
Multimode Interference
Coupler Using a Real-Coded Micro-Genetic Algorithm
Takashi Yasui*, Jun-ichiro Sugisaka, and Koichi Hirayama
Abstract—We propose a structural optimization method based on a real-coded micro-genetic algorithm to realize a weakly guided 2×2 multimode interference (MMI) coupler with low imbalance and excess loss over a wavelength range from 1520 to 1580 nm. The proposed method was applied to silica-based 2×2 MMI couplers with a relative refractive index difference of 5.5%. The optimized result showed an imbalance of less than 8.4×10⁻³dB, an excess loss of less than 0.14 dB, and a normalized output power of more than 48% over the operation wavelength range. The proposed method achieved an optimized 2×2 MMI coupler after 250 times of propagation analysis per wavelength, which is less than 6.7% of those by the conventional methods for 4×4 and 1×4 MMI couplers, and was proven to be more effective than the conventional methods. To consider realistic optical devices, 2×2 MMI couplers whose values of structural parameters are close to the optimized values within the accuracy of typical fabrication tolerance are also analyzed. The results are comparable to those of the optimized 2×2 MMI coupler.
1. INTRODUCTION
A multimode interference (MMI) coupler is an important and widely used component in photonic integrated circuits (PICs), such as 3-dB couplers [1–3], optical hybrids [4–6], multi/demultiplexers for mode-division multiplexing (MDM) transmission [7, 8], Mach-Zehnder interferometers for wavelength meters [9], and differential phase shift keying (DPSK) demodulators [10]. An MMI coupler with M input andN output access waveguides is referred to as anM×N MMI coupler. The most widely used application of a MMI coupler is possibly the 2×2 MMI coupler as a 3-dB coupler [1–5].
To fabricate PICs, the most promising and widely used materials are Si nano wire [1, 7, 8, 10], InP [2, 3, 6, 9], and silica [4, 5, 11]. All these materials have drawbacks and advantages. The InP and Si nano wire waveguides are advantageous for high-density integration and integration of active elements such as photo-detectors, but have drawbacks such as high propagation loss and high coupling loss to single-mode fibers (SMFs). On the other hand, the silica waveguides have advantages such as extremely low propagation loss, low coupling loss to SMFs, and low polarization dependence, but the silica waveguides are larger than those of the InP or Si nano wires. To overcome this disadvantage, silica waveguides with high refractive index difference between core and clad have been used to realize compact silica waveguides, as reported recently [11].
In general, the structural parameters of an MMI coupler, such as its length and the positions of the input and output access waveguides, are determined by the self-imaging theory [12], which relies on a parabolic distribution of effective indices of eigenmodes in the MMI section. However, an MMI coupler designed by the self-imaging theory cannot give good performance, such as imbalanced output power and higher excess loss, for an MMI based on a weakly guided waveguide, such as a silica waveguide.
Received 22 January 2017, Accepted 25 March 2017, Scheduled 3 April 2017 * Corresponding author: Takashi Yasui ([email protected]).
This is because the distribution of effective indices of eigenmodes in the weakly guided MMI section is sub parabolic owing to the larger effective width of higher-order eigenmodes.
To realize a higher-performance weakly-guided MMI coupler, structural optimizations of MMI couplers by the wavefront matching (WFM) method [13] and genetic algorithms (GAs) [14, 15] have been considered. Sugiyama and Tsuda have carried out structural optimization of silica-based 2×2 MMI couplers for the T- and O-bands by the WFM method [13]. Wang et al. [14] and West and Honkanen [15] have applied GAs to structural optimizations of weakly guided 4×4 and 1×4 MMI couplers, respectively, that were operated in a single wavelength.
The WFM method synthesizes the optimized refractive index distribution of the waveguides from the desired optical characteristics [16]. However, very fine refractive index patterns appear in the synthesized optimum waveguides. As a result, the high fabrication tolerance of MMI couplers owing to their simple structure becomes diminished.
The GA optimizes the structural parameters of the MMI couplers, such as the length of the MMI and positions of the access waveguides [14, 15]. Thus, the simple structure of an MMI coupler can be kept through the optimization. In the simplest form of a GA (SGA) [17], an MMI coupler is represented as a binary coded chromosome, and the typical size of the population in a generation is from 30 to 200. However, the binary chromosome representation meets difficulties to optimize the parameters represented by the continuous numbers, such as the structural parameters for an MMI coupler. In addition, since wave propagation analysis is required for the structural optimization of MMI couplers, large population sizes increase the computational time. To overcome such drawbacks of the SGA, a real-coded GA [18], in which the chromosome is represented by a vector of floating point numbers, and a micro-GA (µGA) [19–23], in which the population size is typically five, have been proposed.
In this paper, we propose a method for structural optimization of 2×2 MMI couplers based on a real-coded µGA. The two-dimensional beam-propagation method (BPM) based on the finite-element scheme (FE-BPM) [24–26], whose accuracy for optical waveguide analysis has been ensured [25, 27], is employed for the propagation analysis of the MMI couplers. The proposed method is applied to the optimization of silica-based 2×2 MMI couplers to realize an MMI with low imbalance and low excess loss over a range of operation wavelength from 1520 to 1580 nm. An MMI coupler optimized by the proposed method has an imbalance of less than 8.4×10⁻³dB, an excess loss of less than 0.14 dB, and a normalized output power of more than 48% over the range of operation wavelength, which are better than the values of an MMI coupler optimized by the WFM method [13]. In addition, the proposed method has an advantage in computational efficiency, because it required less than 6.7% of number of propagation analysis for the optimization, compared to the conventional GA [14, 15].
2. REAL-CODED MICRO-GENETIC ALGORITHM
2.1. Micro-Genetic Algorithm
A µGA is a genetic algorithm with a small population, which is typically five, and reinitialization. It starts with a randomly generated population. Production of individuals in the next generation by genetic operation is carried out until nominal convergence is reached. Then, a new population is generated by transferring the best individual in the converged population to the new one, followed by randomly generating the remaining individuals [19, 20].
The procedures of the algorithm are the following:
(i) Randomly generate the starting population of size Np = 5.
(ii) Perform BPM [24–26] calculations for each individual in the population. (iii) Evaluate the fitness of each individual in the population.
(iv) The individual with the highest fitness is carried to the next generation as the elite (elitist strategy). (v) If nominal convergence is reached, randomly generate the remainingNp−1 individuals in the next
2.2. Real-Coded Genetic Algorithm
In the real-coded GA, a chromosome is represented as a vector of floating point numbers [18]. The size of the chromosome is the same as the length of the vector. Each gene, which is represented as an element of the vector, denotes a variable to be optimized.
In this paper, we denote the chromosome of the ith individual in thegth generation as x(g,i)= (x(g,i)
1 , x (g,i) 2 , . . . , x
(g,i)
N ), (1)
whereN is the size of the chromosome.
To generate the starting population or the remainingNp−1 individuals after nominal convergence, the value of x(jg,i) is randomly chosen from an interval [xj,min, xj,max], which is the search range of the
jth gene.
To produce theNp−1 individuals in the next generation from individuals in the current generation, a binary tournament selection and the BLX-α strategy [18] are applied to the selection and crossover, respectively.
The selection mechanism produces an intermediate population of size Np. The elite is copied into the intermediate population. The remaining Np −1 individuals in the intermediate population are selected by binary tournament selection. The fitness values of two randomly selected individuals in the current generation are compared, and then the individual with the higher fitness is selected for the intermediate population.
The crossover operation produces an individual in the next generation from two randomly selected individuals in the intermediate population. In the BLX-α crossover strategy, the jth gene in the ith individual in the next generation is produced as
x(g+1,i)
j =
⎧ ⎪ ⎨ ⎪ ⎩
xj,min for xj < xj,min
xj,max for xj > xj,max
x
j otherwise,
(2)
where xj is a randomly chosen number of an interval [xj1−α·Ij, xj2+α·Ij] and α is a real number to determine the interval. Here, xj1 = min(xg,ij 1, xjg,i2),xj2 = max(xjg,i1, xg,ij 2),Ij =xj2−xj1, where i1
and i2 denote the indices of the randomly selected individuals.
3. MODEL OF 2×2 MMI COUPLER
Figure 1 shows a two-dimensional model of the 2×2 MMI coupler, which has a width and length of
WM M I and LM M I, respectively. Two pairs of input and output access waveguides of width wac are symmetrically placed about the center of the MMI section. The distance between a center of the access waveguide and the center of the MMI is denoted as yac. The refractive indices of the core and cladding arencore and nclad, respectively.
In this paper,yac and LM M I are given as follows:
LM M I = 3Lπ
2 + ΔLM M I, (3)
yac =
WM M I
4 + Δyac, (4)
where ΔLM M I and Δyac are, respectively, deviations of the length of the MMI and the position of the center of the access waveguides. Here,Lπ is the beat length in the MMI given by
Lπ =
π β0−β1
, (5)
whereβ0 andβ1respectively denote the propagation constants of the fundamental and first-order modes
z y
yac
yac
WMMI
LMMI
Input Output
1
2
1
2
wac
wac ncore
nclad
Figure 1. Schematic structure of the 2×2 MMI coupler.
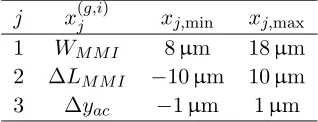
Table 1. Genes and their search ranges for the 2×2 MMI coupler.
j x(g,i)
j xj,min xj,max
1 WM M I 8µm 18µm
2 ΔLM M I −10µm 10µm
3 Δyac −1µm 1µm
In the proposed structural-optimization method for 2×2 MMI couplers, the optimum values of
WM M I, ΔLM M I, and Δyac are searched by the real-coded µGA described above. The genes in a chromosome, which represents a 2×2 MMI coupler, and their search ranges are shown in Table 1.
The fitness of each individual is evaluated as follows:
F = exp
−N1 λ
λ∈Λ
(WibIb(λ) +WxlXl(λ))
, (6)
where Λ is a set of wavelengths for BPM analysis,Nλ denotes the number of elements that belong to Λ,
Ib(λ) andXl(λ) are the imbalance and excess loss at a wavelengthλ∈Λ, respectively, andWibandWxl are the weighting coefficients that determine the relative importance of Ib(λ) and Xl(λ), respectively. Here,Ib(λ) and Xl(λ) are defined as follows:
Ib(λ) = −10 log
min{P1(λ), P2(λ)}
max{P1(λ), P2(λ)}
[dB], (7)
Xl(λ) = −10 log
P1(λ) +P2(λ)
Pin(λ)
[dB], (8)
wherePi(λ) (i= 1,2) denotes the output optical power at the output ifor the incident wave of power
Pin(λ) into the input 1. We note that Pi(λ) (i= 1,2) are evaluated by the overlap integral at the end of the MMI section, and that the electric field in the BPM calculation is normalized so that Pin(λ) is unity.
4. NUMERICAL RESULTS
We consider silica-based 2×2 MMI couplers. The range of operation wavelength is from 1520 to 1580 nm. The relative refractive index difference is Δ = 5.5% [11]. The wavelength-dependent refractive index of the cladding is given by the following Sellmeier equation [28],
nclad(λ) =
1 +3
i=1
aiλ2 (λ2−b
i)
whereλis the wavelength inµm,a1= 0.6965325,a2 = 0.4083099,a3 = 0.8968766,b1 = 4.368309×10⁻³,
b2 = 1.394999×10⁻², and b3 = 9.793399×101. The widths of the input and output waveguides are
taken as wac = 3.0µm. The thickness of the core is assumed to be 3.0µm. Two-dimensional models obtained by the effective index method are analyzed by the BPM. The incident wave is assumed to be the TE-polarized fundamental mode of the input access waveguide 1. The termination condition of the optimization process is given as g = Ni, where Ni denotes the number of iterations. In the following results, Ni is taken as 50, α for the BLX-α is taken as 0.5, and the propagation constants β0 and β1 in
Eq. (5) are evaluated at the wavelength of 1550 nm to determine the length of the MMI couplers. First, to take into account the wavelength dependence of the 2×2 MMI coupler in the optimization process, we consider the three sets of wavelength Λ as Λ1 ={1550 nm}, Λ3={λi|λi= 1520+30inm, i= 0,1,2}, and Λ7 ={λi|λi = 1520 + 10inm, i= 0,1,2, . . . ,6}. For each Λ, the optimization process was carried out 100 times. Fig. 2 shows the wavelength dependence of the normalized output power of the optimized structure with the largest fitness after 100 optimization processes for each Λ. Here, the weighting coefficients are taken as Wib = Wxl = 1. Fig. 2(a) shows the results with Λ = Λ1 and Λ3.
For Λ = Λ1, although, very large normalized output power of 49.6% is achieved at the wavelength of
1550 nm, which is used for the optimization, the wavelength dependence of the output power is also very large. On the other hand, the result with Λ = Λ3 shows the output power of more than 48.5% over the
range of operation wavelength with small wavelength dependence. We can see that optimization with more than one wavelength is effective to design a wideband 2×2 MMI coupler. Fig. 2(b) shows the results with Λ = Λ3and Λ7. They show similar output power and wavelength dependence. The obtained
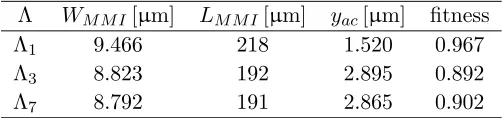
structural parameters and the fitness of the optimized 2×2 MMI couplers are shown in Table 2. Since a larger number of wavelengths for the BPM analysis requires longer computational time, we choose Λ3
as Λ in the following optimization.
0.4 0.5 0.6
Normalized output power
1520 1540 1560 1580
Wavelength [nm]
Port 1 Port 2
(a)
0.48 0.49 0.50
Normalized output power
1520 1540 1560 1580
Wavelength [nm]
Port 1 Port 2
(b)
Figure 2. Normalized output power of the optimized 2×2 MMI couplers, which have the highest fitness after 100 optimization processes with (a) Λ = Λ1 and Λ3, and (b) Λ = Λ3 and Λ7, as functions
of wavelength. Here, the incident power at the wavelength λ,Pin(λ), is normalized to unity.
Table 2. Structural parameters and fitness for the optimized 2×2 MMI couplers with the optimization with Λ = Λ1, Λ3, and Λ7.
Λ WM M I[µm] LM M I[µm] yac[µm] fitness
Λ1 9.466 218 1.520 0.967
Λ3 8.823 192 2.895 0.892
Λ7 8.792 191 2.865 0.902
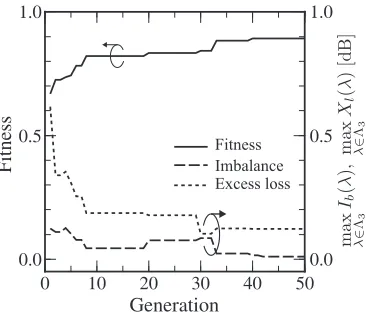
Figure 3 shows the maximum fitness, maximum imbalance, and maximum excess loss as functions of generation for the 2×2 MMI coupler whose normalized output power is shown in Fig. 2 for Λ = Λ3. We
0.0 0.5 1.0
Fitness
0 10 20 30 40 50
Generation
0.0 0.5 1.0
Fitness Imbalance Excess loss
Figure 3. Fitness, maximum imbalance, and maximum excess loss of the optimized 2×2 MMI coupler, which has the highest fitness after 100 optimization processes with Λ = Λ3, as functions of generation
in optimization process.
0 5 10
0.00 0.05 0.10 0.15 0.20
Imbalance [dB]
Frequency
(a)
0 5 10
0.0 0.1 0.2 0.3 0.4 0.5
Excess loss [dB]
Frequency
(b)
Figure 4. Histograms of maximum (a) imbalance and (b) excess loss for the optimized 2×2 MMI couplers for 100 optimization processes with Λ3.
process. For the optimized structure, the imbalance and excess loss are smaller than 1.0×10⁻² dB and 0.12 dB, respectively, over the range of the wavelength of operation. Fig. 4 shows the histograms of the maximum imbalance and excess loss for the 100 optimized structures with Λ = Λ3. The mean and
standard deviation of the imbalance are μib= 0.060 dB andσib= 0.033 dB, respectively, and those for the excess loss areμxl= 0.208 dB andσxl = 0.069 dB, respectively. The three standard deviations above the mean for the imbalance and excess loss are, respectively, 0.16 dB and 0.41 dB, which are comparable to the maximum imbalance and excess loss of a weakly guided 2×2 MMI coupler whose structure was optimized by the WFM method [13]. We can say that the proposed optimization method almost always leads to weakly guided 2×2 MMI couplers, which have imbalance values and excess loss values that are as good as or better than those for the WFM method.
The optimum design of MMI couplers requires a large number of optical wave propagation analyses. In the conventional optimization methods based on the conventional GA, propagation analyses were carried out 12000 [Np = 80, Ni = 150, Np ×Ni = 12000] times and 3750 [Np = 15, Ni = 250,
Np×Ni = 3750] times per wavelength for the optimizations of 4×4 [14] and 1×4 [15] MMI couplers, respectively. In comparison to the conventional method, propagation analyses were carried out 250 [Np= 5, Ni = 50,Np×Ni = 250] times, which is less than 6.7% of those by the conventional methods, per wavelength in the proposed method. The effectiveness of the proposed method is demonstrated through the above examples.
0.0 0.5 1.0 1.5 2.0 2.5
0.0 0.5 1.0
Wib
Imbalance Excess loss
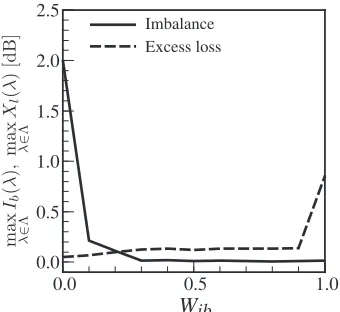
Figure 5. Maximum imbalance and excess loss of the optimized 2×2 MMI couplers as functions of the weighting value Wib. Here, the weighting valueWxl is given as 1−Wib.
0.3 0.4 0.5 0.6 0.7
Normalized output power
1520 1540 1560 1580
Wavelength [nm]
output 1 output 2
Figure 6. Normalized output power of the optimized 2×2 MMI couplers as a function of wavelength for Wib = 0, 0.9, and 1.0. We note that the output power at output 1 and 2 are identical for Wib = 0.9 and 1.0 owing to small imbalance. Here, the incident power at the wavelength ofλ,Pin(λ), is normalized be unity.
between 0.3 and 0.9. On the other hand, the maximum imbalance and excess loss are very large for
Wib = 0 [Wxl = 1] and Wib = 1 [Wxl = 0], respectively. The structural parameters and fitness of the optimized 2×2 MMI couplers are shown in Table 3. Similar structural parameters were achieved for
Wib between 0.3 and 0.9. We can say that both the imbalance and excess loss should be considered in the fitness to realize a 2×2 MMI coupler with smaller imbalance and excess loss.
Table 3. Structural parameters and fitness for the optimized 2×2 MMI couplers for the values ofWib between 0 and 1. Here, Wxl = 1−Wib and Λ = Λ3.
Wib WM M I[µm] LM M I[µm] yac[µm] fitness
0.0 8.217 173 1.649 0.977
0.1 8.149 167 2.554 0.932
0.2 9.878 234 3.392 0.925
0.3 8.834 192 2.896 0.926
0.4 8.830 192 2.901 0.934
0.5 8.854 192 2.865 0.945
0.6 8.735 190 2.854 0.953
0.7 8.866 192 2.848 0.965
0.8 8.798 191 2.855 0.975
0.9 8.836 191 2.831 0.985
1.0 14.970 503 4.413 0.993
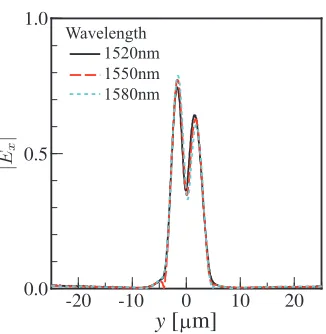
Figure 6 shows the normalized output power of the optimized 2×2 MMI couplers as a function of wavelength for Wib = 0, 0.9, and 1.0. We note that Wib= 0.9 gave the largest fitness of the optimized 2×2 MMI coupler for 0.3≤Wib≤0.9, as shown in Table 3, where the maximum imbalance and excess loss are less than 8.4×10⁻³dB and 0.14 dB, respectively. ForW
0.0 0.5 1.0
0 10 20 y [ m]
1520nm 1550nm 1580nm Wavelength
µ
-10 -20
Figure 7. Field distributions at the end of the optimized 2 ×2 MMI coupler with Wib = 0.9. Here, the field is normalized by the amplitude of the incident field.
0.0 0.5 1.0
0 10 20 y [ m]
1520nm 1550nm 1580nm Wavelength
µ
-10 -20
Figure 8. Field distributions at the end of the optimized 2×2 MMI coupler withWib= 0. Here, the field is normalized by the amplitude of the incident field.
0.0 0.5 1.0
0 10 20 y [ m]
1520nm 1550nm 1580nm Wavelength
-10 -20
µ
Figure 9. Field distributions at the end of the optimized 2×2 MMI coupler with Wib = 1.0. Here, the field is normalized by the amplitude of the incident field.
Wib= 0, and they are balanced but the values decrease for longer and shorter wavelengths forWib= 1.0. Distributions of thex-components of the electric field at the end of the optimized 2×2 MMI couplers are shown in Figs. 7, 8, and 9 forWib= 0.9, 0, and 1.0 respectively. As shown in Fig. 7, the input wave is almost equally split without wavelength dependence of the field distribution. On the other hand, Fig. 8 shows non-uniform splitting of the input wave. In Fig. 9, although the input waves are equally split, the peak intensities strongly depend on wavelength.
Table 4. Maximum excess loss and imbalance over the operation wavelength range for 2×2 MMI couplers whose values of WM M I and yac are around the optimized values with the accuracy of typical fabrication tolerance. Here, LM M I is taken as 191µm.
WM M I[µm] yac[µm] max. excess loss [dB] max. imbalance [dB]
8.8 2.8 0.18 1.1×10⁻¹
8.8 2.9 0.14 2.9×10⁻²
8.9 2.8 0.33 2.6×10⁻¹
8.9 2.9 0.20 6.7×10⁻¹
WM M I. The authors think that the difference in propagation distance in the MMI section affects the quality of self-imaging characteristics.
5. CONCLUSION
In this paper, we propose a structural optimization method based on a real-coded µGA for weakly guided 2×2 MMI couplers to realize an MMI coupler with low imbalance and excess loss over the wavelength ranging from 1520 to 1580 nm. The proposed method was applied to silica-based 2×2 MMI couplers with Δ = 5.5%. The optimized 2×2 MMI coupler, which has the MMI section width and length of 8.836µm and 191µm, respectively, and for witch the distance between the centers of the MMI and an access waveguide was 2.831µm, showed an imbalance of less than 8.4×10⁻³dB, an excess loss of less than 0.14 dB, and a normalized output power of more than 48% over the wavelength range. The proposed method achieved an optimized 2×2 MMI coupler after 250 times of propagation analyses per wavelength, which is less than 6.7% of those by the conventional methods for 4×4 and 1×4 MMI couplers, and was proven to be more effective than the conventional methods. The 2×2 MMI couplers, which have structural parameter values close to the optimized values, within an accuracy of typical fabrication tolerance, were also analyzed by the BPM. The result was comparable with that for the optimized 2×2 MMI coupler.
REFERENCES
1. Chen, S., X. Fu, J. Wang, Y. Shi, S. He, and D. Dai, “Compact dense wavelength-division (de)multiplexer utilizing a bidirectional arrayed-waveguide grating integrated with a Mach-Zehnder interferometer,” J. Lightwave Technol., Vol. 33, No. 11, 2279–2285, June 2015.
2. Bitincka, E., G. Gilardi, and M. K. Smit, “On-wafer optical loss measurements using ring resonators with integrated sources and detectors,”IEEE Photon. J., Vol. 6, No. 5, 6601212, Oct. 2014. 3. Ma, Y., S. Park, L. Wang, and S. T. Ho, “Ultracompact multimode interference 3-dB coupler with
strong lateral confinement by deep dry etching,” IEEE. Photon. Technol. Lett., Vol. 12, No. 5, 492–494, May 2000.
4. Sakamaki, Y., Y. Nasu, T. Hashimoto, K. Hattori, T. Saida, and H. Takahashi, “Reduction of phase-difference deviation in 90◦ optical hybrid over wide wavelength range,” Ieice Electronics Express, Vol. 7, No. 3, 216–221, Feb. 2010.
5. Hashizume, Y., T. Goh, Y. Inoue, K. Hamamoto, and M. Itoh, “Polarization beam splitter with different core widths and its application to dual-polarization optical hybrid,”J. Lightwave Technol., Vol. 33, No. 2, 408–414, Jan. 2015.
6. Fandi˜no, J. S. and P. Mu˜noz, “Manufacturing tolerance analysis of an MMI-based 90◦ optical hybrid for InP integrated coherent receivers,”IEEE Photon. J., Vol. 5, No. 2, Apr. 2013.
8. Han, L., S. Liang, H. Zhu, C. Zhang, and W. Wang, “A high extinction ratio polarization beam splitter with MMI couplers on InP substrate,”IEEE Photon. Technol. Lett., Vol. 27, No. 7, 782–785, Apr. 2015.
9. Kleijn, E., E. M. van Vliet, D. Pustakhod,, M. K. Smit, and X. J. M. Leijtens, “Amplitude and phase error correction algorithm for 3×3 MMI based Mach-Zehnder interferometers,”J. Lightwave Technol., Vol. 33, No. 11, 2233–2239, Jun. 2015.
10. Hai, M. S., M. N. Sakib, and O. Liboiron-Ladouceur, “Monolithic 1×2 MMI-based 25-Gb/s SOI DPSK demodulator integrated with SiGe photodetector,” IEEE Photon. Technol. Lett., Vol. 27, No. 6, 565–568, Mar. 2015.
11. Takahashi, M., Y. Uchida, S. Yamasaki, J. Hasegawa, and T. Yagi, “Compact and low-Loss coherent mixer based on high Δ ZrO2-SiO2 PLC,” J. Lightwave Technol., Vol. 32, No. 17, 3081–3088,
Sept. 2014.
12. Soldano, L. B. and E. C. M. Pennings, “Optical multi-mode interference devices based on self-imaging: Principles and applications,”J. Lightwave Technol., Vol. 13, No. 4, 615–627, Apr. 1995. 13. Sugiyama, K. and H. Tsuda, “Broadband 2×2 multimode interference coupler for T- and O-band
communication by wavefront matching method,”Advanced Photon., JM3A.32, 2015.
14. Wang, Q., J. Lu, and S. He, “Optimal design of a multimode interference coupler using a genetic algorithm,”Opt. Commu., Vol. 209, 131–136, Aug. 2002.
15. West, B. R. and S. Honkanen, “MMI devices with weak guiding designed in three dimensions using a genetic algorithm,”Opt. Express, Vol. 12, No. 12, 2716–2722, Jun. 2004.
16. Sakamaki, Y., T. Saida, T. Shibata, Y. Hida, T. Hashimoto, M. Tamura, and H. Takahashi, “Y-branch waveguides with stabilized splitting ratio designed by wavefront matching method,” IEEE Photon. Technol. Lett., Vol. 18, No. 7, 817–819, Apr. 2006.
17. Goldberg, D. E., Genetic Algorithms in Search, Optimization and Machine Learning, Addison-Wesley, Boston, USA, 1989.
18. Herrera, F., M. Lozano, and J. L. Verdegay, “Tackling real-coded genetic algorithms: Operators and tools for behavioural analysis,”Artificial Intelligence Review, Vol. 12, No. 4, 265–319, Aug. 1998. 19. Krishnakumar, K., “Micro-genetic algorithms for stationary and nonstationary function
optimization,” SPIE: Intelligent Control and Adaptive Systems, Vol. 1196, 289–296, Feb. 1989. 20. Coello, C. A. C. and G. T. Pulido, “A micro-genetic algorithm for multiobjective optimization,
evolutionary multi-criterion opitimization,”Lect. Notes Comput. Sci., Vol. 1993, 126–140, 2001. 21. Chakravarty, S., R. Mittra, and N. B. Williams, “Application of a micro-genetic algorithms (MGA)
to the design of broad-band microwave absorbers using multiple frequency selective surface screen buried in dielectrics,” IEEE Trans. Antennas Propag., Vol. 50, No. 3, 284–296, Mar. 2002.
22. Fallahi, A., M. Mishrikey, C. Hafner, and R. Vahldieck, “Efficient procedures for the optimization of frequency selective surfaces,”IEEE Trans. Antennas Propag., Vol. 56, No. 5, 1340–1349, May 2008. 23. Mori, T., R. Murakami, Y. Sato, F. Campelo, and H. Igarashi, “Shape optimization of wideband antennas for microwave energy harvesters using FDTD,” IEEE Trans. Magn., Vol. 51, No. 3, 8000804, Mar. 2015.
24. Tsuji, Y. and M. Koshiba, “A finite element beam propagation method for strongly guiding and longitudinally varying optical waveguides,” J. Lightwave Technol., Vol. 14, No. 2, 217–222, Feb. 1996.
25. Koshiba, M. and Y. Tsuji, “A wide-angle finite-element beam propagation method,”IEEE Photon. Technol. Lett., Vol. 8, No. 9, 1208–1210, Sept. 1996.
26. Yasui, T., M. Koshiba, and Y. Tsuji, “A wide-angle finite element beam propagation method with perfectly matched layers for nonlinear optical waveguides,” J. Lightwave Technol., Vol. 17, No. 10, 1909–1915, Oct. 1999.
27. Nolting, H.-P. and R. M¨arz, “Results of benchmark tests for different numerical BPM algorithms,” J. Lightwave Technol., Vol. 13, No. 2, 216–224, Feb. 1995.