Available online: https://edupediapublications.org/journals/index.php/IJR/ P a g e |
1918
IoT Based Smart Irrigation System
D
R.
U.
YEDUKONDALU,
P
ROFESSOR&
HOD,
DEPA RTM ENT OF ECEE. CHAIT ANYA ,K. RATHNA BABU ,R. AMANI ,S. PAVAN SAT YANARAYANA
B.Tech Students , Department of Electronics & Communication Engineering, Ramachandra College of Engineering , Eluru, Andhra Pradesh, India.
Abstract—Agriculture remains the sector which contributes the highest to India’s GDP. But, when considering technology that is deployed in this field, we find that the development is not tremendous. After consulting with the Kerala Agricul-tural University, Mannuthy and Kerala Rice Research Station, Vytilla, we identified a few fundamental issues that are faced by the paddy farmers today. It includes the problem of over or under watering and the need for regular manual irrigation. Furthermore, when it comes to rice, which is the staple crop of Kerala, there does not exist a system for automatically monitoring the diseases associated with the rice species, and checking whether the crop is supplied with ample amount of nutrients.In this paper, we have devised a means for cost-effective automated irrigation and fertigation along with MATLAB based image processing for identifying the rice diseases and nutrient deficiencies. Here, we are focusing on two important nutrients, namely magnesium and nitrogen. The hardware consists of a Raspberry Pi, DHT11 temperature and humidity sensor and solenoid valves. Furthermore, the pro-posed model enables the farmer to monitor weather conditions using an Android Application, with which he also has a choice to override the system if required.
Keywords-Water Management; Agriculture; Irrigation; Im-age Processing; Nutrient Detection; Automation;
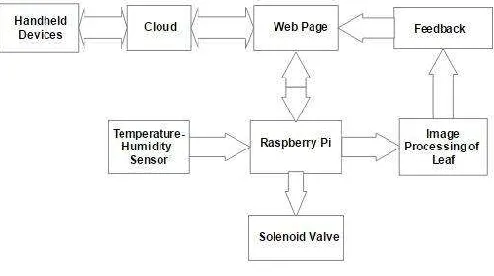
Figure 1. Block Diagram
A. Raspberry Pi [2]
Available online: https://edupediapublications.org/journals/index.php/IJR/ P a g e |
1919
I. INTRODUCTION
India is blessed with a large chunk of cultivable land, but the output produced does not do justice to the country’s potential. The World Bank data reveals that around 60% of the land is under cultivation [1]. The use of technology in agriculture is on the rise, but a large portion of agriculture, especially irrigation remains a manual exercise. It is known that the output of a plant depends on various factors. The availability of optimum quantity of water is highly imper-ative in this regard. Interaction with farmers from Kerala Rice Station, and agricultural enthusiasts revealed that the existing automated irrigation facilities are expensive and inaccurate to some extent. This was the driving factor behind choosing automated irrigation as a topic for our project. The automation of the irrigation system, and providing a platform to monitor the irrigation conditions, using soil moisture, temperature and humidity readings will have an everlasting impact on the output of the plant.
II. COMPONENTS
The hardware components used for the completion of the project has been mentioned below.
B. Sensors [3]
DHT11 Temperature-Humidity Sensor: The DHT11 is a digital sensor with digital calibrated outputs for temperature and humidity readings. The digital readings of temperature and moisture are sent to the Pi board which in turn pushes this data on to the cloud server. The digital interfacing makes the processing easy.
C. Solenoid Valve [4]
A solenoid valve is an electromechanical valve which is current controlled using a solenoid. It has a rating of 12V dc and has two openings.
D. USB Wi-Fi Dongle
The USB Wi-Fi dongle is used to connect the Pi board to internet. The USB Wi-Fi dongle is used to plug into one of the USB port of the Pi board which
can be configured to use any of the wireless networks in the surroundings.
III. PROPOSED MODEL
The output of a plant depends on numerous factors, the optimum water availability being one among them. Fig. 1 gives the overall block diagram of the proposed
model. We moved on to built a weather-based irrigation [5] system, which has a Raspberry Pi at its heart. The key factors leading to water loss are the atmospheric temperature, humidity, wind pattern, and the radiation pattern of the soil [6]. Among these, we chose to built the prototype considering the temperature and humidity, as it was relatively easier and practical. DH11 sensor was used for this purpose, and the digital readings from the sensor were sent to the raspi.
A solenoid valve controls the watering.The opening or closing of the valve depends on the raspi input, as the valve is connected to one of the GPIO pins. The key feature of this project is the use of a server [5], which does the processing part. We purchased a server, and the data from the sensors were pushed to the server using raspi. The opening and closing of the valve is determined by the program on the server based on the temperature and moisture cut-off that was fixed by us. This relieves the raspi of the processing burden, and ensures that the data is not lost. Hence raspi can be used for other tasks like image processing on the plant leaves [7].
When the humidity and temperature readings cross the cut-off, a signal is sent back to the raspi, which then opens the solenoid valve for a time of say, 10 seconds. The amount of water required per plant can been calculated, and the flow rate from the solenoid enables us to determine the amount of time for the valve to be open.
Available online: https://edupediapublications.org/journals/index.php/IJR/ P a g e |
1920
he wishes to. The mobile technology enables the user to access the readings from anywhere, with an internet connection, thereby making the system ubiquitous.
The control algorithm for the valve operation is based on the data that has been collected over a period of 2 months, i.e., the temperature and humidity values. The threshold has been set according to the water loss, as obtained by the Penman-Monteith Evapotranspiration formula, considering the temperature and humidity alone [6].
The image processing part consists of the images of the leaves being sent to the raspi by the user or by a raspi camera. The plant that we have chosen is paddy, and the common diseases affecting the species in Kerala is ’Bacterial Blight’ and ’Brown leaf Spot’ [7]. Image processing is done with the help of MATLAB [11]. Initially, a database is created, wherein the properties like contrast, correlation, energy, homogeneity, mean, standard deviation and entropy are calculated and each disease is denoted by a corresponding label. Table.1 shows a set of sample database readings.
The input image is segmented into three clusters [9], [11], and the cluster containing the Region Of Interest (ROI) is chosen, as shown in Fig. 2 and 3. The above mentioned properties of this chosen image are calculated.The disease is detected on the basis of the value of the parameters
Table I DATABASE
Parameters Healthy Bacterial Brown Leaf Sample Blight Spot Leaf
Contrast 0.2425 0.3416 0.7115 0.439
Correlation 0.9553 0.8604 0.9236 0.932 Energy 0.624 0.796 0.528 0.314 Homogeneity 0.9731 0.9770 0.9020 0.932 Mean 22.35 12.50 44.59 44.63 S.D 53.1 40.1 80.7 60.2 Entropy 2.29 4.5 3.086 4.38
which match with those in the database, and a feedback will be given to the user to take the necessary measures to cleanse the plant, as shown in Fig. 4.
Furthermore, LAB colour space technique in MATLAB, we can obtained leaf’s green colour intensity and compare that with the International Rice Colour Chart [7], [10] which gives the colour variation of a leaf based on its Nitrogen
[12] content, as shown in Fig. 5. In Kerala, the leaf colour of rice would be in between 3 and 4 of the Leaf Colour Chart (LCC). It would go below LCC3 if the nitrogen is deficient.
Available online: https://edupediapublications.org/journals/index.php/IJR/ P a g e |
1921
IV. RESULTS
The stage by stage testing of the prototype has been done and the readings for temperature and humidity has been obtained. Dynamic temperature and humidity are plotted Fig. 6 and 7 and threshold was determined and set up in the server. The value of the properties obtained after processing the image of a sample blight-affected leaf, as shown in Fig. 8, is tabulated in Table. 1. Using this, it can be specified if the leaf is affected or whether it is a healthy leaf.
The image of a disease-free leaf is taken for nutrient (nitrogen) requirement detection using a 13MP camera in such a way that no direct sunlight falls on the leaf while the image is being taken. It is recommended to use a similar camera, with a pixel density greater than or equal to 13MP for optimum results. This acquired image is compared with the Standard Rice Colour Chart to determine the if the Nitrogen content is optimum, excess or deficient. This would be notified to the user, who can take the necessary actions to optimise the nitrogen supply with the water through the solenoid valve.
The user interface of the web application was developed. Each user will be given a unique ID using which the user can monitor the readings on the site. The farm dashboard
is recommendations of Kerala Agricultural University
and the deficiency in Nitrogen was identified.
V. CONCLUSION
The development phase of the prototype IOT based intel-ligent Irrigation system with Nutrient and disease analysis is explained in this paper.With the current setup, irrigation becomes smarter and more optimised reducing the amounts of overheads and allows efficient use of water helping in water conservation. Furthermore, with the nutrient deficiency detection and disease analysis, which will be automated, will enable the farmers to increase their output, without muchNeffort. The project can be made more efficient
by calculating the fertilizer amount from the nitrogen deficiency that is calculated.
ACKNOWLEDGMENT
The authors would like to acknowledge KSCSTE for funding this work as a part of the Student Project Scheme during 2016. Also, the authors thank the Kerala Agricultural University, Mannuthy, for their valuable inputs.
REFERENCES
[1] Mittal, Rakesh Bharti,Rejuvenating India’s Agricultural Sector: The Economic Times, January 2, 2010
[2] https://cdn-learn.adafruit.com/downloads/pdf/introducing-the-raspberry-pi-2-model-b.pdf
[3] http://www.micropik.com/PDF/dht11.pdf
[4] https://www.sparkfun.com/datasheets/Robotics/Aqua
[5] Genghuang Yang, Yuliang Liu, Li Zhao, Shigang Cui, Qingguo Meng and Hongda Chen, ”Automatic Irrigation System Based on Wireless Network”, 2010 8th IEEE International Conference on Control and Automation, Xiamen, China, June 9-11, 2010.
[6] Koushik Anand, C. Jayakumar, Mohana Muthu and Sridhar Amirneni, ”Automatic Drip Irrigation System Using Fuzzy Logic And Mobile Technology”, 2015 IEEE International Con-ference on Technological Innovations in ICT for Agriculture and Rural Development.
[7] Amandeep Singh and Maninder Lal Singh, ”Automated Color Prediction of Paddy Crop Leaf Using Image Processing”, 2015 IEEE International Conference on Technological Innovations in ICT for Agricultural and Rural Development(TIAR).
[8] http://139.59.58.89/admin/login/?next=/admin/
[9] Mrunalini R Badakhe and Prashant R Deshmukh, Infected Leaf Analysis and Comparison by Otsu Threshold and k- means Clustering, International Journal of Advanced Research in Computer Science and Software Engineering, Vol. 2, Issue 3, March 2012.
Available online: https://edupediapublications.org/journals/index.php/IJR/ P a g e |
1922
[11] Sanjay B. Patil and Shrikant K. Bodhe, ”Leaf disease severity measurement using image processing”, International Journal of Engineering and Technology, Vol.3(5), 2011, 297-301.