IJEDR1501068
International Journal of Engineering Development and Research (www.ijedr.org)368
Effect of a Biodiesel-additive on Low-temperature
Operability and Performance of a Diesel Engine
1
Murari Mohon Roy,
2Wilson Wang,
3Gabriel G Gonsales,
4Andre DS Cantanhede
1Assistant Professor, 2Professor, 3Student, 4Student1Mechanical Engineering, Lakehead University, Thunder Bay, Canada
________________________________________________________________________________________________________
Abstract - Biodiesel, consisting of the alkyl esters of fatty acids from vegetable oils or animal fats, is a promising alternative to petroleum diesel fuel. Biodiesel, when produced from vegetable oils is considered a carbon-neutral fuel based on the fact that the atmospheric carbon dioxide (CO2)is consumed during plant growth. Research has shown that
biodiesel-fueled engines produce less carbon monoxide (CO), unburned hydrocarbon (HC), and particulate matter (PM) emissions compared to using petroleum diesel fuel. However, there is a major problem associated with biodiesel; it has worse cold flow property compared to petroleum diesel, which prohibits its use in cold atmospheric conditions. The study in this work will investigate the effect of a biodiesel additive (Wintron XC 30) on the cold flow property and examines the performance and emissions of a direct injection (DI) diesel engine. Wintron XC 30 is added from 0.25 to 2.0 vol.% in different diesel-biodiesel blends. Low percentage of biodiesel (5%) in the blend with additives shows a little better cold flow property than diesel. Brake specific fuel consumption (bsfc) and brake thermal efficiency (ηth) are measured as the
engine performance parameters, and CO, HC, NO, NO2, NOx, CO2 and O2 are measured in emissions. B5 and B10 with
lower amount of additives show comparable engine performance and emissions that of diesel.
Index Terms - Biodiesel-additive, Wintron XC 30, Low-temperature property, Diesel engine, Engine performance, Engine emissions.
________________________________________________________________________________________________________
I.INTRODUCTION
Biodiesel is a renewable fuel. It is primarily plant-based and "carbon-neutral" – that means it's part of the natural carbon cycle, and adds no extra carbon dioxide greenhouse gas (GHG) to the atmosphere. Furthermore, biodiesel is a clean, safe, non-toxic, ready-to-use, alternative fuel. It's a much better lubricant than ordinary petroleum diesel, which can extend engine life. Biodiesel has a higher cetane number than petrodiesel – the engine starts more easily, runs better and burns cleaner. United States Environmental Protection Agency (US EPA) has done a comprehensive analysis of biodiesel impacts on exhaust emissions [1] mentioning that pure biodiesel can reduce HC as high as 70% and PM and CO about 50% when compared with petroleum diesel fuel. Several countries including Canada have already begun substituting the conventional diesel by a certain amount of biodiesel. The use of biodiesel is being promoted by European Union countries to partly replace petroleum diesel in order to reduce GHG emissions and dependency on foreign oil. Meeting the targets established by the European Parliament for 2020 would lead to a biofuel market share of 10% [2]. Canadian government has launched a new biofuel strategy to use up to 5% biodiesel in diesel for ground transportation and heating by 2015.
IJEDR1501068
International Journal of Engineering Development and Research (www.ijedr.org)369
and 5 vol.% methanol in 20% biodiesel blend. Higher NOx emissions (up to 13%) and lower CO and CO2 emissions (up to 17– 18%) were observed compared to petroleum diesel. Zhu et al. [17] studied the emissions and performance of a 4-cylinder naturally-aspirated DI diesel engine with diesel fuel, pure biodiesel, and biodiesel with additives (ethanol and methanol separately in 5%, 10% and 15% blends). Waste cooking oil was used to produce biodiesel. They observed that compared to diesel fuel, the blended fuels could reduce both NOx and PM of a diesel engine, whereas the biodiesel–methanol blends were more effective than the biodiesel–ethanol blends. Joshi et al. [18] improved the low-temperature operability, kinematic viscosity, and acid value of poultry fat methyl esters with addition of ethanol, isopropanol, and butanol. An experimental investigation was carried out to evaluate the effect of diethyl ether as additive to biodiesel on the combustion, performance and emission characteristics in an unmodified diesel engine at different loads and constant engine speed [19]. With the addition of diethyl ether into biodiesel, the brake thermal efficiency and bsfc were improved with the use of 5% biodiesel blend. The CO and smoke emissions are lower for 5% biodiesel blend compared to those of other fuel blends and biodiesel. The NOx emission is higher for 5% biodiesel blend compared to that of neat biodiesel. The HC emissions are higher for all the biodiesel–diethyl ether blends compared to those of biodiesel at all loads. Aydin et al. [20] examined 20% kerosene and 80% cottonseed biodiesel blend in a single cylinder DI diesel engine and compared the emission results with that of diesel and cottonseed biodiesel blend. The experimental results showed that the exhaust emissions for 20% kerosene and 80% biodiesel were fairly reduced as compared to diesel fuel. Boshui et al. [21] evaluated the impact of three cold flow improvers namely, olefin-ester copolymers (OECP). Ethylene vinyl acetate copolymer (EACP) and poly methyl acrylate (PMA), on the low temperature properties, and viscosity-temperature characteristics of a soybean biodiesel was evaluated on a low temperature flow tester and rotary rheometer. The result indicated that the ability of cold flow improvers varied in improving the cold flow properties of soybean biodiesel but among most of them, OECP was found to be the best candidate. Four comb-like copolymers derived from styrene-maleic anhydride copolymer were prepared and characterized by FTIR, 1H-NMR and elemental analysis. The prepared polymers were investigated as pour point depressants and flow improvers for waxy crude oil and it was found that, the maximum depression was obtained by the sample that has long branch chain (C18H37O) from 27˚C to -3˚C (DPP=30˚C, at 10,000 ppm). While, the minimum depression was exhibited by short branch chain, (C8H17O), DPP=21˚C at the same conditions [22].The authors’ research team investigated the performance and emissions of a DI diesel engine in [23] with three fuel series: biodiesel-diesel, biodiesel-diesel-additive and kerosene-biodiesel. Biodiesel additive Wintron XC 30 was first introduced in this work with 2 vol.% of additive in the blend. Their investigation results showed that the 5% biodiesel blend with additive Wintron XC 30 outperformed diesel in cold flow property. The objective of this work is to systematically study the Wintron XC 30 from 0.25-2.0 vol.% with low percentage biodiesel blends and to investigate the cold flow property and engine performance and emissions.
II.MATERIALSANDMETHODS
The most commonly used method of biodiesel production is transesterification of oil with methanol in the presence of a catalyst, which gives biodiesel and glycerin. The biodiesel feedstock used in this study is pure canola oil that is purchased from a local supermarket. Methanol and sodium hydroxide, two main ingredients of biodiesel production, are purchased from Canadawide Scientific. A batch reactor of one liter is used to produce canola biodiesel following the procedures described in reference [24]. The reaction temperature is maintained at 55-60˚C. The crude biodiesel is washed twice by water and dried. The final collection efficiency (after washing) is about 90%. The quality of biodiesel is tested by ASTM 6751 standard [25]. Wintron XC 30 is a chemical additive used in this work. It is a low cost biodiesel pour point depressant (PPD) effective for biodiesel produced from a wide range of feedstock. Treat rate varies, which is largely dependent on the feedstock used to produce the biodiesel, with a. typical treat rate of 0.1% - 2% by volume. The additive modifies the viscosity compounds, and reduces the tendency of viscosity to increase as the fuel is cooled. This alters the low temperature crystallization process - lowering the temperature at which biodiesel is able to flow and lowering the temperature at which wax crystals become large enough to block the pores of the fuel filter [26].
Investigation will also be performed in this study to determine physical properties (e.g., density and viscosity), burning property (e.g., heating value) and cold flow properties (e.g., cloud point). A fuel’s cold flow characteristics are measured by the CP, the cold filter plugging point (CFPP), and the PP. The CP is the temperature at which a cloud or haze of small solid crystals appears in the fuel as the fuel cools. The CFPP is the lowest temperature at which fuel will still flow through a specific filter under standardized conditions. The PP refers to the temperature at which fuel ceases to flow under specific conditions. Usually, the PP is the lowest, the CP is the highest and the CFPP is in between the CP and the PP of a fuel. Therefore, CP of a fuel can be considered as the safest temperature at/above which the fuel can flow.
Density is measured by using an electronic balance (0.1 g resolution) and a graduated volume measuring cylinder (0.1 cc of resolution) by using the following formula:
ρ = M / V
where ρ is the density, M denotes the mass and V is the volume of fuel samples. Viscosity is measured by using an Ostwald viscometer and a water bath at a constant temperature of 40˚C. Heating value of fuels is determined by using a bomb calorimeter (Parr 6200 calorimeter). The CP is determined by using an automated MPP 5G CP tester. Table 1 summarizes the cold flow, physical and burning properties of different fuels. It is noticed that B5A(1.0) and B5A(2.0) have lower CP than ultra-low sulfur diesel (ULSD).
IJEDR1501068
International Journal of Engineering Development and Research (www.ijedr.org)370
Table 1: Cloud point, density, viscosity and heating value of different fuelsSample Cloud point (˚C) Density (kg/m3) Viscosity (cSt) Heating value (MJ/kg
B0 (ULSD) -41 850.0 1.71 45.520
B100 -4 874.0 4.20 40.360
B5 -37 851.2 1.77 45.261
B5A(0.25) -40 851.7 1.80 45.255
B5A(0.50) -41 852.2 1.87 45.248
B5A(1.0) -43 853.2 2.04 45.235
B5A(2.0) -43 855.2 2.42 45.208
B10 -34 852.4 1.95 45.003
B10A(0.25) -35 852.9 1.98 44.997
B10A(0.50) -36 853.4 2.02 44.991
B10A(1.0) -37 854.4 2.26 44.979
B10A(2.0) -38 856.4 2.53 44.955
III.ENGINETEST
A DI diesel engine is tested to examine its performance and emissions with two fuel series: B5 and B10 with different amount of additives and compared with ULSD. B5 series is composed of B5 (5% biodiesel and 95% ULSD), B5A(0.25) (i.e., B5 with 0.25% Wintron XC 30), B5A(0.50), (B5 with 0.50% Wintron XC 30), B5A(1.0) (i.e., B5 with 1.0% Wintron XC 30) and B5A(2.0) (i.e., B5 with 2.0% Wintron XC 30). Similarly, B10 series is composed of B10 (10% biodiesel and 90% ULSD), B10A(0.25) (i.e., B10 with 0.25% Wintron XC 30), B10A(0.50) (i.e., B10 with 0.50% Wintron XC 30), B10A(1.0) (i.e., B10 with 1.0% Wintron XC 30) and B10A(2.0) (i.e., B10 with 2.0% Wintron XC 30).
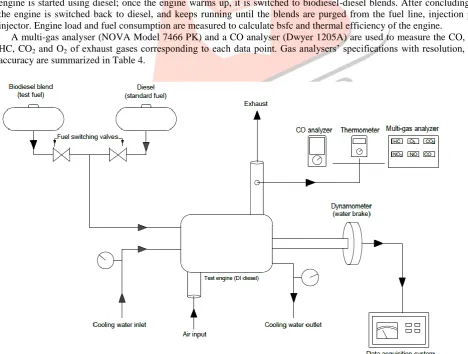
Figure 1 shows the schematic diagram of engine experiment. The engine used in this study is a Peter diesel engine (model PH2W), which is a 4-stroke 2-cylinder naturally aspirated DI diesel engine and its specifications are summarized in Table 2. All experimental data are taken after engine warm-up (about 20 minutes after start-up). In this condition, there is almost no fluctuation of emissions. Tests are carried out at the warmed up condition of the engine under three engine loads at the rated speed of 1800 rpm. Table 3 lists engine-operating conditions for different fuels. Loads are measured by a water brake dynamometer. The fuel supply system is modified to switch between the diesel fuel used as a standard and the test fuels. The engine is started using diesel; once the engine warms up, it is switched to biodiesel-diesel blends. After concluding the tests, the engine is switched back to diesel, and keeps running until the blends are purged from the fuel line, injection pump and injector. Engine load and fuel consumption are measured to calculate bsfc and thermal efficiency of the engine.
A multi-gas analyser (NOVA Model 7466 PK) and a CO analyser (Dwyer 1205A) are used to measure the CO, NO, NO2, HC, CO2 and O2 of exhaust gases corresponding to each data point. Gas analysers’ specifications with resolution, range and accuracy are summarized in Table 4.
IJEDR1501068
International Journal of Engineering Development and Research (www.ijedr.org)371
Table 2: Engine specificationsEngine make and model Lister Peter; PH2W
Engine type Four stroke DI diesel engine
Number of cylinder Two
Bore × Stroke 87.3 × 110 mm
Swept volume 1318 cc
Compression ratio 16.5 : 1
Rated power 11.2 kW @ 1800 rpm
Fuel injection timing 24ºBTDC (below 1650 rpm); 28ºBTDC (above 1650 rpm) Injector nozzle opening pressure 15.5 MPa (below 1100 rpm); 22 MPa (above 1100 rpm)
Table 3: Engine operating conditions Engine speed
(rpm)
Rated power (kW) Load Power (kW) bmep (kPa) Load (%)
1800 11.2
Low 0.54 ≈ 27 ≈ 5
Medium 5.54 ≈ 280 ≈ 50
High 9.05 ≈ 458 ≈ 80
Table 4: Exhaust gas analyzers’ specifications
Method Species Unit Range Resolution Accuracy
NDIR CO2 % 0-20% 0.1% ±1%
NDIR HC ppm 0-20000 ppm 10 ppm ±1%
Electrochemical CO ppm 0-2000 ppm 1 ppm ±10 ppm<100 ppm
±5% of reading>100 ppm
Electrochemical O2 % 0-25% 0.1% ±1%
Electrochemical NO ppm 0-5000 ppm 1 ppm ±1%
Electrochemical NO2 ppm 0-800 ppm 1 ppm ±1%
IV.RESULTSANDDISCUSSIONS
Engine Performance at Low Load Condition
The most important parameters for judging engine performance are engine power, torque, fuel consumption and thermal efficiency. This study will use bsfc and ηth as engine performance parameters.
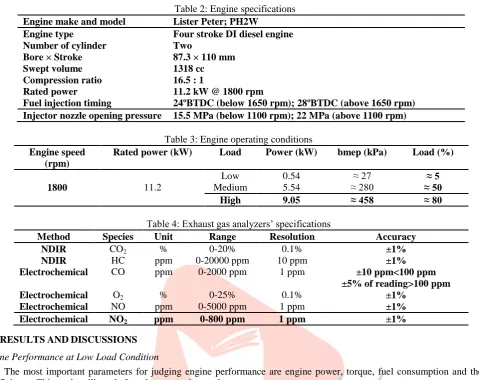
Figure 2 shows the bsfc and the thermal efficiency of the engine at low load condition for different fuels. ULSD has the lowest bsfc of about 1688 g/kWh (Figure 2(a)). The bsfc increases for B5 series (1691-1760 g/kWh) and for B10 series (1692-1762 g/kWh). The higher the additive in the blend, the higher the bsfc is for both the series. There is no significant increase in bsfc for B5 and B10 series when the amount of additive is 0.25% in the blend. Figure 2(b) demonstrates the thermal efficiency of the engine for different fuels. ULSD has the efficiency of about 4.68%, however, B5 and B10 show a little increase in efficiency, 4.71% and 4.73%, respectively. With 0.25 % additive in both B5 and B10 series, the efficiency is similar or a little higher than that of ULSD. However, efficiency degrades with higher amount of additive in the blends, and B5A(2.0) and B10A(2.0) have efficiencies of 4.52% and 4.54%, respectively. It is seen that the bsfc increases with the increase in the amount of additives in the blend, due to lower heating value of blends with higher additives (Table 1). The efficiency result sugges ts that the blends with higher additives do not perform as good as that with the lower amount of additives in the blend.
Emissions at Low Load Condition
IJEDR1501068
International Journal of Engineering Development and Research (www.ijedr.org)372
1640 1660 1680 1700 1720 1740 1760 1780 bsfc ( g /kW h) 4.4 4.45 4.5 4.55 4.6 4.65 4.7 4.75 The rma l e ffic ienc y ( % ) Different fuels ULSD bsfc (1688 g/kWh)ULSD
η
th(4.68%)
Low load condition
Fig. 2: bsfc and thermal efficiency at low load condition
40 45 50 55 60 65 70 75 C O e mi ssi ons ( g /kW h) 0 3 6 9 12 15 18 HC e mi ssi ons ( g /kW h) Different fuels ULSD CO (71.71 g/kWh) ULSD HC (12.5 g/kWh)
Low load condition
4 8 12 16 20 24 28 32 36 40 NO e mi ssi
ons (g
/kW h) 4 8 12 16 20 24 28 32 36 40 NO 2 emi ssi ons ( g /kW h) 4 8 12 16 20 24 28 32 36 40 NO x e mi ssi
ons (g
/kW
h)
Different fuels
ULSD NO (8.95 g/kWh)
ULSD NO2
(10.9 g/kWh)
ULSD NOx (19.85 g/kWh)
Low load condition
Fig. 4: NO, NO2 and NOx emissions at low load condition
IJEDR1501068
International Journal of Engineering Development and Research (www.ijedr.org)373
blend with additives has more oxygen in it, which might be the reason of higher NOx emissions with higher amount of additives in the blend.Engine Performance at Medium Load Condition
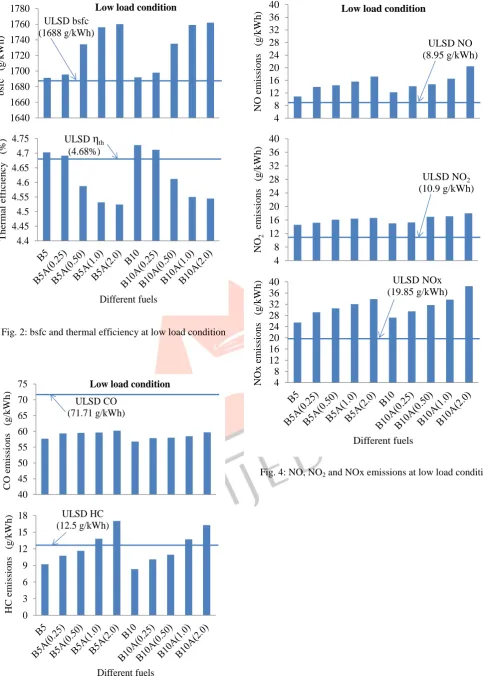
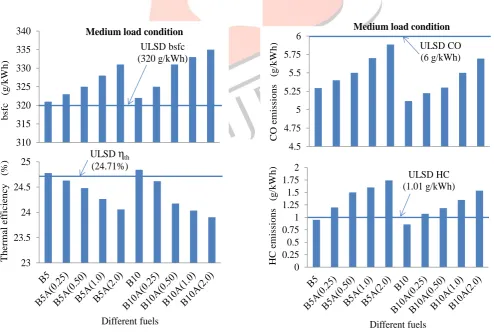
Figure 5 shows the bsfc and the thermal efficiency of the engine at medium load condition for different fuels. ULSD has the bsfc of about 320 g/kWh, which is much lower than that at low load condition. The bsfc gradually increases for B5 and for B10 series and the highest bsfc is observed as 335 g/kWh for B10A(2.0). Here again, there is no significant increase in bsfc for B5 and B10 series when the amount of additive is 0.25% in the blend. Figure 5(b) demonstrates the thermal efficiency of the engine for different fuels. ULSD has the efficiency of about 24.7%, however, B5 and B10 have a little increase in efficiency, 24.78% and 24.85%, respectively. Efficiency degrades with the addition of additive in the blends, and B5A(2.0) and B10A(2.0) have efficiencies of about 24.05% and 23.9%, respectively.
Emissions at Medium Load Condition
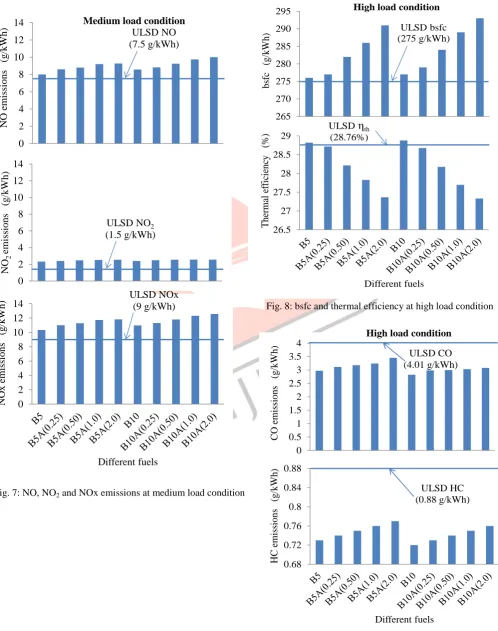
Figure 6 presents CO and HC emissions at medium load condition for different fuels. It is found from Figure 6(a) that the level of CO in the exhaust for B5 and B10 are the lowest ones, 5.29 g/kWh and 5.12 g/kWh, respectively. With the addition of the additives, CO increases, but, it is still below the level of ULSD (6 g/kWh). HC emissions increase gradually with the addition of the additives in the blend and B5A(2.0) and B10A(2.0) produce 1.74 g/kWh and 1.54 g/kWh of HC, respectively, which are about 72% and 52% higher than ULSD, respectively.
Figure 7 shows emissions of NO, NO2 and NOx at medium load condition for different fuels. ULSD emits 7.5 g/kWh of NO (Fig. 7(a)), which increases with the increase in additives in the blends for both B5A and B10A series. B5A(2.0) emits 24% more and B10A(2.0) 33% more than that of ULSD. It is seen from Figure 7(b) that NO2 emissions with ULSD is about 1.5 g/kWh, which is much lower than its NO emissions. With higher amount of additives in the blend, NO2 increases, and B5A(2.0) and B10A(2.0) emit 70% more than that of ULSD. Figure 7(c) shows the NOx emissions. The total NOx with ULSD is 9 g/kWh, whereas, B5A(2.0) and B10A(2.0) emit 11.82 g/kWh and 12.57 g/kWh of NOx, respectively.
Engine Performance at High Load Condition
Figure 8 illustrates the bsfc and the thermal efficiency of the engine at high load condition for different fuels. ULSD and other fuels at this load condition have the lowest bsfc. The bsfc increases for B5 series from 276-291 g/kWh and for B10 series from 277-293 g/kWh. There is no significant increase in bsfc for B5 and B10 series when the amount of additive is 0.25% in the blend. It is observed from Figure 8(b) that the ULSD has the highest efficiency of about 28.75% among different load conditions, and with 0.25 % additive in both B5 and B10 series, the efficiency is similar to that of ULSD. However, efficiency degrades with higher amount of additive in the blends, and B5A(2.0) and B10A(2.0) have efficiencies of 27.3%.
310 315 320 325 330 335 340
bsfc
(
g
/kW
h)
23 23.5 24 24.5 25
The
rma
l
e
ffic
ienc
y
(
%
)
Different fuels ULSD bsfc (320 g/kWh)
Medium load condition
ULSD
η
th(24.71%)
Fig. 5: bsfc and thermal efficiency at medium load condition Fig. 6: CO and HC emissions at medium load condition
4.5 4.75 5 5.25 5.5 5.75 6
C
O e
mi
ssi
ons
(
g
/kW
h)
0 0.25 0.5 0.75 1 1.25 1.5 1.75 2
HC e
mi
ssi
ons
(
g
/kW
h)
Different fuels
ULSD CO (6 g/kWh)
ULSD HC (1.01 g/kWh)
IJEDR1501068
International Journal of Engineering Development and Research (www.ijedr.org)374
Emissions at High Load ConditionFigure 9 demostrates CO and HC emissions at high load condition for different fuels. It is noticed from Figure 9(a) that the level of CO in the exhaust for different biodiesel blends without and with additives are about 14-30% lesser than ULSD. Figure 9(b) indicates that at high load condition, HC emissions with additives are lower than ULSD, although HC emissions are higher at low and medium load conditions (Figures 3 and 6). This is believed due to the shorter ignition delay and lower overleaning possibility due to higher amount of fuel supply at high load condition.
0 2 4 6 8 10 12 14 NO e mi ssi
ons (g
/kW h) 0 2 4 6 8 10 12 14 NO 2 emi ssi
ons (g
/kW h) 0 2 4 6 8 10 12 14 N O x e missi ons (g /kW h) Different fuels ULSD NO (7.5 g/kWh)
ULSD NO2
(1.5 g/kWh)
ULSD NOx (9 g/kWh)
Medium load condition
265 270 275 280 285 290 295 bsfc ( g /kW h) 26.5 27 27.5 28 28.5 29 Th er ma l ef fic ie nc y ( % ) Different fuels High load condition
ULSD bsfc (275 g/kWh)
ULSD
η
th (28.76%) 0 0.5 1 1.5 2 2.5 3 3.5 4 C O e mi ssi ons ( g /kW h) 0.68 0.72 0.76 0.8 0.84 0.88 HC e mi ssi ons ( g /kW h) Different fuels ULSD CO (4.01 g/kWh) ULSD HC (0.88 g/kWh) High load conditionFig. 8: bsfc and thermal efficiency at high load condition
Fig. 7: NO, NO2 and NOx emissions at medium load condition
IJEDR1501068
International Journal of Engineering Development and Research (www.ijedr.org)375
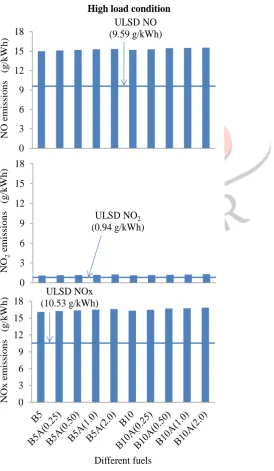
Figure 10 shows emissions of NO, NO2 and NOx at high load condition for different fuels. ULSD emits 9.6 g/kWh of NO (Figure 10(a)), and it increases with the increase in additives in the blends for both B5A and B10A series. B5A(2.0) and B10A(2.0) emit about 62% more NO than that of ULSD. Figure 10(b) shows that NO2 emissions with ULSD is only 0.94 g/kWh. With higher amount of additives in the blend, NO2 increases, and maximum NO2 emits for the fuels B5A(2.0) and B10A(2.0). Figure 10(c) shows the NOx emissions, and for biodiesel blends with and without additives, which is 16.1-16.86 g/kWh, about 53-60% higher than ULSD.V.CONCLUSIONS
This study has investigated Wintron XC 30 at different blending rates (0.25-2.0%) with low percentage of biodiesel blends (B5 and B10), in order to search for a biodiesel additive. Cold flow property of different blends has been compared to that o f ULSD. B5A(1.0) and B5A(2.0) revealed that these blends have better cold flow property (cloud point of -43˚C) than ULSD (CP of -41˚C). 1-2% additive in the blend shows 6˚C CP decrease for B5 and 3-4˚C CP decrease for B10. This study has also examined the performance and emissions of a DI diesel engine with different blends. The bsfc and thermal efficiency of B5A and B10A series without and with 0.25% of additive at all load conditions are pretty similar, however, B5A and B10A with 1-2% additive have a little higher bsfc and lower thermal efficiency than ULSD. CO emissions at all load conditions for both the B5A and B10A series are lower (3-33%) than ULSD. At high load condition, HC emissions for both the B5A and B10A series are about 12-15% lower than ULSD. NOx emissions at all load conditions with B5A and B10A series are 50-100% higher than ULSD.
0 3 6 9 12 15 18
NO
e
mi
ssi
ons (g
/kW
h)
0 3 6 9 12 15 18
NO
2
e
missi
ons
(
g
/kW
h)
0 3 6 9 12 15 18
N
O
x
e
missi
ons
(g
/kW
h)
Different fuels ULSD NO (9.59 g/kWh)
ULSD NO2
(0.94 g/kWh)
ULSD NOx (10.53 g/kWh)
High load condition
IJEDR1501068
International Journal of Engineering Development and Research (www.ijedr.org)376
VI.ACKNOWLEDGEMENT
The authors acknowledge Lakehead University and Brazilian Government for their financial support to this project through science without border (SWB) program. Thanks also to Mr. Joe Ripku, the technologist in the Department of Mechanical Engineering at Lakehead University, for his help in engine tests.
REFERENCES
[1] USEPA. A comprehensive analysis of biodiesel impacts on exhaust emissions. EPA420-P-02-001; 2002.
[2] Directive 2009/28/EC. On the promotion of the use of energy from renewable sources and amending and subsequently repealing Directives 2001/77/EC and 2003/30/EC. OJEU 2009; L 140:16-62.
[3] Kannan GR, Karvembu R, Anand R. Effect of metal based additive on performance emission and combustion characteristics of diesel engine fuelled with biodiesel. Appl Energy 2011;88(11):3694-3703.
[4] Di Y, Cheung CS, Huang ZH. Experimental investigation on regulated and unregulated emissions of a diesel engine fueled with ultra-low sulfur diesel fuel blended with biodiesel from waste cooking oil. Sci Total Environ 2009;407:835–46.
[5] Buyukkaya E. Effects of biodiesel on a DI diesel engine performance, emission and combustion characteristics. Fuel 2010;89:3099–105.
[6] Ng JH, Ng HK, Gan SY. Characterisation of engine-out responses from a light duty diesel engine fuelled with palm methyl ester (PME). Appl Energy 2012;90:58–67.
[7] Wu F, Wang J, Chen W, Shuai S. A study on emission performance of a diesel engine fueled with five typical methyl ester biodiesels. Atmos Environ 2009;43(7):1481–5.
[8] Lin B-F, Huang J-H, Huang D-Y. Experimental study of the effects of vegetable oil methyl ester on DI diesel engine performance characteristics and pollutant emissions. Fuel 2009;88:1779–85.
[9] Hazar H. Cotton methyl ester usage in a diesel engine equipped with insulated combustion chamber. Appl Energy 2010;87(1):134-40.
[10] Sun JF, Caton JA, Jacobs TJ. Oxides of nitrogen emissions from biodiesel-fuelled diesel engines. Prog Energy Combust 2010;36:677–95.
[11] Xue JL, Grift TE, Hansen AC. Effect of biodiesel on engine performances and emissions. Renew Sust Energy Rev 2011;15:1098–116.
[12] Dunn R, Shockley M, Bagby M. Improving the low-temperature properties of alternative diesel fuels: Vegetable oil-derived methyl esters. J American Oil Chemists’ Society, 1996;73(12): 1719–28.
[13] Soriano NU, Migo VP, Matsumura M. Ozonized vegetable oil as pour point depressant for neat biodiesel. Fuel 2006;85(1), 25–31.
[14] Shrestha DS, Van Gerpen J, Thompson J. (2008) Effectiveness of cold flow additives on various biodiesels, diesel, and their blends. Transactions of the ASABE 2008;51(4):1365-70.
[15] Bhale PV, Deshpande NV, Thombre SB. Improving the low temperature flow properties of biodiesel fuel. Renewable Energy 2009;34(3):794-800.
[16] Yasin MHM, Yusaf T, Mamat R, Yusop AF. Characterization of a diesel engine operating with a small proportion of methanol as a fuel additive in biodiesel blend. Appl Energy 2014;114:865-73.
[17] Zhu L, Cheung CS, Zhang WG, Huang Z. Emissions characteristics of a diesel engine operating on biodiesel and biodiesel blended with ethanol and methanol. Sci Total Environ 2010;408(4):914–21.
[18] Joshi H, Moser BR, Toler J, Smith WF, Walker T. Effects of blending alcohols with poultry fat methyl esters on cold flow properties. Renewable Energy 2010;35:2207–10.
[19] Sivalakshmi S, Balusamy T. Effect of biodiesel and its blends with diethyl ether on the combustion, performance and emissions from a diesel engine. Fuel 2013;106:106–10.
[20] Aydin H, Bayindir H, Ilkilic C. Emissions from an engine fueled with biodiesel-kerosene blends. Energy Sources 2011; Part A, 33:130–37.
[21] Boshui C, Yuqiu S. Effect of cold flow improvers on flow properties of soybean biodiesel. Biomass Bioenergy 2010;34:1309–13.
[22] Al-Sabagh AM, Noor El-Din MR, Morsi RE, Elsabee MZ. Styrene-Maleic anhydride copolymer esters as flow improvers of waxy crude oil. Journal of Dispersion Science and Technology, 30:420–426, 2009.
[23] Roy MM, Wang W, Alawi M. Performance and emissions of a diesel engine fueled by biodiesel–diesel, biodiesel–diesel-additive and kerosene–biodiesel blends. Energ Conv Manage 2014;84:164-73.
[24] Make your own biodiesel. http://journeytoforever.org/biodiesel_make.html.
[25] Roy MM, Wang W, Bujold J. Biodiesel production and comparison of emissions of a DI diesel engine fueled by biodiesel–diesel and canola oil–diesel blends at high idling operations. Appl Energy 2013;106:198-208.