P R O C E E D I N G S
Open Access
Evaluation of gene-based association tests for
analyzing rare variants using Genetic Analysis
Workshop 18 data
Andriy Derkach
1, Jerry F Lawless
2,3, Daniele Merico
4,5, Andrew D Paterson
3,5, Lei Sun
1,3*From
Genetic Analysis Workshop 18
Stevenson, WA, USA. 13-17 October 2012
Abstract
The focus of our work is to evaluate several recently developed pooled association tests for rare variants and assess the impact of different gene annotation methods and binning strategies on the analyses of rare variants under Genetic Analysis Workshop 18 real and simulated data settings. We considered the sample of 103 unrelated individuals with sequence data, genotypes of rare variants from chromosome 3, real phenotype of hypertension status and simulated phenotypes of systolic blood pressure (SBP) and diastolic blood pressure (DBP), and covariates of age, sex, and the interaction between age and sex. In the analysis of real phenotype data, we did not obtain significant results for any binning strategy; however, we observed a slight deviation of thep-values from the uniform distribution based on the protein-damaging variant grouping strategy. Evaluation of methods using simulated data showed lack of power even at the conservative level of 0.05 for most of the causal genes on chromosome 3. Nevertheless, analysis ofMAP4produced good power for all tests at various levels of the tests for both DBP and SBP. Our results also confirmed that Fisher’s method is not only robust but can also improve power over individual pooled linear and quadratic tests and is often better than other robust tests such as SKAT-O.
Background
Next-generation sequencing (NGS) technology provides rich data for the analysis of the role of rare variants in complex human diseases and traits. Because of the low power associated with analyzing one single rare variant, many pooled association tests have been proposed for joint analysis of a group of rare variants. The methods proposed so far include the earlier linear statistics that are powerful when most of the variants are causal and have the same direction of effect [1,2], the quadratic statistics that are not sensitive to the direction of effect [3-5], and the more recent hybrid statistics that combine the evidence from the complementary linear and quadratic statistics [6,7]. However, few studies evaluate the different classes of tests, and fewer investigate the impact of differ-ent variant grouping strategies on the pooled association
analysis, which is the goal of our study here. Using the Genetic Analysis Workshop 18 (GAW18) real and simu-lated data, we evaluate two commonly used statistics from each of the linear and quadratic classes of tests plus three recently proposed robust statistics, and we investi-gate five gene-based variant grouping strategies, of which three focus on coding variants.
Methods
Association tests for rare variants
We considered 7 association tests recently developed for analyzing rare variants using a sample of unrelated indi-viduals. All methods considered can be described through a vector of statistics,S= (S1, ..., SJ), where
Si= n
i=1
(Yi− ˆYH0,i)Gij
and J is the total number of single-nucleotide poly-morphisms (SNPs) in the bin or group of variants under * Correspondence: [email protected]
1
Department of Statistical Sciences, University of Toronto, Toronto, Ontario M5S 3G3, Canada
Full list of author information is available at the end of the article
study, Yi is the phenotype value of the ith individual,
i = 1,...,n, Gij is the number of rare alleles for the ith
individual at thejth SNP, and YHˆ 0,i is the fitted
pheno-type value of theith individual under the null hypothesis of no association between the phenotype Yand geno-typesGof the group of variants under study. The fitted phenotype values can depend on a set of covariatesX.
The 7“pooled” association test statistics are functions of the vectorS, aggregating information across theJ var-iants. They includetwo linear statisticsof the form
WLw= J
j=1 wjSj,
whereWL1uses equal weights [1] andWLp uses minor
allele frequency- (MAF,p) based weights [2],two quad-ratic statisticsof the form
WQ=SAS,
where the C-alpha statistic, WC= J
j=1 S2
j, usesA = I[3],
and the Hotelling statistic,WH, uses the inverse of the
estimated covariance matrix ofSunder the null hypoth-esis [4,5], andthree robust hybrid statistics, SKAT-O [6], minimum-p and Fisher’s statistics [7], which combine the association evidence from complementary linear and quadratic statistics. The minimum-p statistic is
Wmin= min(pL1,pC),
and Fisher’s statistic is
WF =−log(pL1)−log(pC),
wherepL1andpCarep-values, respectively, of the linear
WL1 and quadraticWC tests. The SKAT-O statistic is
similar in nature to the minimum-p statistic [6,7].
Gene annotation and data analysis
For the purpose of this study, we focused on the 103 unrelated individuals with NGS data from the GAW18, rare variants from chromosome 3, the first of four mea-surements for systolic blood pressure (SBP), diastolic blood pressure (DBP) and hypertension status, and cov-ariates age, sex, and the interaction between age and sex. Rare variants were defined as SNPs with MAF of 0.05 or less, estimated from the 103 unrelated sequenced individuals. The analysis of the real data focused only on the hypertension status; the analysis of the simulated response data studied premedicated SBP and DBP values (for medicated individuals we increased their values of SBP and DBP by 6.2 and 7.9, respectively, as specified in the provided answers) as well as hyper-tension status. Last, we analyzed the continuous and dichotomized values of simulated phenotype Q1, which
is unrelated to the genotypes, to evaluate the type I error of the 7 statistics.
The selection of groups of rare variants for pooled association analyses is critical, in terms of statistical power, for all methods [1-7]. We used several software packages to annotate the sequenced SNPs. Gene mapping and variant type annotations were done with ANNOVAR [8]. Variant impact predictions were generated using SIFT [9] and PolyPhen [10], combined scores were based on CONDEL [11], and conservation scores were downloaded from UCSC (placental-mammal) [12]. More details of the annotation procedures are presented in another GAW18 paper by Nalpathamkalamet al[13].
Based on the variant annotation, we considered a gene-based approach using three strategies to group/bin the variants within each gene. We grouped variants that belong to the same gene and are of the same annotation type, that is, (a) coding variants, (b) protein-changing variants, and (c) protein-damaging variants. We note that (c) is a subgroup of (b), and (b) is a subgroup of (a). We obtained p-values for each of the 7 statistics by parametric bootstrap [4,5]. For the continuous response, we first fitted a linear regression model that includes age, sex, and interaction between age and sex, which corresponds to the null hypothesis that the genotypes of J SNPs are not associated with the continuous response variable (SBP or DBP) given the other covariates. Similarly, we fitted logistic regression models with the same set of covariates when hypertension status is consid-ered as the response. We then generated bootstrap samples from the fitted models and calculated the 7 test statistics for each sample. Finally, we obtained the empiri-cal p-value for each test as the proportion of bootstrap samples with statistics more extreme than the one calculated from the original data. For each statistic and a group of SNPs, we initially used 1000 bootstrap samples to estimate thep-value. If thep-value was less than 0.01, we used an additional 100,000 bootstrap samples to estimate thep-value more accurately. For thep-value of SKAT-O, we used the available SKAT-O package [6].
Results
Gene annotation
Based on the sequence data on chromosome 3, there were 7435 high-quality variants annotated as coding var-iants, 4099 as protein-changing varvar-iants, and 1791 as protein-damaging variants (Table 1). However, these numbers were reduced with the restriction of MAF of 0.05 or less (Table 1).
Real data
resampling, we observed correct type I error for all the 6 methods as expected. We also observed correct type I error for SKAT-O (results not shown).
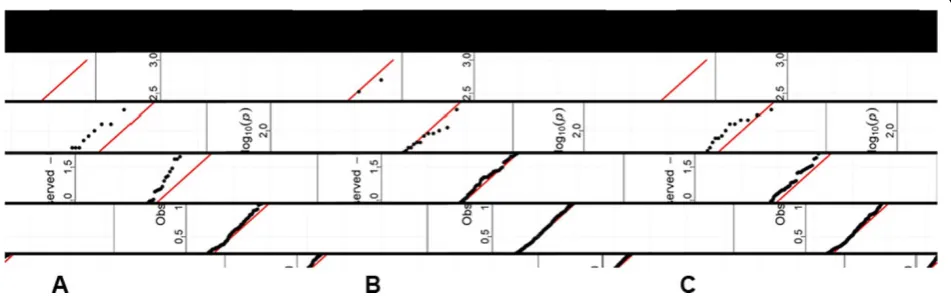
In the analysis of hypertension status based on the real data, none of the genes appeared to be statistically significant using a crude Bonferroni correction for multiple testing (0.05/888 = 5.63 × 10⁻⁵ for coding, 0.05/720 = 6.94 × 10⁻⁵ for protein changing, and 0.05/ 460 = 1.1 × 10⁻⁴ for protein damaging). However, we observed that with a more refined selection of SNPs, such as the protein-damaging variants compared with the coding variants, there are deviations (i.e., more small pvalues) from the expected Unif (0,1) distribution for p-values of all 7 tests, suggesting association. As an example, Figure 1 presents the quantile-quantile plots for Fisher’s statistic for the set of genes with at least 2 variants (denoted asreducedcompared with the number of genes with at least one variant) based on each of the three binning strategies (a) to (c) in Table 1.
Simulated data
The last stage of our analysis focused on the simulated data to assess the performance of the 7 methods in terms of power. As a proof of principle, the results presentation here focuses on binning strategy (a). Of the 31 causal genes on chromosome 3 influencing SBP or DBP, 25 genes had at least one rare variant annotated as coding and polymorphic in the sample of 103 unrelated individuals. For most of these causal genes, none of the 7 tests had reasonable power (10% ore more) for any of the three phenotypes even at the conservative type 1 error level of 0.05 (Table 2).
We first note thatABTB1, GPR160, andPDCD6IPdo not have causal rare variants, but the estimated power for some tests is larger than 10%. Such results are due to linkage disequilibrium (LD) between non-causal rare variants in genes with causal rare variants from other genes. For example, the non-causal rare variant with coordinate 127395914 in ABTB1 is highly correlated
Table 1 Descriptive statistics of different grouping or binning strategies based on annotations of sequence variants on chromosome 3
Strategies of grouping variants in a gene
Total # of variants
Restricting to variants with MAF≤0.05
# of genes with≥1 variant
# of genes with≥2 variants
Average # of variants per gene with≥1 variant
Average MAF
a. Coding variants 7435 900 690 4.34 0.012
b. Protein changing 4099 729 479 2.95 0.011
c. Protein damaging 1791 462 210 1.94 0.011
d. Protein changing or conservative T1
15,326 (4099 + 11227)
1034 841 8.17 0.011
e. Protein damaging or conservative T2
5987 (1791 + 4196)
735 438 4.31 0.012
Descriptive statistics for rare variants with minor allele frequencies of 0.05 or less were constructed from the sample of 103 unrelated individuals. The number of genes and average number of variants per gene were slightly reduced when we analyzed the real data because the number of individuals was reduced to 96 after consideration of missing phenotype and covariates.
with the causal variant with coordinate 48040284 in MAP4. Similarly, we observed that the genotype of a single non-causal rare variant (169801953) in GPR160is identical to the genotype of a causal rare variant (47913455) inMAP4 in the sample of 103 individuals considered.
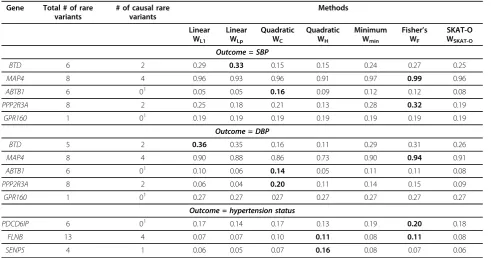
Results in Table 2 clearly show that individual pooled linear and quadratic statistics can have substantial differ-ence in power even when all causal rare variants have effects in the same direction. For example, for the causal BTDgene, the estimated power for the two linear statistics was significantly larger than those for the two quadratic statistics (for both SBP and DBP), but the pattern is
reversed for ABTB1 (for both SBP and DBP) and
PPP2R3A(for DBP). In contrast, the three hybrid statistics, Wmin, WF,andWSKAT-O, are robust: for each gene, they are
comparable in terms of power to the method with the maximum power for that gene. We also observed that Fisher’s method, which combinesp-values from the linear and quadratic test statistics, has better power in most cases than the other two robust statistics, minimum-p and SKAT-O, and it is the best or the second best option in many cases.
Results in Table 2 also show that, with the exception ofMAP4, all tests have low power even at the 0.05 level;
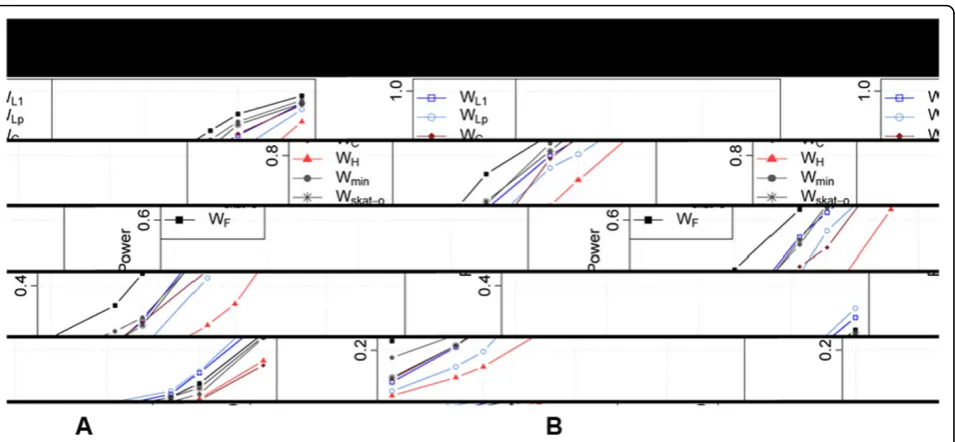
adjusting for multiple testing will further decrease power. Focusing onMAP4andBTD, the two genes with the lar-gest power for SBP, we investigated the relationship between power and level of the tests using a receiver oper-ating characteristic (ROC) curve (Figure 2). ForMAP4, the Fisher’s method consistently outperforms all other tests, and power is above 20% even at the 10−5level; forBTD, all tests have power less than 20% even at the 0.01 level. We observed a similar pattern with DBP; analyses for hypertension were not considered because of the low power even at the 0.05 level.
Discussion
We investigated several gene-based grouping strategies for rare variants and analyzed both the real and simu-lated phenotype data. We observed that further restric-tion of rare variants based on annotarestric-tion is promising (e.g., from coding to protein damaging); however, we did not observe statistically significant results after adjusting for multiple hypothesis testing. The strategies presented so far focused on coding variants. We also considered two other strategies that include non-coding variants but restricted to variants that belong to conser-vation tier 1 group (T1) (PhastCons score >0 and Phy-loP score >1) and tier 2 group (T2) (PhastCons >400
Table 2 Empirical power for the 7 association tests using simulated phenotype data
Gene Total # of rare variants
PPP2R3A 8 2 0.25 0.18 0.21 0.13 0.28 0.32 0.19
GPR160 1 01 0.19 0.19 0.19 0.19 0.19 0.19 0.19
Outcome = DBP
BTD 5 2 0.36 0.35 0.16 0.11 0.29 0.31 0.26
MAP4 8 4 0.90 0.88 0.86 0.73 0.90 0.94 0.91
ABTB1 6 01 0.10 0.06 0.14 0.05 0.11 0.11 0.08
PPP2R3A 8 2 0.06 0.04 0.20 0.11 0.14 0.15 0.09
GPR160 1 01 0.27 0.27 027 0.27 0.27 0.27 0.27
Outcome = hypertension status
PDCD6IP 6 01 0.17 0.14 0.17 0.13 0.19 0.20 0.18
FLNB 13 4 0.07 0.07 0.10 0.11 0.08 0.11 0.08
SENP5 4 1 0.06 0.05 0.07 0.16 0.08 0.07 0.06
Two continuous phenotypes, systolic blood pressure (SBP) and diastolic blood pressure (DBP), and one binary phenotype, hypertension status, were analyzed. Rare variants (minor allele frequency≤0.05) were grouped by gene and annotated as coding (strategy a in Table 1). All causal variants have the same direction of effect by the Genetic Analysis Workshop 18 simulation design. Level of tests was set to 0.05 because of a lack of power at a more stringent level. Genes presented are the ones with maximum power (bolded) among the 7 tests greater than 10% at the 0.05 level.
1“
and PhyloP score >1.5) (see Nalpathamkalamet al [13] for more details on these annotation strategies). These lead to grouping variants from the same gene, which are (d) protein-changing or conservative T1 variants with 11,227 high-quality variants and (e) protein-damaging or conservative T2 variants with 4196 high-quality variants (Table 2). These additional strategies could be more powerful than the coding-only strategies because causal rare variants from regulatory regions could be added to the analysis. However, we note that the simulated causal variants in GAW18 were all in or near gene. When strategies (d) and (e) were considered in our additional analysis with the real binary hypertension phenotype, we did not observe significant improvement in terms of departure of the empiricalp-value distribution from the null distribution. We did, however, observe that top-ranked genes differ considerably among the different binning strategies, further confirming the practical importance of annotation in analyzing a group of rare variants [5].
In the analysis of simulated data, as a proof of princi-ple, we focused on the comparison of various methods using binning strategy (a). Most of the genes with causal variants had poor or no power even at the conservative level of 0.05. This is due to the small sample size, small effect sizes, and perhaps our binning strategy. Neverthe-less, analysis ofMAP4produced good power for all tests at various levels of the tests for both DBP and SBP. We also noticed that studies with hypertension status as a response variable generally had lower power than stu-dies with SBP and DBP, indicating that dichotomization
of blood pressure into just two groups masks the effect of the genes. Our results also confirmed that Fisher’s sta-tistic is not only robust but can also improve power over individual pooled linear and quadratic tests and is often better than SKAT-O, which relies on the minimum p -value principle [7]. The results here are consistent with what has been reported in the literature (e.g., [4,5]): power differences between linear and quadratic statistics can be substantial, and robust statistics are needed to provide consistently acceptable power across different genetic settings. In addition, Fisher’s statistic performs best when, as here, “the majority of the causal variants have the same direction of effect (either deleterious or protective)”[7]. Finally, we show that LD between causal variants in one gene and non-causal variants in nearby genes can result in potential confounding and apparent false positives.
Competing interests
The authors declare that they have no competing interests.
Authors’contributions
AD, JFL, and LS created the overall study design. AD did the overall analysis. DM and ADP created the gene annotation design and did the analysis. AD, JFL, and LS drafted the manuscript. All authors read and approved the final manuscript.
Acknowledgements
This work was supported by the Natural Sciences and Engineering Research Council of Canada (NSERC) and the Canadian Institutes of Health Research (CIHR) grants to LS, NSERC to JFL, the Ontario Graduate Scholarship (OGS), and the CIHR Strategic Training for Advanced Genetic Epidemiology (STAGE) fellowship to AD, University of Toronto. ADP holds a Canada Research Chair in the Genetics of Complex Diseases. The GAW18 whole genome sequence
data were provided by the T2D-GENES (Type 2 Diabetes Genetic Exploration by Next-generation sequencing in Ethnic Samples) Consortium, which is supported by National Institutes of Health (NIH) grants U01 DK085524, U01 DK085584, U01 DK085501, U01 DK085526, and U01 DK085545. The other genetic and phenotypic data for GAW18 were provided by the San Antonio Family Heart Study and San Antonio Family Diabetes/Gallbladder Study, which are supported by NIH grants P01 HL045222, R01 DK047482, and R01 DK053889. The GAW is supported by NIH grant R01 GM031575.
This article has been published as part ofBMC ProceedingsVolume 8 Supplement 1, 2014: Genetic Analysis Workshop 18. The full contents of the supplement are available online at http://www.biomedcentral.com/bmcproc/ supplements/8/S1. Publication charges for this supplement were funded by the Texas Biomedical Research Institute.
Authors’details 1
Department of Statistical Sciences, University of Toronto, Toronto, Ontario M5S 3G3, Canada.2Department of Statistics and Actuarial Science, University of Waterloo, Waterloo, Ontario N2L 3G1, Canada.3Division of Biostatistics, Dalla Lana School of Public Health, University of Toronto, Ontario M5S 3G3, Canada.4The Centre for Applied Genomics, The Hospital for Sick Children, Toronto, Ontario M5G 1L7, Canada.5Program in Genetics and Genome Biology, The Hospital for Sick Children, Toronto M5G 1X8, Canada.
Published: 17 June 2014
References
1. Morgenthaler S, Thilly WG:A strategy to discover genes that carry multi-allelic or mono-multi-allelic risk for common diseases: a cohort multi-allelic sums test (CAST).Mutat Res2007,615:28-56.
2. Madsen BE, Browning SR:A groupwise association test for rare mutations using a weighted sum statistic.PLoS Genet2009,5:e1000384.
3. Neale BM, Rivas MA, Voight BF, Altshuler D, Devlin B, Orho-Melander M, Kathiresan S, Purcell SM, Roeder K, Daly MJ:Testing for an unusual distribution of rare variants.PLoS Genet2011,7:e1001322.
4. Lin DY, Tang ZZ:A general framework for detecting disease associations with rare variants in sequencing studies.Am J Hum Genet2011, 89:354-367.
5. Derkach A, Lawless JF, Sun L:Pooled association tests for rare genetic variants: a review and some new results2013 [http://www.utstat.toronto.edu/ sun/Unified-manuscript_Sept_23.pdf], imsart-generic ver. 2012/08/31 file: Unified-manuscript_Sept_23.tex date: October 7.
6. Lee S, Wu MC, Lin X:Optimal tests for rare variant effects in sequencing association studies.Biostatistics2012,13:762-775.
7. Derkach A, Lawless JF, Sun L:Robust and powerful tests for rare variants using Fisher’s method to combine evidence of association from two or more complementary tests.Genet Epidemiol2012,37:110-121.
8. Wang K, Li M, Hakonarson H:ANNOVAR: functional annotation of genetic variants from high-throughput sequencing data.Nucleic Acids Res2010, 38:e164.
9. Kumar P, Henikoff S, Ng PC:Predicting the effects of coding non-synonymous variants on protein function using the SIFT algorithm.Nat Protoc2009,4:1073-1081.
10. Adzhubei IA, Schmidt S, Peshkin L, Ramensky VE, Gerasimova A, Bork P, Kondrashov AS, Sunyaev SR:A method and server for predicting damaging missense mutations.Nat Methods2010,7:248-249. 11. Gonzalez-Perez A, Lopez-Bigas N:Improving the assessment of the
outcome of nonsynonymous SNVs with a consensus deleteriousness score, Condel.Am J Hum Genet2011,88:440-449.
12. Siepel A, Bejerano G, Pedersen JS, Hinrichs AS, Hou M, Rosenbloom K, Clawson H, Spieth J, Hillier LW, Richards S,et al:Evolutionarily conserved elements in vertebrate, insect, worm, and yeast genomes.Genome Res 2005,15:1034-1050.
13. Nalpathamkalam T, Derkach A, Paterson A, Merico D:Genetic Analysis Workshop 18 single nucleotide variant prioritization based on protein impact, sequence conservation and gene annotation.BMC Proc2014, 8(suppl 2):S11.
doi:10.1186/1753-6561-8-S1-S9
Cite this article as:Derkachet al.:Evaluation of gene-based association
tests for analyzing rare variants using Genetic Analysis Workshop 18 data.BMC Proceedings20148(Suppl 1):S9.
Submit your next manuscript to BioMed Central and take full advantage of:
• Convenient online submission
• Thorough peer review
• No space constraints or color figure charges
• Immediate publication on acceptance
• Inclusion in PubMed, CAS, Scopus and Google Scholar
• Research which is freely available for redistribution