P R O C E E D I N G S
Open Access
Haplotype inference based on Hidden Markov
Models in the QTL-MAS 2010 multi-generational
dataset
Carl Nettelblad
From
14th QTL-MAS Workshop
Poznan, Poland. 17-18 May 2010
Abstract
Background:We have previously demonstrated an approach for efficient computation of genotype probabilities, and more generally probabilities of allele inheritance in inbred as well as outbred populations. That work also included an extension for haplotype inference, or phasing, using Hidden Markov Models. Computational phasing of multi-thousand marker datasets has not become common as of yet. In this communication, we further investigate the method presented earlier for such problems, in a multi-generational dataset simulated for QTL detection. Results:When analyzing the dataset simulated for the 14th QTLMAS workshop, the phasing produced showed zero deviations compared to original simulated phase in the founder generation. In total, 99.93% of all markers were correctly phased. 97.68% of the individuals were correct in all markers over all 5 simulated chromosomes. Results were produced over a weekend on a small computational cluster. The specific algorithmic adaptations needed for the Markov model training approach in order to reach convergence are described.
Conclusions:Our method provides efficient, near-perfect haplotype inference allowing the determination of completely phased genomes in dense pedigrees. These developments are of special value for applications where marker alleles are not corresponding directly to QTL alleles, thus necessitating tracking of allele origin, and in complex multi-generational crosses. The cnF2freq codebase, which is in a current state of active development, is available under a BSD-style license.
Background
Inference of haplotypes, or phasing, from genotype and pedigree data can be useful in several ways. For any kind of traditional linkage analysis, including QTL mapping, knowledge of haplotypes can help in producing a more correct analysis of linkage and thus higher statistical power and more well-defined positions. Knowledge of phase over the genome is also critical in an epigenetic con-text regarding sex-specific imprinting. Most of the research in reconstructing haplotypes from unphased data, like application of the EM algorithm [1], Clark’s algorithm [2], and certain Bayesian methods [3] were designed for
cases where no pedigrees are available, and in some cases also with an assumption of Hardy-Weinberg equilibrium. Approaches based on MCMC (Markov Chain Monte Carlo) methods can integrate general pedigree informa-tion, but do so by sampling specific realisations, slowly improving the total haplotype solution. All these approaches tend to be prohibitively computationally expensive when the number of markers or individuals grows large. When pedigree data is known, rule-based heuristical approaches are also commonly suggested. These provide excellent performance, but will frequently fail to phase all positions, either leaving markers unphased, or selecting an incorrect resolution [4].
In this communication, we focus on reconstruction of haplotypes in experimental crosses of different designs. In such data, it can be expected that pedigree
Correspondence: [email protected]
Department of Information Technology, Uppsala University, Lägerhyddsvägen 2, Uppsala, Sweden
Full list of author information is available at the end of the article
information is available and reliable. Furthermore, a large number of siblings (half or full) is generally avail-able, making the direct tracking of recombination events an attractive way to infer haplotypes. A highly efficient method, with excellent convergence properties thanks to a specially adapted optimisation algorithm, is presented. This method has previously been briefly discussed with application to an earlier QTL-MAS workshop dataset [5] where it was shown to surpass the phasing results produced with other methods [6].
Methods
A Hidden Markov Model (HMM) is defined by its states and transitions between states [7]. The hidden property is corresponding to the fact that states are not observed. Rather, emitted symbols in an alphabet are observed and those are related to the states according to some function.
Review of Hidden Markov Models for intercross genotyping
Our haplotyping HMM approach is quite similar to the genotyping approach described for outbred lines in [5]. A first overview of the extension for haplotyping is also found there. A more formal description of the corre-sponding, slightly simpler, case for genotype probabil-ities in inbred lines can be found in [8], corresponding to the implementation found in R/qtl [9].
The state space in our model consists of a set of bin-ary flags, determining the current phase in some indivi-duals. In the case of finding genotype probabilities in an
F2 cross, those flags represent the twoF1parent
indivi-duals, where the meiosis in each individual can transmit an allele originating from either the grandfather or the grandmother. Transitions between states represent recombination events. The Markov model is of the con-tinuous-time variety, where time in this case corre-sponds to the mapping distance. Emission symbols correspond to the marker data. This constitutes the hid-den quality of the model, as grandparental marker data might not map uniquely to the state.
Application of HMMs for haplotyping
The genotype probability model in the intercross gains its speed from the fact that only a single “focus” indivi-dual, its parents and grandparents need to be analyzed at the same time. In the model, what is essentially tracked is the gametes generated by meiosis in the par-ents, expressed as grandparental origin in each locus. As two meioses are tracked, there are 2 * 2 = 4 states.
The same general approach, where analysis takes place over a pedigree including a focus individual and the immediate ancestors to that focus individual, can be extended to include further generations of ancestors.
Adding one more generation would imply 64 states (tracking 6 independent meioses), as even the phase in alleles that were not transmitted need to be calculated to accurately track possible state transitions. Adding another generation increases the number of states to 16, 384, which in practice is not tractable. As noted above, the genotyping model tracking phase in the parent, but that information is never recorded explicitly. In order to make the implicit tracking of phase in individual ana-lyses explicit, we introduce a parameter, called skewness, per marker per individual. This parameter indicates the probability of the “true”ordering of the unordered mar-ker value pair {A, B} to be AB or BA, respectively. Rather than simply using binary emission probabilities for supported or unsupported marker values, the emis-sion probability will be dependent on the state realisa-tion considered. A skewness parameter value of 0.5 is neutral to ordering, while a value of 0.0 exlusively per-mits AB, and a value of 1.0 will exclusively permitBA. A dataset is phased if the skewness parameters for all heterozygous marker value pairs take such extreme values.
For the haplotyping application, we are using the 64-state model with the addition of skewness parameters. The approach of centering each analysis on a focus indi-vidual is kept from the genotyping model. A full haplo-typing iteration is thus only a matter of computing the model for each marker in each focus individual. Although no ancestral genotype information is used for the grandparents, the present of linkage will favour skewness assignments mapping linked alleles to the same strand. With a proper setup, the skewness para-meters for all marker-individual pairs can be trained in an iterative manner based on analyses in the pedigrees where the individuals appear.
Training methodology
We use a modified Baum-Welch approach [10] for training the skewness parameters. This approach is based on expectation-maximisation of the model prob-ability for observed data under optimisation of some or all model parameters. The actual value distribution of a parameter under optimisation in one iterated realisation of the model is used as the prior distribution in the next one, until convergence is reached. The skewness para-meter for the first heterozygote on each chromosome in each individual is fixed to 0.0, to avoid unnecessary symmetries. The transition parameters related to recom-bination can be kept fixed, based on a pre-determined marker map with (Haldane) mapping distances, or be subject to optimisation in tandem with the skewness parameter set.
times, allowing for the (grand)parental origin of each strand to be either the sire or dam for the respective parent. When the model has converged, most such alternatives can be truncated early due to extremely low likelihood, as a form of optimisation similar to a beam search. The total number of such shift combinations is 8 in the 64-state model, as shifts are only needed for the focus individual and its parents. The same skewness parameter is appearing in multiple separate analyses, as one individual can appear in multiple focus analyses: A parent will appear in the analysis pedigree of every off-spring. An individual acting as the focus individual in one pedigree can also be a parent or a grandparent in another, in a multi-generational setting. Furthermore, some pedigrees can be completely uninformative for a specific parameter. The“optimal”skewness assignment based on such a pedigree will always be the a priori value of the parameter from the previous iteration, and it could be called skewness-agnostic. For these two rea-sons, a voting scheme is implemented. The skewness contribution from each analysis pedigree corresponds to the deviation from the a priori value used. Thus, unin-formative locations are not hampering convergence if information is found in other pedigrees. Furthermore, the voting is scaled for contributions to ancestors more than one generation away from the focus individual. This is due to the fact that there is a single meiosis event truly tracked, the one resulting in a gamete form-ing the parent individual (F1). The offspring to that
indi-vidual are only giving different aspects of information on the same event, and should be weighted accordingly. If this was not done, the haplotype estimates in anF0
indi-vidual would be biased towards the allele combination found in F1 individuals with a high number of F2
offspring.
The voting approach where lack of information is ignored was chosen to accelerate convergence. However, in early iterations information is lacking in many loci and those few fragments of information that are present can turn out to be incorrect. For this reason, the new valuep′ for the a skewness parameter with an a priori value ofpis limited by clamping to satisfy the condition |p– p′| ≤p(1 – p) min(1/(0.5 + (1 –p)), 1/(0.5 + p)). This clamping puts a limit to the relative change in pre-ference of one phase assignment over the other, as expressed by the ratio p/(1 – p), to a factor of 3. For example, a skewness parameter value starting out at 0.5 will always be found in the range [0.25, 0.75] after one iteration. If the value is updated to 0.25, it will be found in the range [0.1, 0.5] in the following iteration. By lim-iting the rate of change for the probability ratio between these two complementary states, unstable behaviour is avoided.
In theF0 generation, the only definition of the alleles
arises from the initialisation of the skewness value in one marker. In other words, the two strands can only be defined and separated relative to that anchor marker. Phasing a full chromosome, especially a long one, is problematic as the linkage between a distant marker and this anchor will be very weak or non-existent. The hap-lotyping problem based on meioses is inherently local, along the chromosome, and between closely related individuals. Skewness values might converge in different directions in different regions of the chromosome, assuming an extraneous recombination event. The tradi-tional Baum-Welch approach, even with the modified voting scheme, would only resolve such a situation at a very slow pace, if at all. Therefore, an inversion step is added to the algorithm, where inverting all the skewness values downstream of the current marker is tested in each iteration.
If the total probability of the observed sequences, over all pedigrees, increases with such a change, it is accepted. Due to the model structure, such an inversion can be performed using the normal data structures of hidden Markov model algorithms, by essentially only modifying the state vector when combining forward and backward probabilities. In practice, care needs to be taken to avoid oscillatory behaviour, especially with respect to inversion events.
Summarised algorithm
The following algorithm summarises the haplotyping approach described above for a single chromosome. As different chromosomes are completely unrelated from a linkage and phasing perspective, the whole approach can simply be repeated per chromosome. Isolating the phasing operation per chromosome can also simplify parallelisation of the computations and reduce the amount of memory needed for each step.
1. Initialise skewness values to 0.5 everywhere, except at one heterozygous marker in every individual
2. Loop until convergence (e.g. a minimum sum of skewness changes, or a fixed number of iterations based on chromosome length)
(a) Loop over all focus individuals i. Loop over all markers
A. Compute the marginalised probability for strand realisations corresponding to observed marker values, taking all 8 parental shifts (defined above) into account, using suitable hidden Markov model algorithms.
C. Compute and contribute probability changes arising from possible skewness inversions in each individual in the dataset in a similar manner.
(b) Loop over all individuals i. Loop over all markers
A. Update skewness values according to recorded votes. Cap the maximum possible change in the ratio
p/(1–p) between iterations, in order to retain stability. B. If the recorded votes for a favorable inversion at this position exceeds some threshold, perform an inver-sion of all downstream skewness values.
Materials
The common dataset prepared for the 14th QTL-MAS workshop was used. This dataset contains 3,226 indivi-duals, spread over 5 generations, with 20 founders. 10, 031 SNP markers were defined over 5 chromosomes all about 100 million base pairs in length. A uniform recombination rate of 1 cM/Mbp was applied for both sexes. Haplotypes for the founders were sampled from a simulated population of 5, 000, using the methods described in [11].
Results
64 cores on Intel Core 2 Quad 2.66 GHz CPUs distribu-ted over 8 nodes in a cluster were used for computa-tions. The code is written in C++, parallelised using OpenMP and the MPI support in the Boost library [12]. Version 11.1 of the Intel C++ compiler was used with aggressive optimisation settings. One especially impor-tant consideration in this context is how the software and hardware stack as a whole handle so-called denor-malised numbers, where we use truncation to zero to get adequate performance. Pseudo-asymptotic conver-gence was studied by completing 25 iterations in 3,116 minutes, whereas 10 iterations would suffice for almost identical results. The set of focus individuals were cho-sen to be the set of all non-founder individuals, thus including all genotype and ancestor information possi-ble. The method was specified with 3 generations (64 states), so the individuals included in each local analysis pedigree included the focus individual, its parents and grandparents (if available).
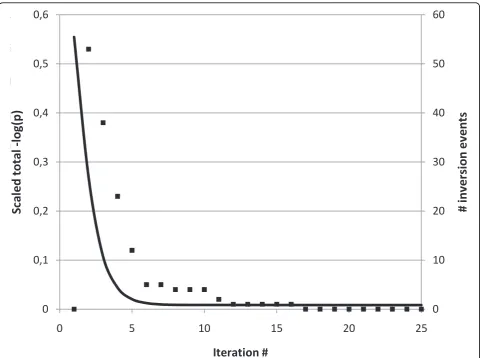
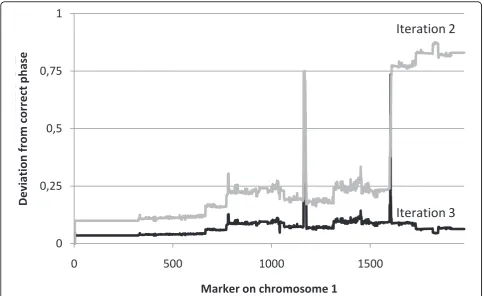
In an alternate test run with inversion turned off, con-vergence was not achieved within 25 iterations. Details on the rate of convergence, as well as the number of skewness inversion events per iteration, are illustrated in Figure 1. Inversions are in practice only needed during the very first few iterations, after which remaining uncertain skewness assignments slowly converge. The drastic improvement due to inversion is shown in Figure 2, where for the simplicity of presentation the true skewness value is illustrated as 0 over the full chromo-some. The inversion scan locates subregions of the
chromosome tending towards incompatible local optima and unifies them.
Results were compared for each generation separately. Generations were defined as contiguous blocks of num-bered individuals in the dataset. In a few matings, a founder individual was mated to a generation 2 indivi-dual, but for our purposes (only relevant in the result presentation), the generation number of the resulting offspring is 3.
True haplotype information was provided by the orga-nisers after the workshop. Comparisons demonstrate that correct phasing was achieved in 100% of heterozy-gous loci in the founder generation, where linkage in offspring was the only source of haplotype data. Total per-marker accuracy was over 99.9%, and over 99.5% in all generations. Other results are summarised per gen-eration in Table 1.
The distribution of phasing errors along chromosomes and between individuals is also relevant. Even in the most problematic generation, generation 2, over 93% of all individuals were phased correctly over all 10, 031 markers across 5 chromosomes, making the errors loca-lised to a limited subset of the population.
Discussion
In general, individuals with a rich pedigree have a higher probability of being phased correctly. This means that such individuals should preferably have parents and grandparents that themselves are correctly phased. In addition, a high number ofF1 andF2 offspring are also
of value. Each such individual represents a unique meio-sis event. The linkage information available from multi-ple direct offspring, including further refinement through descendants in successive generations, gives much stronger information than relying on ancestry alone. Based on both of these conditions, generation 2 is at an disadvantage. Many individuals lack children alto-gether, and those that did procreate still have a limited number of grandchildren. They also have only parental genotype data, with no grandparental information. When long homozygous regions appear, there is no external reference (like linkage information from grand-parents or grandchildren) to assist the phasing process.
Efficient phasing of genotype data is a complex pro-blem. Our presented approach provides excellent perfor-mance in a dataset that is representative of what can be encountered from high-quality genotyping in multi-gen-erational crosses of heterogeneous stock. It should be noted that other methods achieving > 99% accuracy fre-quently do so by leaving some loci unphased. Our method will, on the other hand, converge in all posi-tions, given proper initialisation. The most critical aspect is to choose a suitable locus for zero initialisation of skewness. If that locus can not be used to differenti-ate allele origin, the symmetry caused will result in the skewness values for allloci in that individual to remain unchanged. This situation typically arises if parents as well as grandparents are also heterozygous with the same alleles in the locus, with no known linkage, or if data is completely missing. In most cases, a sibling or cousin of the “unphasable” individual will contribute some information to the skewness values of parents and
grandparents, eventually alleviating the symmetry, yield-ing convergence in all individuals. This was not a pro-blem for the current dataset, but it has on occasion left individuals unphased in other datasets. Switching initali-sation loci will generally remedy such cases.
The specific optimisation approach used is critical to attain the two conflicting goals of convergence within a reasonable number of iterations, as well as ensuring that the converged result is actually correct. The use of e.g. Viterbi training [13] would possibly accelerate the runtime, but the converged results would be highly inferior. In fact, such an approach would be more similar to existing heuristics-based solutions, as Viterbi training relies on the assumption that a single most likely realisation will dominate the results. In the early iterations, the exact opposite is true for the haplotyp-ing problem, where a high number of different realisa-tions of phasing are attributed very similar likelihood in the model.
1
10
1 2 3 4 5 6 7 8 9 10 11 12 13 14 15 16 17 18 19 20 21 22 23 24 25
Serie1
0
10
20
30
40
50
60
1
5
9
13
17
21
25
Serie1
0
10
20
30
40
50
60
0
0,1
0,2
0,3
0,4
0,5
0,6
0
5
10
15
20
25
# in
ve
rsio
n
e
ve
n
ts
Sc
al
ed t
o
ta
l -l
og
(p
)
Iteration #
Figure 1Convergence. Left axis (solid line) illustrating scaled sum of total logarithm probabilities over all analysis, up to iteration 25. In
Conclusion
We have presented an efficient approach for determin-ing phase from unphased marker data in a dense marker map, combined with pedigree data. In contrast to other approaches, we are able to take the full genotype infor-mation of the whole chromosome into account when determining optimal haplotypes. Thanks to the use of an efficient local Markov model, considering the direct ancestors to each individual, we are able to do this with high performance.
The quality and practical feasibility of our method for haplotype inference allow producing completely phased genomes in dense pedigrees, reducing the need for molecular methods for determining explicit haplotype data. The presence of phased data can be used to iden-tify the origin of otherwise similar marker sequences, something that is needed to explore genetic architec-tures only indirectly connected to the marker map used (e.g. recent mutations in an SNP map general to the species studied).
In a simple dataset where genotyping errors are absent and no information is missing, the algorithm used could be greatly optimised by pruning the search tree, assign-ing probabilities of 0 rather than a smallεfor improb-able cases and assuming genotype data to be availimprob-able for all positions. However, our main line for current work is rather to improve handling of missing and incorrect genotype data. For example, it is not uncom-mon that pedigree data is available even for individuals where genotyping failed or was never performed. Two specific cases under consideration are advanced line intercrosses and the analysis of heterogeneous stock.
The codebase did not undergo any specific changes to accommodate the workshop dataset, with the exception
0
0,1
0,2
0,3
0,4
0,5
0,6
0,7
0,8
1
84
167
250
333
416
499
582
665
748
831
914
997
1080
1163
1246
1329
1412
1495
1578
1661
1744
1827
1910
1847
1918
0
0,25
0,5
0,75
1
0
500
1000
1500
Devi
ation
from
cor
rect
phase
Marker on chromosome 1
Iteration 2
Iteration 3
Figure 2Use of inversion. During optimisation, a scan is performed in each analysis for inverting the skewness values determining phase
downstream of each marker. Based on this scan, knots or bubbles of incorrect phase can be identified and resolved. The two lines are illustrating iteration 2 and 3, respectively, for chromosome 1 in the founder individual with ID 3. In iteration 2, a large range of markers has converged towards an inverted phase versus the correct one. This region is identified and inverted for iteration 3.
Table 1 Accuracy per generation on the level of markers and individuals
Generation Perfectly phased individuals Correctly phased markers
1 100.0% 100.0%
2 93.78% 99.60%
3 97.69% 99.98%
4 98.67% 99.99%
5 98.33% 99.97%
All 97.68% 99.93%
of modified routines for input and output in order to match relevant file formats. Code is available under a BSD-style license from our website, http://www.it.uu.se/ research/project/ctrait. In parallel with further methods development, the introduction of a standardised R inter-face to the code is also underway.
Acknowledgements
The QTL-MAS workshop organisers are acknowledged for simulating the dataset and providing phased genotypes on request. The Uppsala University UPPMAX high-performance computing cluster Grad was used for
experiments. The anonymous reviewer is thanked for comments and suggestions that led to improvements in the final version of the text. This article has been published as part ofBMC ProceedingsVolume 5 Supplement 3, 2011: Proceedings of the 14th QTL-MAS Workshop. The full contents of the supplement are available online at http://www.
biomedcentral.com/1753-6561/5?issue=S3.
Competing interests
The author declares that he has no competing interests.
Published: 27 May 2011
References
1. Excoffier L, Slatkin M:Maximum-likelihood estimation of molecular haplotype frequencies in a diploid population.Mol Biol Evol1995, 12(5):921-927.
2. Clark A:Inference of haplotypes from PCR-amplified samples of diploid populations.Mol Biol Evol1990,7(2):111-122.
3. Niu T, Qin ZS, Xu X, Liu JS:Bayesian haplotype inference for multiple linked single-nucleotide polymorphisms.Am J Hum Genet2002, 70:157-169 [http://view.ncbi.nlm.nih.gov/pubmed/11741196]. 4. Li J, Jiang T:Efficient Inference of Haplotypes from Genotypes on a
Pedigree.J. Bioinformatics and Computational Biology2003,1:41-70. 5. Nettelblad C, Holmgren S, Crooks L, Carlborg O:cnF2freq: Efficient
Determination of Genotype and Haplotype Probabilities in Outbred Populations Using Markov Models.BICoB’09: Proceedings of the 1st International Conference on Bioinformatics and Computational BiologyBerlin, Heidelberg: Springer-Verlag; 2009, 307-319.
6. Hernandez-Sanchez J, Knott S:Haplotyping via minimum recombinant paradigm.BMC Proceedings2009,3(Suppl 1):S7 [http://www.biomedcentral. com/1753-6561/3/S1/S7].
7. Rabiner LR:A tutorial on hidden Markov models and selected applications in speech recognition.Proceedings of the IEEE1989, 77(2):257-286 [http://dx.doi.org/10.1109/5.18626].
8. Broman KW:Use of hidden Markov models for QTL mapping.Working Paper 125John Hopkins University, Dept. of Biostatistics; 2006 [http://www. bepress.com/jhubiostat/paper125].
9. Broman KW, Wu H, Sen S, Churchill GA:R/qtl: QTL mapping in experimental crosses.Bioinformatics2003,19(7):889-890 [http:// bioinformatics.oxfordjournals.org/cgi/content/abstract/19/7/889].
10. Baum LE, Petrie T, Soules G, Weiss N:A Maximization Technique Occurring in the Statistical Analysis of Probabilistic Functions of Markov Chains.
The Annals of Mathematical Statistics1970,41:164-171 [http://dx.doi.org/ 10.1214/aoms/1177697196].
11. Hudson RR:Generating samples under a Wright-Fisher neutral model of genetic variation.Bioinformatics (Oxford, England)2002,18(2):337-338 [http://dx.doi.org/10.1093/bioinformatics/18.2.337].
12. Boost C++ Libraries.[http://www.boost.org].
13. Jelinek F:Continuous Speech Recognition by Statistical Methods.
Proceedings of the IEEE1976,64(4):532-557.
doi:10.1186/1753-6561-5-S3-S10
Cite this article as:Nettelblad:Haplotype inference based on Hidden Markov Models in the QTL-MAS 2010 multi-generational dataset.BMC Proceedings20115(Suppl 3):S10.
Submit your next manuscript to BioMed Central and take full advantage of:
• Convenient online submission
• Thorough peer review
• No space constraints or color figure charges
• Immediate publication on acceptance
• Inclusion in PubMed, CAS, Scopus and Google Scholar
• Research which is freely available for redistribution