Available Online at www.ijcsmc.com
International Journal of Computer Science and Mobile Computing
A Monthly Journal of Computer Science and Information Technology
ISSN 2320–088X
IMPACT FACTOR: 5.258
IJCSMC, Vol. 5, Issue. 8, August 2016, pg.66 – 72
The Effect of Different Values of Focus
Error and Spherical Aberration on the
Intensity of Sharp Edge Image
Dr. Safaa Mustafa Hameed
Environmental Engineering Dep. Hayat Private University for Science & Technology, Erbil\ Iraq [email protected]
Abstract— This research has been carried out to determine the distribution of the intensity in the image of object with a Sharp-Edge using coherent illumination. In this research, a special formulas have been derived called the Edge spreads Function (ESF) .This formula is very useful for theoretical and practical studies since it is applicable to system with any kind and amount of aberrations that are present in the optical systems by using pupil function technique. Also optimum balance values for each kind of aberration were determined, these values have been used in programs prepared specially for calculating (ESF) using quick basic programming language with Simpson method for numerical integrals in order to calculate the intensity of different quantities of aberrations such as focus error and spherical aberration (first, Third, fifth – orders). As well as the effect of Apodization upon the image of sharp Edge object resulting from an optical system operating with a small circular aperture. The main aim of this research is testing the Optical Systems which use Coherent light and make decision of this Systems validity range. we found that using the exit pupil technique is useful to calculate the complex intensity also the analysis capability when using coherent light is better than the incoherent light and the relation between the focus error and the quantity of aberration.
Keywords— edge spread function, focus error, spherical aberration, exit pupil, Apodization.
I. INTRODUCTION
source using an annular aperture . (Stephen) [5] studied the intensity distribution at different planes of sharp edge image using coherent light. Then (Goodman & Tichenor) [6] made a special accounts to calculate the value of optical transfer function (OTF) in case of coherence illumination . (Ericc.Kintner) [7] has studied the fringes of an object with a sharp edge using Fresnel diffraction theory. then (Barakat) [8] computed the linear spread function (LSF) for optical systems containing spherical aberration and coma aberration , depending on the intensity derivation in a sharp object image (Harvey) [9] and his group studied the diffraction pattern for various forms of apertures to get best analysis capability with coherent illumination. The intensity distribution in the image of objects coherently illuminated usually appears secondary ends caused by light diffraction at the optical system pupil , many theoretical research carried out for the purpose of removing these ends by (Apodization) technique. The spherical aberration can be explained by saying that the marginal rays suffer greater than the paraxial rays, spherical aberration can be minimized by means of stop apertures[10] If the optical system contains different quantities of aberrations then a phase and amplitude change will happen so they will be considered as a spatial frequency[11].
II. DERIVATION OF SHARP EDGE SPREAD FUNCTION (ESF) FOR OPTICAL SYSTEM WITH CIRCULAR APERTURE
To derive edge spread function (ESF) for an optical system, first we must derive the linear spread function (LSF) Therefore if we assume that we have a pin hole body and optical system with circular aperture, the complex amplitude in points (U,V) at the image plane can be found using Fourier transform [13] according to the relationship:
….(1)
Where are the coordinates of the exit pupil and is the pupils function that we can write as:
{
In many optics applications the function represents the transverse profile of an electromagnetic or optical field at a plane . where is a function of aberrations , is the wave number, Assuming that a linear object at the position the complex amplitude in the image of the linear object is the sum of the complex amplitudes resulting from all points of the object as follows
:
∫
Using equation (1) we get:
∫
Integral for (v)
H(u) = yx f(x,y) ei2 ux . (y) dxdy
∫ ∫
By integration for (y) according to [(y)]
∫
While the integration limits for the variable (x) lies inside the exit pupil circle (x2 + y2=1) which has area ( ), we can write the above relation in form:
∫
Here we can conclude that the complex amplitude in a linear object can be found in terms of the pupil on the vertical diameter length of the circle on the linear object. Equation (2 ) need to normalized, This means the value of H(0)=1 .This occurs when the system is completely free of any aberrations
:
which means:
∫
is the normalization factor takes the value , equation (2) takes the form:
∫
Since the edge shape object includes infinite linear objects so the complex amplitude at any point in the object‟s side of a linear object at the position can be written as follows:
∫
thus the complex amplitude becomes in the image of a sharp edge object as follows using (Convolution integral):
∫
is the complex amplitude in the image of sharp edge object, using equation (3) we get:
∫ ∫ ( )
By normalizing equation (4), the complex amplitude value in the image side must be (one unit) when assuming we get
:
[ ∫ ∫ ] [ ∫ ]
Where N is the normalization factor, the equation becomes:
[ ]
Then eq. (5) after normalizing will be:
∫
∫
Sharp edge Image intensity can be written as follows:
| |
Simplifying the two terms of eq. (5) we get:
[ ∫ ∫ ] [ ∫ ∫ ]
This equation represents the intensity distribution in the image of sharp edge object coherently illuminated in a system works with circular aperture and when there are aberrations. When there is a focus error and spherical aberration , the primary and secondary aberrations function is the following relationship :
… (7)
We can notice that the aberration function is even function for the variable (x).Taking any positive point on the x-axis and the other is negative and equal in value and substitute them in equation (6). The final form of the intensity equation in the image of sharp edge object coherently illuminated using an optical system with a circular aperture includes spherical aberration as follows:
III.RESULTS AND DISCUSSION
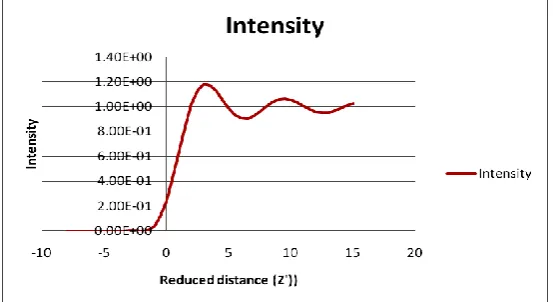
To study the effect of aberrations on the consisted images of objects with a sharp edge has been introduced for aberrations coefficients (W60), (W40), (W20) using a circular aperture , in the beginning all
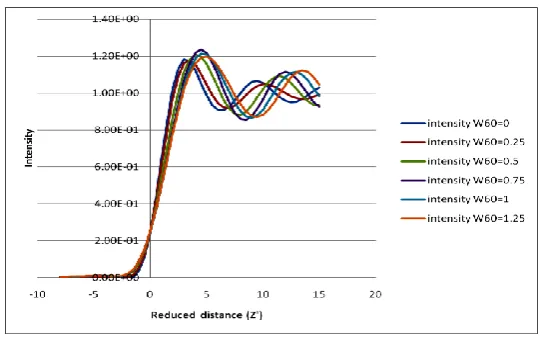
aberrations coefficients set to be ( zero ) in order to verify that the program has been running correctly, the results were compared with the results displayed by (Barakat) for different values of (Z) and they were identical. Figure (1 ) describe intensity in the image of sharp edge object in absence of aberrations. Figure (2) shows the intensity for different values of focus error; the highest values of the intensity increases with the focus error and a drop in the value of the decline curve has been happened because of the increased focus error, changes in the intensity curve represents interference fringes that looks like a clear case because of coherency between overlapping waves .Figure (3) shows the influence of the third order spherical aberration on the sharpness of the image which decreases with increasing its value, Figure (4) shows the optimum situation for the primary spherical aberration and notes that the sharpness of the image to be the best when the focus error value is equal to ( W20= - 0.86 ) . Figure (5 ) shows the effect of the fifth order spherical aberration on the distribution of
intensity in the image and the highest intensity value when (W60=1). Figure (6) shows the optimum status for
secondary spherical aberration (normalized intensity) (W60=3.6) (W40=4.9) (W20=1.63) for optical system
with circular aperture and sharp edge. The aberrations effects on the efficiency of the resulting image. The two figures (3) , (5) shows that the effect of fifth order spherical aberration is less than the third order on sharpness of the image. All results indicate that the sharpness in center of the image for coherent illumination is very high because of the analysis ability for the coherent light.
Fig. (1): Normalized intensity – free aberration system with circular aperture coherently illuminated
Fig. (3): Intensity distribution – optical system with different third order spherical aberration (primary spherical aberration)
Fig. (4): Optimum situation, intensity distribution – optical system with primary spherical aberration for different image levels.
Fig. (6): Optimum status 5th order spherical aberration
IV.CONCLUSIONS
1- Finding the complex amplitude in the image of a sharp edge body can be in terms of the exit pupil f (x)
, and not only in terms of (Optical Transfer Function).
2- Analysis capability when using coherent light is better than the incoherent light .
3- Focal error depends on the change in the kind and quantity of aberration,
4- In optimum situation for coherent illumination when (W20 = - o.86) then (W40 =1).
5- The tolerance in focus error is (w20 ≤ 0.25) in order to keep the same image quality.
6- The spherical aberrations of fifth order is less effect on the sharpness of the image than the spherical aberrations of the third order.
REFERENCES
[1] W. Weinstein, J. opt. Soc. Am. 44, 610, (1954).
[2] R. E. Kinzly, J. opt. Vol. 55, N. 8, p 1002-1007, (1965).
[3] P. S. Coinsidine, J. op. Soc. Am., Vol. 56, 1001, (1966).
[4] R. Barakat, Optica Acta, Vol. 16, No.2, p 205-223, (1969).
[5] H. Rowe Stephen, Opt. Soc. Am. Vol. 59, No. 6, p711, (1969).
[6] D. A. Tichenor and J. W. Goodman, J. Op. Sec. Am., Vol. 62, p 293, (1972).
[7] E. C. Kintner, Optica Acta, Vol. 22, p 235-, (1975).
[8] R. Barakat, Optica Acta, Vol. 22, 235, (1975).
[9] J. E. Harvay, A. B. Wissinger and A. N. Bunner, Spie, Vol. 643, 194 (1986).
[10] D. Singh, „fundamental of optics‟ ,PHI Learning Private Limited, P (53-54), (2010
[11] W. F. Ali, “design of optical modulator using fractal geometry function” , Msc. Thesis ,Almustansriyah
university, Iraq, (2004).
[12] T. Chung ,T.Kim, “engineering optics with Mat lab” , world science publishing Co. Pte. Ltd., p (74),(2006). [13] J.F.James, „A student‟s guide to Fourier transformations‟, Cambridge university press , third edition,