High Sensitivity Optical Detection Using Temporal Coherence
Interferogram Phase Changes
by
Ricardo Cesar Coutinho
T hesis P resen ted for E x am ination for the D egree o f Ph.D . at the
U n iv ersity o f L ondon
D e p a rtm en t o f E lectronic an d E lectrical E n g in eerin g
U n iv ersity C o lleg e L ondon
ProQuest Number: 10042798
All rights reserved
INFORMATION TO ALL USERS
The quality of this reproduction is dependent upon the quality of the copy submitted.
In the unlikely event that the author did not send a complete manuscript and there are missing pages, these will be noted. Also, if material had to be removed,
a note will indicate the deletion.
uest.
ProQuest 10042798
Published by ProQuest LLC(2016). Copyright of the Dissertation is held by the Author.
All rights reserved.
This work is protected against unauthorized copying under Title 17, United States Code. Microform Edition © ProQuest LLC.
ProQuest LLC
789 East Eisenhower Parkway P.O. Box 1346
ACKNOWLEDGEMENTS
I am deeply thankful to Prof. Herbert A. French (QBE) not only for giving me the opportunity to explore one o f his patents in this research, but also and mainly for teaching my first lessons in optics and in coherence theory. He was the best teacher I could ever have for these subjects because, as happened to him in the nineteen sixties, I have also moved from a radar and signal processing background to the optics field.
To my supervisor Prof. Hugh D. Griffiths, for his firm supervision, being always supportive since I left my country in 1998, and for believing in my capacity to succeed.
To my subsidiary supervisor David R. Selviah, for stretching me to the limit o f my work capacity, for continuously seeking perfection, and for his wise help in the improvement o f my writing in English.
To Duleep Wickramasinghe for fruitful tuition and discussions, and for providing most o f the equipment used in this thesis, with permission from DERA Portsdown West.
To my colleagues in the two research groups I have been involved with, especially Lawrence Commander from the Optical Systems and Devices Group, and Richard Bullock from the Microwaves, Radar and Optics Group, for telling me the “how to”s.
To the Brazilian Navy, for sponsoring my studies in the UK for 28 months.
To my wife and children, for sharing their husband and father with such a time-consuming rival without giving me up.
To God, for allowing all o f this to happen.
ABSTRACT
Most current detection and imaging systems rely on intensity differences between the object o f interest and the background. With the recent advances in detector and computing technologies, sensitivities are reaching the background quantum fluctuation level, and performances tend to be limited by background clutter. In order to obtain further contrast enhancement, new dimensionality must be added to the detection process.
This thesis studies a detection technique named Interferogram Phase Step Shift (IPSS), which relies on the coherence contrast between target and background to improve discrimination. The approach employs an interferometer to create a coherence profile, a narrowband optical filter to generate a feature in this profile, and an algorithm to locate this feature. By measuring the shift in this feature in path difference, incremental changes in coherence can be sensed. Unlike Fourier transform spectroscopy, it does not require a Fourier transform, and performs a much narrower path difference scan, generating less data for processing.
Laboratory experiments with different simulated targets and experimental arrangements demonstrate very high sensitivities for coherent sources (e.g. -4 6 dB signal-to-clutter ratio for a laser), and high sensitivities for partially coherent sources (-30 dB for light from a monochromator). A system based on a CCD camera, with no moving parts, is also shown to yield high sensitivities. The experimental results compare favourably with most competing techniques reviewed. The performance o f the proposed detection system was also characterised through the calculation o f its Receiver Operating Characteristic (ROC) curves. A laser target with a signal-to-clutter ratio o f -2 6 dB was detected with a probability o f detection o f 90%, and a probability o f false alarm o f 2.10"^.
TABLE OF CONTENTS
1. Introduction... 15
1.1. M otivation... 15
1.2. Aim s...22
1.3. Layout... 23
2. Review of Relevant Optical Detection Techniques...25
2.1. Intensity-based techniques... 26
2.1.1. Introduction... 26
2 .1.2. Single-frame, single-band processing...26
2.1.3. Multiframe processors... 27
2.2. Dual band and multispectral techniques...31
2.2.1. Introduction... 31
2.2.2. Dual band processors... 31
2.2.3. Multispectral processors... 34
2.3. Spectroscopic techniques...39
2.3.1. Introduction... 39
2.3.2. Fourier-transform spectrometers (F T S )... ...i... ... ...i... 39
2.4. Coherence-based techniques... 44
2.4.1. Introduction...44
2.4.2. O.T.I.M ...44
2.4.2.1. Temporal coherence filtering... 45
2.4.2.2. Target location... 48
2.4.2.3. Some concluding remarks about O T IM ... 49
2.4.3. Remote sensing of g a s e s ... 51
2.4.4. Other research works on coherence detection... 54
2.4.5. Optical Coherence Tomography (O C T )... 57
2.5. C onclusion... 59
3. T h eo ry ... 62
3.1. Coherence and interference... 63
3.1.1. Introduction...63
3.1.2. Interfe rence...64
3.1.3. Partial coherence...65
3.1.4. Measures of coherence...6 6 3.1.5. Temporal coherence, spatial coherence and polarisation... 69
3.2. Calculation o f the instantaneous attributes o f a signal...71
3.3. Interferogram phase step shift (IPSS) technique description... 72
th e s is... 72
3.3.3. Novel aspects o f the IPSS technique...74
4. Coherence Length M easurem ents... 80
4.1. Interferogram recording...81
4.2. Coherence length measurements... 90
4.3. A case study o f resonant cavity light emitting diodes (RCLEDs)... 95
4.4. Conclusion ... 101
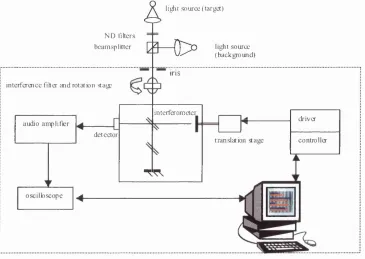
5. Non-Imaging Detection Experiments... 102
5.1. Experiments using a translation stage... 103
5.1.1. Description, alignment and adjustments o f the experimental system ... 103
5.1.2. Measurements of phase step sh ift... 109
5.1.3. Investigation o f the optimum target-to-filter bandwidth ra tio ... 116
5.1.4. Effects o f target to filter wavelength offset...119
5.2. Experiments using piezoelectric transducers...121
5.2.1. Description, alignment and adjustments o f a slow response transducer experimental sy stem ...121
5.2.2. Measurements of phase step shift using the slow response transducer 127 5.2.3. Description, alignment and adjustments o f the fast response transducer experimental system ...129
5.2.4. Measurements o f phase step shift using the fast response transducer... 132
5.3. Conclusions... 134
6. Imaging Detection Experim ents...136
6.1. Description, alignment and adjustments o f the experimental system ...137
6.2. Application o f the IPSS technique to spatial interferogram s... 142
6.3. A coherence-based imaging spectrometer... 148
6.4. Conclusions... 158
7. Algorithm Development and Com parison...161
7.1. Analysis o f the experimental d ata... 162
7.2. Description o f the algorithms investigated... 167
7.2.1. Minimum Amplitude... 168
7.2.2. Maximum Instantaneous Frequency (IPSS)... 169
7.2.2.1. Design o f the software bandpass filte r...170
7.2.2.2. Recovery o f the instantaneous phase and frequency from the interferograms...171
7.2.2.3. Limitations o f the IPSS algorithm ...172
7.4. Comparison with other detection techniques... 188
7.5. C onclusion... 191
8. Modelling and Performance Prediction...192
8.1. Derivation o f the system responsivity using a simplified m o d e l... 193
8.2. Simulation o f the system responsivity using a more complete m odel... 206
8.2.1. Spectral width o f the ta rg e t... 206
8.2.2. Target spectral shape...206
8.2.3. Filter spectral s h a p e ...208
8.2.4. Target-to-filter central wavelength o ffse t... 209
8.2.5. Polarisation... 211
8.2.6. Other aspects... 212
8.2.7. The simulation m odel... 212
8.3. Comparison between modelled and experimental results... 216
8.4. C onclusion... 221
9. Conclusions... 222
9.1. Discussion o f chapter conclusions...223
9.1.1. Chapter one - Introduction ... 223
9.1.2. Chapter two - Review o f relevant detection techniques... 223
9.1.3. Chapter three - Theory...224
9.1.4. Chapter four - Coherence length m easurem ents... 224
9.1.5. Chapter five - Non-imaging detection experim ents... 225
9.1.6. Chapter six - Imaging detection experim ents... 225
9.1.7. Chapter seven - Algorithm development and com parison...226
9.1.8. Chapter eight - Modelling and performance prediction... 227
9.2. Achievements and limitations o f the work described in this thesis... 228
9.3. Advantages and limitations o f the IPSS technique... 230
9.4. W ork to be d o n e ... 235
Appendices Appendix I - Program listin g s... 239
Appendix 2 - List o f signals and images used in the research... 250
Appendix 3 - Movies recorded with the CCD camera (enclosed C D )... 254
Appendix 4 - Conversion o f a gas detection sensitivity in ppm.m to an SCR in d B ... 255
Appendix 5 - Notation o f spectral and coherence variables...256
Appendix 6 - Derivation o f the self-coherence function o f a filtered Lorentzian target and background... 257
LIST OF FIGURES
Chapter 1
Figure 1.1 - Suppressed (a) and unsuppressed (b) helicopter spectral signature...17
Figure 1.2 - Real data showing the blue spike and red wing e ffe c ts... 18
Figure 1.3 - Absorption spectra o f Hb and HbOz in the visible (a) and near infrared (b )...20
Figure 1.4 - FTIR spectrum of D iazepam ... 20
Chapter 2 Figure 2.1 - A typical spatial processing a lg o rith m ... 27
Figure 2.2 - Missile warning algorithm by Montgomery, Sanderson and B axley... 33
Figure 2.3 - Spectro-polarimetric imaging sy stem ...37
Figure 2.4 - Michelson interferometer...40
Figure 2.5 - Temporal coherence filter based on a Fresnel b ip rism ...46
Figure 2.6 - Temporal coherence filter based on a Michelson interferom eter...46
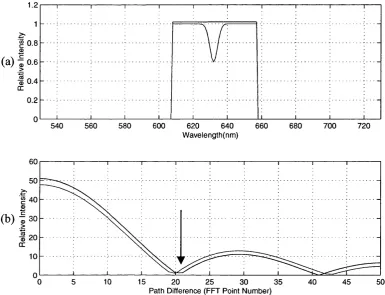
Figure 2.7 - Theoretical fringe intensity p ro file ...47
Figure 2.8 - Phase reticle geometry and its Fourier transform ... 49
Figure 2.9 - Phase reticle FTI at the detector p la n e ... 49
Figure 2.10 - Optical bandwidth reduction due to the interaction o f the illuminating radiation (a) with the absorption band (b )...51
Figure 2.11 - Regions o f the interferogram explored by different coherence-based approaches... 52
Figure 2.12 - Change in the interferogram caused by an absorption lin e ... 53
Figure 2.13 - Temporal coherence processing employing both interferometer outputs... 54
Figure 2.14 - Laser warning receiver principle. FSR is the free spectral range...56
Chapter 3 Figure 3.1 - Self-coherence function o f a flat spectrum transmitted through a rectangular filter response...74
Figure 3.2 - Displacement o f the interferogram m inimum ...75
Figure 3.3 - IPSS main components... 76
Figure 3.4 - A long section o f the IPSS interferogram (a) and its minimum visibility region (b)...78
Chapter 4 Figure 4.1 - White light fringes seen in a screen placed at the exit o f the interferometer...81
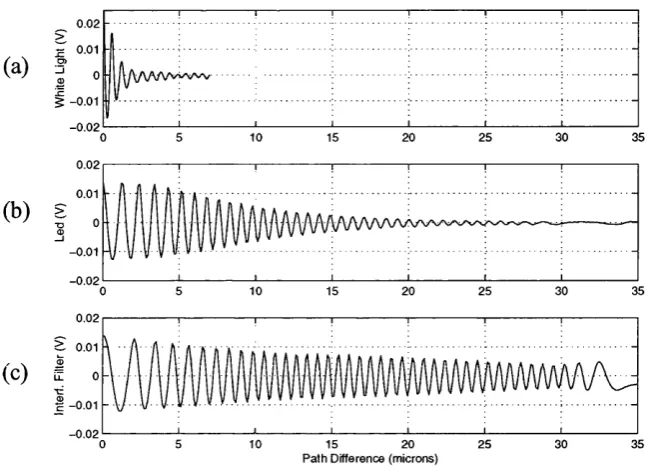
Figure 4.2 - Interferograms from (a) a tungsten halogen bulb,(b) an InGaAlP LED, and (c) an interference filter... 84
Figure 4.5 - Corresponding interferogram amplitude and phase...8 6
Figure 4.6 - Interferogram from a 20 W tungsten halogen lam p...87
Figure 4.7 - Interferogram from an interference filter, mean wavelength 632.8nm, FW HM 1 Inm, measured with a translation stage...8 8 Figure 4.8 - Monochromator interferograms for different slit widths: a) 0.5 mm; b) 1.67 mm; c) 5 mm... 89
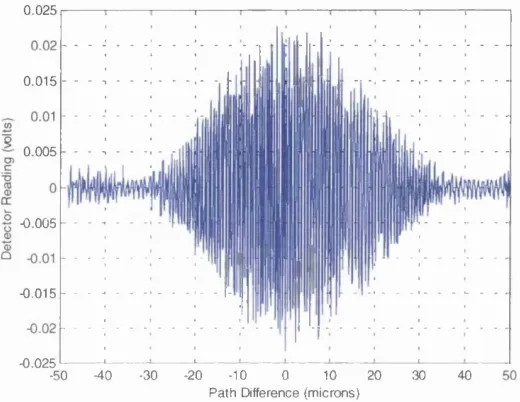
Figure 4.9 - Tungsten halogen bulb interferogram taken with a fast piezoelectric transducer... 89
Figure 4.10 - Interferogram from an interference filter, mean wavelength 651.7 nm, FW HM 36.2 nm, and its filtered envelope...91
Figure 4.11 - Spectra from the tungsten halogen bulb (left), and from an interference filter 91 Figure 4.12 - Variable numerical aperture coherence length measurement system ...96
Figure 4.13 - Lit RCLED image recorded with a CCD c a m e ra ...96
Figure 4.14 - Example o f an interferogram acquired from an R C L E D ... 97
Figure 4.15 - Comparison o f filtered interferograms acquired with the largest (inner curve) and narrowest (outer curve) NA s...99
Figure 4.16 - RCLED coherence length measurement results, using W o lfs equation... 100
Figure 4.17 - Coherence lengths o f artificial light sources... 101
Chapter 5 Figure 5.1 - Basic experimental arrangement employed in this c h a p te r... 103
Figure 5.2 - Experimental arrangement... 105
Figure 5.3 - Typical interferogram (b) and its corresponding trigger signal (a)... 106
Figure 5.4 - Assessment of the repeatability o f the translation sta g e ... 107
Figure 5.5 - Algorithm signal processing tasks... 108
Figure 5.6 - Effect o f averaging on the phase step...109
Figure 5.7 - An example o f an interferogram... 111
Figure 5.8 - Detection o f a He-Ne laser... 112
Figure 5.9 - Detection o f a filtered white light ta rg e t... 112
Figure 5.10 - Detection o f a LED target... 113
Figure 5.11 - Detection o f an RCLED ta rg e t... 114
Figure 5.12 - Correlation between minimum detectable SCR and coherence length o f the source... 115
Figure 5.13 - Bandwidth ratio optimisation experimental arrangement... 117
Figure 5.14 - Detection o f a target with different filters... 118
Figure 5.15 - Responsivity variation with bandwidth ratio... 118
Figure 5.16 - Effect o f target-to-filter central wavelength offset in detection responsivity 120 Figure 5.17 - Beating effect arising from target-filter wavelength offset... 120
Figure 5.19 - Effects o f averaging on the interferogram s... 123
Figure 5.20 - Effects o f analogue amplification and filtering...124
Figure 5.21 - Positioning o f the phase step position within the m irror’s scan... 124
Figure 5.22 - Variation o f phase step position as influenced by drift... 125
Figure 5.23 - Variation o f scan start with tim e...126
Figure 5.24 - Interferogram pairs showing the phase step sh ift...127
Figure 5.25 - Detection o f a He-Ne laser with the slow piezoelectric transducer... 128
Figure 5.26 - Fast piezoelectric transducer arrangement... 129
Figure 5.27 - Fringe format in the fast piezoelectric transducer experiment... 130
Figure 5.28 - Fast piezoelectric transducer drift e ffe c ts...131
Figure 5.29 - Detection o f a He-Ne laser using the fast piezoelectric transducer... 132
Figure 5.30 - Detection o f a monochromator target using the fast piezoelectric transducer 133 Figure 5.31 - Comparison o f laser results using different arrangem ents... 134
Chapter 6 Figure 6.1 - Coherence-based imaging system experimental arrangement...137
Figure 6.2 - Optical beam ray tracing in the CCD arrangem ent... 138
Figure 6,3 - Interference fringes from a 20 W tungsten-halogen lamp, filtered by an interference filter with a FWHM o f 36 nm, central wavelength 651.9 n m ...139
Figure 6.4 - Fringes from the 633 nm spectral line o f a He-Ne laser... 140
Figure 6.5 - Image processing operations applied to the im ag es...141
Figure 6 .6 - Fringes from a monochromator with a central wavelength o f 674.8 nm and a FWHM o f 5 .4 n m ... 142
Figure 6.7 - Above, an image strip containing 60 lines from a tungsten halogen bulb filtered by a 674.8 nm central wavelength, 17.8 nm FW HM interference filter; below, the corresponding instantaneous spatial frequency...143
Figure 6 .8 - Algorithm for recovery o f the phase step from interferogram images...144
Figure 6.9 - Detection o f a monochromator target from spatial interferogram s...145
Figure 6.10 - Fringes from the filtered light o f a tungsten halogen bulb (larger circle) and from the He-Ne laser (smaller circle), and region acquired by the CCD array (rectangle)...146
Figure 6.11 - Detection o f a laser target from spatial interferogram s... 147
Figure 6.12 - Images combining target and background with different SCRs... 149
Figure 6.13 - Image with the same light input as in fig. 6.12, thresholded at 84%... 150
Figure 6.14 - Frame differentiation method, showing the raw image to the left, and the processed image to the right... 152
Figure 6.15 - M odulation caused by a coherent target (blue) and the incoherent background (re d )... 153
Figure 6.17 - Fringe format in the IPSS imaging experiments... 155
Figure 6.18 - Imaging algorithm block diagram ... 155
Figure 6.19 - Interferogram from frames 167-500 without averaging ... 156
Figure 6.20 - Interferogram from frames 167-500 averaging in a 3x3 w in d o w ... 156
Figure 6.21 - Application o f the IPSS algorithm ... 157
Figure 6.22 - Binary image o f the result o f the IPSS algorithm, with a threshold o f 0.85...157
Figure 6.23 - Comparison o f the results obtained using the CCD camera with the results obtained with a translation stage, shown in fig. 5.8... 158
Figure 6.24 - Comparison o f results obtained for a monochromator, using the CCD camera, and the translation stage... 159
Chapter 7 Figure 7.1 - A spectrogram showing the chirping effect due to the non-linearity o f the piezoelectric transducer...163
Figure 7.2 - Power spectrum o f an interferogram acquired with the slow piezoelectric transducer... 164
Figure 7.3 - Power spectrum o f an interferogram acquired with the fast piezoelectric transducer ... 164
Figure 7.4 - Power spectrum o f an interferogram from group 10 acquired with the translation stage... 165
Figure 7.5 - Power spectrum o f an interferogram acquired with the CCD camera, in the spatial (non-imaging) m ode...165
Figure 7.6 - Power spectrum o f an interferogram acquired with the CCD camera, in the temporal (imaging) m ode...166
Figure 7.7 - (a) - filtered amplitude (b) - corresponding interferogram...169
Figure 7.8 - Elliptic filter frequency response amplitude (top) and phase (bottom)...171
Figure 7.9 - Flowchart o f the demodulation module o f the IPSS algorithm ...172
Figure 7.10 - An example o f the application o f the IPSS algorithm... 173
Figure 7.11 - Effect o f translation stage reversal on the formation o f false spikes...174
Figure 7.12 - Effect o f chirping on the detection o f the frequency spike...175
Figure 7.13 - Steps o f the combined IPSS/minimum amplitude algorithm... 176
Figure 7.14 - Steps o f the complex correlation algorithm... 177
Figure 7.15 - Noise alone (left) and noise plus target (right) probability density functions...180
Figure 7.16 - Comparison between the sensitivities obtained with the studied algorithm s... 183
Figure 7.17 - Comparison between the probabilities o f detection obtained with the studied algorithm s...183
Figure 7.18 - Comparison between the logarithmic probabilities o f detection...184
Figure 7.19 - Sensitivity o f the IPSS algorithm... 184
Figure 7.21 - ROC curve logarithmic PD as a function o f PFA ... 185
Figure 7.22 - PD as a function o f SCR...186
Figure 7.23 - Same data as in fig. 7.22, in logarithmic scale...186
Chapter 8 Figure 8.1 - Target and background power spectra...193
Figure 8.2 - The error function, erf(u)... 196
Figure 8.3 - Graphical solution o f eq. 8 .7 ... 197
Figure 8.4 - Graphical interpretation o f rate o f change o f the phase step shift... 199
Figure 8.5 - Variation o f the phase step shift with PR o f a narrow targ e t...199
Figure 8 .6 - Maximum achievable power ratio APR=(a)+(b)... 201
Figure 8.7 - Responsivity Ats/APR as a function o f bandwidth r a tio ... 202
Figure 8 .8 - Responsivity variation with bandwidth ratio for a target with FWHM=7 nm ... 202
Figure 8.9 - 3D plot o f responsivity varying with target bandwidth ranging from 1 to lOnm, and with filter bandwidth, ranging from 1 to 1 OOnm...203
Figure 8.10 - Another 3D view of the same responsivity data displayed in figure 8.9... 204
Figure 8.11 - Complex degree of coherence o f targets and filtered background for different bandwidth ratios. ... 207
Figure 8.12 - Spectral transmission o f the interference filter used in the laser m easurem ents... 208
Figure 8.13 - Coherence functions o f the filtered background (black), Gaussian target (blue) and Lorentzian target (red), for an offset o f half the filter bandw idth... 210
Figure 8.14 - Effect o f target to filter offset in the responsivity for a He-Ne laser...210
Figure 8.15 - Effect o f target to filter offset in the responsivity for the monochromator target used in chapter five...2 1 1 Figure 8.16 - Combined He-Ne laser and filtered background spectrum ...214
Figure 8.17 - Simulation o f the observability cu t-o ff... 215
Figure 8.18 - Comparison between simulation model and experiment o f detection o f a He-Ne laser using the IPSS technique and algorithm...216
Figure 8.19 - Comparison between simulation model and experiment o f detection o f a target made with light filtered by an interference filter, using IP S S ... 217
Figure 8.20 - Comparison between simulation model and experiment o f detection o f a InGaAlP LED using IPSS...218
Figure 8.21 - Comparison between simulation model and experiment o f detection o f an RCLED using IPSS... 219
Figure 8.22 - Comparison between bandwidth optimisation theory and experim ents... 220
Figure 8.23 - Comparison between central wavelength offset theory and experiments...220
LIST OF TABLES
Chapter 2
Table 2.1 - Detection figures o f various approaches... 60 Chapter 4
Table 4.1 - Coherence lengths o f various sources, ordered by coherence length
given by eq. 3 .3 ... 92 Chapter 5
Table 5.1 - Summary o f results from detection experiments, ordered by displacem ent... 115 Table 5.2. Target/filter combinations: all wavelengths and bandwidths in n m ...117 Chapter 6
Table 6.1 - Imaging experiments results sum m ary... 160 Chapter 7
LIST OF ABBREVIATIONS
A/D - Analogue-to-digital AGC - Automatic gain control
BLIP - Background-limited performance sensor CCD - Charge coupled device
CCIR - Consultative Committee for International Radio CLO - Counter low observable
CW - Continuous wave
DBR - Distributed Bragg reflection DICE - Detection in clutter enhancement DKLT - Discrete Karhunen-Loève transform FFT - Fast Fourier transform
FIR - Finite impulse response (filter) FLIR - Forward-looking infrared FOV - Field o f view
fps - Frame per second FT - Fourier transform FTI - Fourier transform image
FTIR - Fourier transform infrared (spectrometer) FTS - Fourier transform spectroscopy
FW HM - Full width half-maximum
GAP/AN - Glycidyl azide polymer and ammonium nitrate GFLOPS - Giga-floating point operations per second GOPS - Giga-operations per second
IC - Imperial College
IFOV - Instantaneous filed o f view HR - Infinite impulse response (filter) IPSS - Interferogram phase step shift IRST - Infrared search and track LED - Light-emitting diode LO - Low observable LOS - Line-of-sight
M BPS - Megabits per second MCT - Mercury-cadmium telluride
M DSCR - Minimum detectable signal-to-clutter ratio ML ANS - Maximum likelihood adaptive neural system MRC - Minimum resolvable contrast
MW IR - Medium wave infrared (band) NA - Numerical aperture
NECL - Noise-equivalent concentration-path length NESR - Noise-equivalent spectral radiance
NETD - Noise-equivalent temperature difference NUC - Non-uniformity correction
OCDR - Optical coherence domain reflectometry OCT - Optical coherence tomography
OTIM - Optical transform image modulation PAT - Pointing, acquisition and tracking PEL - Phase-locked loop
PPM - Pulse position modulation PR - Power ratio
PSD - Power spectral density PWM - Pulse width modulation
RCLED - Resonant-cavity light-emitting diode RIN - Relative intensity noise
RMS - Root-mean square
ROC - Receiver operating characteristic SCR - Signal-to-clutter ratio
SETS - Static Fourier transform spectrometer SIMD - Single instruction, multiple data (computer) SMF - Spectrally matched filter
SNR - Signal-to-noise ratio TBD - Traek-before-detect
Chapter 1
Introduction
1.1. Motivation
The most demanding imaging or detection applications o f optical techniques are those in which a dim object, weak signal or emission must be located within a scenario o f a bright, stronger background. A few examples o f this situation are the detection o f a tumour in living tissue, o f a distant missile in intense daylight, or o f a gas in the atmosphere. For the sake o f standardisation, in this thesis the object, signal, emission or absorption to be detected is termed target, while the radiation coming from the scene is termed background. Currently, the majority o f the detection or imaging systems employed in these tasks rely on measuring the intensity contrast between the radiation levels received from target and background. Depending on the optical band, different physical mechanisms dominate the radiation received by the detection system. In the visible band, for example, the contrast between light emitted or reflected by the objects in the scene is measured, while in the infrared, the irradiance o f these objects dominates. In the former case, reflectivity differences may be important, and in the latter, temperature and emissivity contrast affect target detectability.
In order to face the challenging tasks described, technology evolved in the direction o f increasing the sensitivity o f the detection systems. The definition o f sensitivity used in the thesis
is '‘‘‘the minimum pow er required to achieve a specified quality ofperform ance in terms o f output
signal-to-noise ratio or other measure’’’ [Bod91]. The terms minimum resolvable contrast
degrades the performance o f imaging systems most severely. Consequently, the weakness o f intensity-based systems is the performance in cluttered environments [MoyOO].
The dead end just mentioned will not be reached, however, if new dimensions are incorporated to imaging and detection technologies [McC96]. The increase in clutter spatial structure can be used favourably if one records this structure in several different spectral bands, and correlates the acquired images. The additional information contained in the received electromagnetic wave, such as spectrum, polarisation or coherence, is irreversibly destroyed in the intensity detection process. The use o f this information before detection allows performance improvement, even in presence o f clutter. In fact, techniques employing these domains have been increasingly used in different fields, and some o f them are reviewed in Chapter two.
M ost detection approaches based on coherence were invented in the 1970s (for example, [Fre72]), and so far have not been widely explored. The term coherence is explained in detail in chapter two, but, in brief, it is the reciprocal o f the optical bandwidth. Therefore, techniques relying on coherence can be used to detect targets that present a high degree o f coherence (full definition given in chapter three) or that have a narrow optical bandwidth. Man-made targets displaying a high degree of coherence are, for example, lasers and arc lamps. In general, natural objects tend to behave like blackbodies, emitting or reflecting low coherence radiation. However, radiation theory states that rotational and vibrational modes o f atoms and molecules produce spectrally selective radiation [Hud69]. The atoms and molecules absorb radiation, vibrate and rotate at frequencies that are a characteristic o f the material, and re-radiate electromagnetic waves. These phenomena produce narrow spikes in the emission or absorption spectra o f the corresponding materials, which may appear isolated or in bands o f spikes. An approach based on coherence, though, may be used to detect man-made or natural targets, provided that they display, in a limited region o f their spectra, a narrow spectral spike. In other words, anything that has a narrowband feature in its spectrum is a candidate target for such techniques. A brief list of applications o f coherence-based approaches follows, with intent to demonstrate the relevance o f the use o f coherence.
techniques have been widely explored, and the counter-low observables (CLO) m easure against it was the use o f infrared sensors, which allowed discrim ination based on tem perature and em issivity differences between target and background.
In the infrared band, the principal sensor installed on defence platform s is the Infrared Search and Track (IRST), which acquires and detects a target based on irradiance differences, mainly
through the location o f hot spots on its surface. In this band, stealth techniques aim to em bed the target in its background, and to avoid the formation o f these hot spots by distributing the unavoidable sources o f heat across the platform. F urther measures to reduce the tem perature contrast o f aircraft and m issiles are the cooling o f exhaust gases through m ixing with cold air, the use o f tlam eless, low temperature propellants [Rap02] and, for ships, sprinkling seaw ater on
the ship’s superstructure [Nee02]. An exam ple o f infrared signature reduction is shown in fig. 1.1, taken from [Zis93]. The figure shows the spectral signature o f a helicopter at tail aspect, the upper curve being the unsuppressed curve, and the lower curve the suppressed, displaying an intensity level about ten to fifteen times lower. A sensor exploring the target’s radiom etric signature (total energy irradiated within the sensor’s bandw idth) will not be able to discrim inate between the suppressed helicopter and the background. This low-contrast situation may happen with unsuppressed targets as well, during twilight, as thermal contrast displays cyclic variations throughout the day [M ou02], and these times o f the day represent the points o f crossover between positive and negative contrast.
2S0
2 0 0
too
S O
2 . S 3 . 0 3 . S 4 .0
Wavelength (pm)
Figure 1.1 - Suppressed (a) and unsuppressed (b) helicopter spectral signature (from |Zis93|)
A coherence-based detection system may be used to ensure and even improve the probability o f detection, in spite o f any target radiom etric signature reduction measures. In fact, and for
example, fig. 1.1 displays a spectral spike at 4.25 pm in both suppressed and unsuppressed
by colder CO2 in the atm osphere. As this atm ospheric gas is at am bient tem perature, this absorption suffers no D oppler spreading, having a narrow er band than the emission, hence creating two sidebands which are generated by the hot gas, and not absorbed by the cold gas. By analogy with the visible colours, the band towards sm aller wavelengths was named the blue spike, while the one with longer wavelength was called the red spike or wing. It can also be seen
in fig. 1.1 that the reduction o f the total energy irradiated further increases the spectral contrast between the blue spike and the background continuum. It is reasonable to think that this increased contrast will also happen when the target is on nose aspect, its body blocking the main portion o f the radiation, that is, the blackbody-like spectral continuum , unlike the blue spike, which would propagate "‘‘with much less a tten u a tio n ’’ [Zis93]. This difference between target and background attenuation would, then, represent an im provem ent in signal-to-clutter ratio
(SCR).
Real data acquired from the exhaust o f a Rolls Royce Spey engine on a test bench placed at 8.6 m from the recording instrum ent, a Broker IPS 66 FTIR spectrom eter with a spectral resolution
o f 0 .1 1 cm ', is shown in fig. 1.2. It shows the blue spike at 4.18 pm , with a full-width half
maximum (FW H M ) o f approxim ately 30 nm, and an estim ated coherence length o f 0.6 mm. As will be shown in chapter 8, this spike is perfectly suitable for detection by coherence-based approaches. In fig. 1.2, the red wing can be seen with a band o f spikes superim posed, which do not appear in fig. 1.1 due to its lower resolution. The data was kindly provided by Nick Davies, from the Centre for Optical and Environm ental M etrology, National Physical Laboratory.
4.1 5 4 2 4 2 5 4 3 4 35 4.4 5 4 .5 4.5 5 W avelength (m icrons)
Figure 1.2 - Real data showing the blue spike and red wing effects (from Nick Davies - NPL)
Further narrow spectral features can be found on plum es o f je t propelled vehicles. Rapanotti and others [Rap02] have recently published a study on the influence o f the chem istry o f rocket plumes on their infrared signature. One o f the conclusions o f the study points to the reduction in
the detectability o f these targets, using intensity-based infrared sensors, through the use o f flameless, low temperature propellants, especially glycidyl azide polymer and ammonium nitrate (GAP/AN). The conclusion is not valid, however, if a coherence sensor is employed. The paper shows that the radiometric-reduced signature contains spectral spikes due to elements not found in the natural atmosphere, once again making rockets using these propellants suitable targets for coherence-based sensors.
It is clear from the previous paragraphs that sensors utilising coherence as a discriminator are suitable for IRST systems, as well as for missile seekers. The author believes, as will be shown in later chapters, that the approach studied in this thesis possesses high sensitivity, making it suitable for target acquisition applications, possibly requiring a handover to conventional sensors as the target closes in, due to its limited dynamic range. Finally, yet one more application for these techniques would be in laser-warning receivers, due to the high degree o f coherence o f these light sources.
The second application envisaged for coherence-based sensors is the remote sensing o f gases, which has already been explored by French [Fre84A] and by Drum [Dru90] in his doctoral thesis, reviewed in chapter two. Contaminant gases like CO, N2O (used in D rum ’s measurements), CO2, H2CO, N2H3CH3 and CH4 all display selective absorption, forming spectral spikes in the infrared. The range o f hydrocarbons found in flammable gases absorbs radiation in bands near 3.3 pm, carbon monoxide at 4.7 pm , nitric oxide at 5.3 pm, and so on. As happens with other spectroscopic techniques employed to detect gases, care must be taken when choosing the spectral region where the sensor is designed to operate. The designer must choose a spectral line, or a small set o f lines, away from bands caused by interfering gases, o f which the most common is water vapour, whose spectrum spreads widely in the infrared [Hud69].
Another application for sensors exploiting coherence is the detection or imaging o f biological specimens. Fig. 1.3 displays the spectrum o f deoxyhaemoglobin (Hb) and oxygenated haemoglobin (Hb0 2), in the visible band (left) and near infrared (right), obtained from the web site o f the Biomedical Optics Research Group, Department o f Medical Physics and Bioengineering, University College London [ElwOO]. Hb is found in venous, deoxygenated blood, while Hb0 2 is found in arterial blood, after oxygenation by the lungs. The higher absorption coefficient o f Hb0 2 in blue wavelengths explains the reddish colour o f arterial blood, as well as the blue-like colour o f venous blood. In the visible band, the author believes, coherence-based approaches could be used to detect and measure the concentration o f H b0 2
assessment o f the feature’s coherence length. By measuring the HbOz concentration, the blood oxygen level may be determined. Besides real time monitoring o f this level, the measurement o f blood oxygen level may find application in cancer detection and therapy. Carcinoma cells show higher blood concentrations than normal cells, with stronger absorption in the 500 - 600 nm region [Pet90]. Additionally, the level o f oxygen in a tumour affects its resistance to treatment with X-rays, and the treatment has a higher probability o f success when this concentration reaches a maximum [OLE98].
0.08 I 0 07 ^ 0.06
“ — HbO. 0.05
0 0 4 S 0.03
I 0.02
0,01
0.00
SCO GOO 700 000 900 1000
00Û4O
§ 00020 Hb
V /
00000
850 700 750 800 850 900 950 tOOO WHvetangih (nm)
W*v»iengib (nm)
Figure 1.3 - Absorption spectra o f Hb and HbOz in the visible (a) and near infrared (b)
Forensic science may be another application o f coherence-based techniques, in the author’s opinion. Fig. 1.4 displays a spectrum o f Diazepam measured with an FTIR spectrometer, where a spectral peak free o f interfering features is seen at approximately 5.8 pm. The data was kindly offered by the Brazilian Army Research Institute.
Z ' (/)
c
c
g 0,4
o 0-3
C 0 72 3 4 5 6 7 8 9 10
wavelength (microns)
Yet another interesting application o f coherence detection is inter-satellite communications. Constellations o f communications or data relay satellites allow the realisation o f world-wide networks with increased coverage and very wide bandwidth, for both commercial and military applications. A remarkable example is the real time transmission o f imagery from the French SPOT-4 earth observation satellite to the European Artemis communications satellite, which relays the data to a ground station. The first successful transmission occurred in November 2001, with a data rate o f 50 M BPS [ESAOl]. As the beamwidth o f the communications beam (~
8 prad at 0.83 pm) is much smaller than the RMS pointing error, pointing, acquisition and tracking (PAT) o f the beam from one satellite to the other is a critical task [Tol98]. Currently, a high power laser beacon and two CCD cameras, one for acquisition, another for tracking, have to be employed to derive the error signals for the closed loop pointing system [Bai94]. It is believed that if a coherence-based approach is used, given the very high sensitivities demonstrated later in this thesis for the detection o f a laser, a dedicated laser beacon would no longer be required, and a single laser beam could be employed both for PAT and communications.
The last application o f the list o f envisaged uses o f coherence-based techniques in detection or imaging, related to the previous one, is the location and mapping o f dim star positions at night for astronomy, or even comets. These celestial bodies possess chemical components that irradiate spectral spikes at selected wavelengths, having characteristic spectral signatures that are already used by conventional spectroscopic methods to identify them.
1.2. Aims
The main aim o f the research described in this thesis is to study, for the first time, an optical detection technique that uses the displacement o f a phase step in an interferogram to detect a coherent emission or absorption in an incoherent background. In order to achieve this aim, the principal aims are:
I. To implement, in the laboratory, an optical detection system based on an interferometer to record the interferograms required by the study, using both existing and new designs;
II. To develop, optimise and test a method to determine the location o f the phase step in the interferogram, and to demonstrate its effectiveness by comparison with other methods;
III. To derive a theory capable o f predicting the displacement o f the phase step as a function o f target strength, for both coherent and partially coherent targets;
IV. To investigate the centre wavelength position and the bandwidth for the initial band pass filter for detection optimisation, and for a reasonable variety o f targets;
V. To assess the sensitivity o f the detection system developed by constructing its Receiver Operating Characteristic (ROC) curves;
VI. To compare the performance o f the system developed with the performance o f existing optical detection systems.
Additional aims are:
• To characterise the light sources used in the experiments, through measurements o f coherence length;
1.3. Layout
The thesis is organised in nine chapters. New material is presented from section 3.3 onwards. Chapter two presents a review of optical detection techniques usually employed in the detection o f dim targets in highly cluttered backgrounds, based either on intensity, spectrum or coherence. Chapter three reviews, in the first two sections, the theoretical background required for proper understanding o f the Interferogram Phase Step Shift (IPSS) technique. This theory is not new, but is included to support the advanced theory presented in chapters seven and eight. Section 3.3 describes the high level concepts o f the IPSS technique, without detailing the new algorithm invented by the author, which is done in chapter seven. In chapter four a slight deviation o f the principal aims o f the thesis is allowed, to study the temporal coherence properties o f the partially coherent light sources used in later experiments, through measurements o f coherence length performed by recording long interferograms, similarly to what is done in Fourier transform spectroscopy (FTS). Interesting work on the characterisation o f Resonant-Cavity LEDs produced at Imperial College is also presented there, which led to a published joint paper [Cou02].
Chapter five is the main experimental chapter o f the thesis. It describes the experiments to detect coherent and partially coherent light sources using interferograms generated in the temporal domain. Three experimental arrangements are included, two using piezoelectric transducers, and one using a translation stage. The results, which depend on the algorithm used to retrieve the phase step (described in chapter seven), are depicted in this chapter. Additionally, the effects o f the variation o f the target-to-filter bandwidth ratio and central wavelength offset are assessed experimentally here. Chapter six, after displaying images o f the interferograms acquired using a CCD camera, repeats some o f the experiments o f chapter five, this time producing interferograms in the spatial domain. In order to allow proper performance comparison, the chapter also includes the replication o f imaging experiments from previous workers. A novel demonstration o f coherence imaging using IPSS is included as well.
Chapter 2
Review of Relevant Optical Detection Techniques
2.1. Intensity-based techniques
2.1.1. Introduction
The task o f detecting a target embedded in a natural or man-made background is usually carried out using the spatial distribution o f the intensity collected by each pixel in an imaging array as a discriminator. This is applicable both to visible and infrared wavelengths. In the visible band, detection and tracking are performed using the brightness contrast, which is a consequence o f the different reflectivities o f materials in that band. In this chapter, we will concentrate our review in the infrared. In this band, the intensity contrast appears as a combination o f different temperatures and emissivities o f the various objects in a scene, leading to the collection o f different irradiances by different elements in the imaging array. The mechanisms o f thermal radiative transfer and image formation are outside the scope o f this thesis, and can be found in many textbooks [Zis93] [Hud69]. The most common infrared detection equipment to date are called FLIR (Forward-Looking Infrared) and IRST (Infrared Search and Track). The differences between them are well established in the literature [Cam93]. While FLIR is mostly concerned with forming and displaying an image, mainly for navigational purposes, IRST, as the name says, detects and tracks targets from the array o f intensities, not necessarily forming an image. IRST systems can be employed either from the ground, ships or aircraft. They usually have a relatively small vertical coverage angle, not more than ten degrees, and scan 360° horizontally [Cam93]. In ships, their most important application is the detection o f sea-skimming missiles, in addition to fire control radars, which suffer from fading effects due to multipath reflections at the sea surface [Cam93]. As IRST is mostly concerned with detection, while FLIR is with imaging, this section will concentrate in the former, describing some o f its detection algorithms.
2.1.2. Single-frame, single-band processing
the variability o f the clutter statistics across the field o f view, one can think o f a spatially adaptive threshold, after local estimations of clutter variance are performed in sub-regions o f the image. For the same reasons, it is advantageous to apply this “local processing” concept to the spatial filtering as well. If we account for the detector array non-uniformities in responsivity and fixed pattern noise, a non-uniformity correction (NUC) has to be applied before spatial filtering. This algorithm is named “background normalisation” [BaxOO], as it accounts, at least in theory, for the spatial variations o f the background.
NUC
raw image
candidates local statistics
spatial filter threshold
local statistics
Fig. 2.1 - A typical spatial processing algorithm [BaxOO]
2.1.3. Multiframe processors
adaptive, non-linear, spatial-temporal filter. The coefficients o f this filter are adaptively calculated using background parameter estimation. Using this algorithm and simulated data, the authors claim to have obtained a clutter rejection o f 16.5 dB, in comparison with 6.2 dB obtained with spatial filtering only.
In a typical spatial-temporal approach, the pixels above the threshold, consequently detected, are registered in sequential frames to form a target track, using algorithms that are outside the scope o f this thesis. These techniques are affected by rapid temporal variations caused by sun glint and aircraft motion [Pel97], and cannot cope with signal-to-noise ratios below 10 dB [Bra96]. W hen detection is declared via thresholding, the statistical information about that particular candidate is neglected, as the processor has to look for a next point to form the target track. A more efficient way o f using the available information is to keep data about target positions and velocities stored before thresholding, declaring detection only after a num ber o f frames is processed and a track is formed. This set o f techniques is named Track-Before-Detect (TBD) [Wei95] [Ton96] [Mer97], made possible by the continuous increase in computing power, and representing the current state o f the art in multiframe, single band target detection. A good review o f early work in these techniques is given by Tonissen and Evans [Ton96]. In TBD a data cube is formed with one temporal and two spatial dimensions, to be processed by three- dimensional matched filters or dynamic programming algorithms. In the latter case [Ton96], the tracking problem (solved before the detection problem) is modelled as a state-space three- dimensional matrix where, from the current position o f the target, the algorithm searches over all possible state sequences, returning the best sequence according to a merit function, or, alternatively, all the sequences exceeding a given threshold. The probabilities o f detection and false alarm are determined by this threshold as usual, but processing gains arise from the integration o f target energy throughout successive frames.
company published further work on this algorithm later [Mer97], where 34 frames in real data had to be integrated to declare the presence o f an FI Mirage aircraft in the image sequence. This long integration time (more than a second in typical 25 Hz imagers) not only represents a considerable reduction in the sensor update rate, but also gives an idea o f the amount o f required computing power to implement this sort o f algorithm in real time. Wei, Zeidler and Ku [Wei95] maintain that state estimation approaches are not suitable for image processing, due to the amount o f computing power required. In this work they also show that, for TBD to have better performance than single-frame techniques, a minimum SNR is required that depends on target velocity. This SNR is presented as being -3 .7 dB for a velocity o f 1 pixel/frame, and 2.2 dB for 2 pixels/frame. The stated numbers do not mean that targets will be detected at these SNR, but rather that, below these, the computing burden o f TBD is imacceptable. This work [Wei95] mentions that a common operating point for electro-optical sensors would be a probability o f detection o f 0.9, and a probability o f false alarm o f 0.1. Using their model, they calculate that a single frame detection system would require a SNR o f 8.2 dB to achieve these probabilities, and the integration o f 4 frames at a velocity o f 1 pixel/frame would require 6 dB to do the same.
More recently, Tartarovsky, Kligys and Petrov [Tar99] have recast the moving target detection problem as an abrupt change in the image pixel probabilistic distribution. They defend that current Bayesian or likelihood ratio detection techniques are not suitable for multitarget tracking, because they ignore the event o f target disappearance. The paper proposes a sequential detection algorithm, in which a decision about target presence is made at each frame update. The hypothesis test is composed o f three hypotheses: the target did not appear, appeared and is still present, or appeared and disappeared. The algorithm includes the optimisation o f detection time delay, constrained by the probability o f false alarm, and its detection statistics uses the estimates o f target spatial location, based on optimal spatial-temporal nonlinear filtering. It is claimed that a simulated target with SNR = -6.6 dB was detected in real IR backgrounds, with a probability o f false alarm o f 1/60, after integration o f 20 frames, leading to an output SNR o f 4 dB. Although no statement about target velocity is made, this result appears better than the input SNR limit stated by Wei, Zeidler and Ku [Wei95]. This is also the lowest SNR detected by an intensity-based system, although with a penalty o f a 20 second time delay.
dimensionality (i.e., temporal, spectral or both) into the solution”. TBD has been using the temporal domain, whilst multispectral techniques have introduced the use o f the spectrum. The first o f the three proposed solutions involved a spatial-temporal approach consisting o f electronic frame stabilisation, adaptive spatial filtering and adaptive, multi frame temporal filtering, but the project [McC96] was terminated before completion. The second solution was the cascade o f a velocity filter and a fuzzy, Bayesian system called MLANS (Maximum Likelihood Adaptive Neural System). The first stage is a clutter removal algorithm, based on a three-dimensional filter, whilst MLANS is, once more, a state estimation machine. The only results mentioned were the achievement o f the requirements, not referring to SNR. The third approach described in the paper adapts an existing morphology-based non-linear signal processing technique named Geometric W hitening Filter to dual-band data, and will be described in the next section.
2 .2 . D u a l b a n d a n d m u ltisp e ctra l tec h n iq u e s
2.2.1. Introduction
As mentioned in the first chapter o f this thesis, the differences in spectral emissivity and temperature between targets and backgrounds make the use o f more than one spectral band very attractive for use in detection systems, as a background suppressing technique. M ultispectral techniques applied to detection came from the field o f remote sensing, where they find use in atmospheric and geological studies. These techniques do not suffer from registration problems as much as spatial-temporal approaches do, although, on the other hand, some processing effort has to be spent on the removal o f the effects o f temperature [Cam93]. The most common approach is to treat the problem as a decision between multiple hypotheses, applying likelihood ratio criteria.
2.2.2. Dual band processors
The U.S. Air Force’s W right Laboratory has produced extensive research on the characteristics o f missile signatures [San96][Mon96], in order to obtain an effective missile-warning sensor, capable o f operating under heavy clutter conditions. With this characterisation data in hand, a study on dual-band algorithm comparison was performed [BaxOO], and the best algorithm received further development [MonOO]. Baxley, Sanderson, Montgomery and M cCalmont [BaxOO] compared three single-frame algorithms: simple thresholding, taken as baseline and discussed in section 2.1, background normalisation (previously discussed as well) and two- colour correlated background, which is a linear background estimation model, reviewed previously [Pel97]. The conclusion o f this study is that the simple threshold only works well in areas without structured clutter, the correlated background approach offers an intermediate performance, and, not surprisingly, the dual band algorithm gives the best performance. The former had higher probabilities o f detection, when plotted against time, for a real IR sequence o f 80000 frames. An interesting algorithm comparison plot is a scattergram where the probabilities o f detection o f the two algorithms being compared are plotted one against the other, for the same probabilities o f false alarm and SNR. In a plot where the abscissa axis is either simple threshold or correlated background, and the dual band algorithm is in the ordinate axis, the sample points lie above the line crossing the origin at 45°, demonstrating its better performance.
NUC blue
channel red channel
input NUC
Spatial Filter
Spectra] Filter Frame
Registration Frame Registration
Spatial Filter
Threat Declaration
Fig. 2.2 - M issile warning algorithm by M ontgom ery, Sanderson and Baxley [MonOO]
The spectral discrimination is achieved exploring the target-to-background signature contrast in two bands: 3.52-4.03 |um and 4.57-4.71 pm, and works similarly to the work by Peli [Pel97], but employing a ratio rather than a subtraction between the intensities in the two bands. The ratio data is then thresholded to be handed to the last stage. It is claimed that this spectral filter works with the high-intensity values (outliers) in the background distribution, where most o f the false detections occur. The final stage in the processing chain is threat declaration. Even with four-dimensional discrimination (two-dimensional spatial, temporal and spectral), temporally correlated noise coming from electronics and other incidental targets still degrades the performance. This stage is implemented as a Kalman filter [Ope89], which receives information from the platform itself and target motion, and forms tracks with the detections from the previous stage. This module was still under development by the authors at the time of publishing.
The algorithm is computationally very intensive. It requires in between 1500 and 3500 operations per pixel excluding the threat declaration stage; around 100,000 clock cycles per frame, some 16.10^ clock cycles/sec. W ith this processor power, up to 28 targets can be passed to the platform countermeasures system. Results are presented from real missile firings, with platforms at helicopter speed travelling at 7500 ft altitude. No absolute input SNR is given, but the algorithm is capable o f raising the normalised raw image SNR by 11.2 dB. Incorporating into this figure o f merit the reduction in false positives, a claim o f a total SNR gain o f 52 dB is made, although the gain calculation method is not clear.
considered. This procedure requires some sophisticated processing, as argued by Hilliard [HilOO], who developed a special code especially for target insertion.
2.2.3. Multispectral processors
In situations where thermal contrast is poor and target signatures are not easily discernible using dual band techniques, more than two spectral bands may be used to increase target discrimination against backgrounds. Multispectral techniques [Cam93] are widely used in remote sensing and defence applications. Their aim is to increase target detectability through exploration o f differences in spectral emissivity, rather than temperature. Vibrational and rotational oscillations o f molecules in the atmosphere, soil, vegetation and man-made objects create absorption and re-emission features that characterise these bodies as selective radiators [Hud69]. The combined effects o f these features with the blackbody emission characteristics o f objects at different temperatures generate spectral signatures that allow discrimination in wider wavelength bands than it is achievable with two bands only.
Cheung and others [Che97] present the multispectral detection problem more rigorously, as a composite hypothesis-testing problem with:
H o : X —
-t-FbN ^ ) _
versus Hi: x =
5 , 1 ( f , r ) W i "
where x = [x, x ^ Y is the vector o f energies observed in each one o f the N bands, s is the energy component in each band, with subscript b for background and t for target, € is the emissivity, T is the temperature, and w is the noise o f the detection system in each band. A target, when it exists, is assumed to fill a whole pixel. Under the assumptions that the multispectral signal and the noise are normally distributed, a sufficient test statistic [Van68] is generated by calculating the difference between a target-absent and a target-present statistic, represented by a spectrally matched filter (SMF). This difference is then compared to a threshold to declare detection, being the receiver performance defined by the threshold level. The SMF concept is widely used in multispectral processing [Che97] [Sch96] [Sin98] [Sin99] [SinOO] [ShnOO], and is an extension o f the standard matched filter [McD98] to a multiband system. It can be represented by:
F = X .C ' , where F is the filter row vector, with one coefficient for each band, C
is the background covariance matrix, and X is the transposed input vector s in eq.2.1.
W ithout detailing the mathematical formalism, which is outside the scope o f this thesis, Cheung and the co-authors claimed, based on simulations with greyscale images, that this approach suppresses clutter and whitens the multispectral data for thresholding, although no detection performance figures are given.
A problem with hypothesis-testing-based multispectral processing is the difficulty in separating emissivity from temperature contributions to the detected radiance value. If the receiver is to operate on differences in emissivity across different bands, the effect o f different objects having different temperatures has to be accounted for in the detection process. Many workers did recognise this issue [Che97] [Lju97]. Cheung and others [Che97] point out that inaccuracies in temperature estimation may lead to severe losses in detection performance. Ljungberg and others [Lju97] used a temperature calibration procedure.
spectral signatures are affected by the environment and, thus, may not be known, instead o f comparing the measured signature with a spectral reference a statistical test is performed to determine if this signature is sufficiently different from the background’s signature. The detection system is, thence, composed o f a matched filter rejecting clutter, and a spectral anomaly detector designed to circumvent losses caused by lack o f a priori knowledge. One o f their findings is that, from two bands onwards, additional bands do not increase the signal-to- clutter ratio (SCR), but do increase the false alarm rate. This is due to the increase in the number o f false spectral features detected by the anomaly detector, as more bands are included. Using the track features concept [Sin99], the algorithm without a priori knowledge o f target spectrum presents the same performance as an algorithm that uses such knowledge, the authors claim. The track features concept is similar to TBD, as additional information about the target, such as the log-likelihood ratio [Van68], is retained after use by the anomaly detector in order to form a spectral information track. In [Sin98], six bands from 8.2 to 11.2 pm are employed, the narrowest ones encompassing 400 nm. SCR gains o f 15.5 dB, in opposition to 12.3 dB obtained by single-band, spatial-temporal processing, are referenced. ROC curves are presented, which will be used for comparison purposes in chapter seven.
A last example o f multispectral approaches was presented by Shnitser and others [ShnOO], and illustrates the use o f other properties o f light in target contrast enhancement. The development combined multispectral with polarisation discrimination, doubling the number o f bands in the multispectral system without increasing system noise. The embodiment, depicted in figure 2.3, is based in software-controlled acousto-optic tuneable filter and liquid crystal achromatic rotator, and generated non-video rate imagery (4 frames per second). Images are recorded in a CCD camera and digitised in a frame grabber. A PC controls the digitiser and the optical device drivers.
polarisation rotator objective
lens C C D
driver driver grabberfram e
A O T F output
optics
com puter
Fig. 2.3 - Spectro-poiarimetric imaging system [ShnOO]. Thick lines indicate the light path.
detection system. Once more, the penalty is the large volume o f data generated, requiring heavy processing resources. Another interesting feature is the use o f pre-detector optical processing, which is also explored in IPSS.
2.3 . S p e c tro sco p ic tech n iq u es
2.3.1. Introduction
In this section, we depart from the field o f detection techniques to the one o f spectroscopy. In the former, the emphasis is on creating algorithms capable o f combining characteristics o f the target in a small set o f wide bands, to enhance its detectability. In the latter, the number o f bands and their resolution is increased, but the m ain interest is in measuring an object’s spectral signature, either with research purposes or to support the detection studies. As a consequence o f this different emphasis, few researchers present sensitivity measures o f their spectroscopic approaches, but rather the spectra they have obtained.
The instruments that make use o f the spectral dimension were classified by Breckinridge [Bre96] according to the fractional bandwidth o f the individual bands (AX/X) into multispectral, when this ratio is about 0.1, hyperspectral, when it is about 0.01, or ultraspectral, when it is about 0.001. The first type was discussed in the last section, the second and third are discussed here. The term imaging spectrometers is used throughout the text, denominating instruments capable o f obtaining data which is both spectrally and spatially resolved [Wol97], and which were the result o f the addition of imaging capability to existing spectrometric techniques. Multispectral and hyperspectral instruments can be implemented with filtering techniques, either by rotating filter wheels [Lju97] or using tuneable filters [Mar99]. The very high resolution required in ultraspectral instruments can be achieved through dispersive spectrometers using prisms or gratings, or through Fourier-transform spectrometers. Because o f their relevance as one o f the foundations o f the IPSS approach, only Fourier-transform spectrometers are discussed in this review. On the subject o f imaging spectrometers in general, the interested reader is referred to review papers such as the ones by Persky [Per95] or Goetz [Goe95].
2.3.2. Fourier-transform spectrometers (FTS)
century (1948-1951) that Fellgett obtained what were probably the first spectra derived by Fourier transformation [Fel84], calculated manually. FTS became widely used only after computing resources were widespread, and, most importantly, after the invention o f the Fast Fourier Transform (FFT) algorithm by Cooley and Tukey in 1965.
In spectroscopy o f electromagnetic waves in the optical part o f the spectrum, the principal device used to measure the autocorrelation function, or the self-coherence function in the optical jargon, is the Michelson Interferometer [Bor99] [Hec98], depicted in figure 2.4.
scanning mirror
light source
detector
Fig, 2.4 - M ichelson interferom eter

![Figure 2.7 - Theoretical fringe intensity profile (sinusoid exaggerated) [Sut82]](https://thumb-us.123doks.com/thumbv2/123dok_us/8224642.1373513/48.595.141.430.454.660/figure-theoretical-fringe-intensity-profile-sinusoid-exaggerated-sut.webp)