Design of Sensor System for Detection of Heat
Generated from Transformer
Gurpreet Kaur1, Neha Gupta2
M.Tech. Student, Dept. of Electrical Engineering, Sri SAI College of Engineering, Pathankot, India1
Assistant Professor, Dept. of Electrical Engineering, Sri SAI College of Engineering, Pathankot, India2
ABSTRACT:A network of electrical components which is used to supply, transmit and use electric power is known as an electrical power system. Load variations affect the working of transformer. Load variations due to increasing demand of power generates heat in the transformer, which affects the overall efficiency and life of transformer. Heat is generated in transformer due to different types of losses i.e., load losses and no load losses. These losses then converted in the heat and hence rising the temperature of the windings, core, oil and the tank of transformer. Experiments are carried out analyze the increase in ambient temperature of power system with various range of load impedance connected to it.
KEYWORDS: Power system, TEG, Heat sink, Digital thermometer.
I.INTRODUCTION
A network of electrical components which is used to supply, transmit and use electric power is known as an electrical power system. The network that supplies a region's homes and industry with power can be considered as an example of power system. This electric power system is called as the grid and can be further divided into the generator that generates the power, the transmission system that carries the power from generating centres to load centres and the distribution system that feeds power to nearby homes and industries. Distribution can be done by using transformers. So, transformers are one of the important components of power system, as power is mainly consumed at homes and industries where low voltage supply compared to generated supply is required, which can be done by transformers only [1].
Therefore we can say that transformers are mostly used in applications where the conversion of AC voltage from one voltage level to another is done. There are two types of transformers used, first one is electronictransformers, which operate at very low power levels, and second one is power transformers, which operate at very high power levels (thousands of watts of power). Electronic transformers are used in consumer electronic equipment like television sets, VCRs, CD players, personal computers, and many other devices, to reduce the level of voltage from 220V (available from the AC mains) to the required level at which the device operates. Power transformers are used in power generation, transmission and distribution systems to raise or lower the level of voltage to the required levels. The basic principle of operation of both types of transformers is the same [2-3].
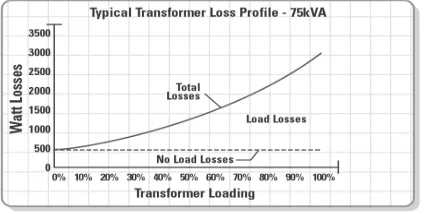
Fig. 1Variation of transformer losses with loading.
and thinner lamination are used. This loss decreases very slowly with rise in temperature. Eddy losses generate about 50% of the core losses. Hysteresis losses are affected by material, frequency and maximum magnetic density. It can be reduced by optimizing the maximum magnetic density and selecting economically best material while taking this loss into mind [4]. Load losses: The coil losses, generally called as load losses, are connected to the feeding power to the connected load. For linear loads, load losses are mostly I2R losses, it means that load losses are directly proportional to the square of current from no- load to full- load, driven by coil resistance [5].
Overall rating of the transformer can be affected by stray losses because hot spots can be created when the current leads become excessive and hence overall life of the transformer is affected. Transformer losses are of the order of 1% of its full load KW rating shown in Fig. 1. These losses then converted in the heat and hence rising the temperature of the windings, core, oil and the tank [6-8].
Heat generation process can be defined by the energy balance equation:
amb th
th
q dt c d dt
R
where q is the heat generation, cthis the thermal capacitance, θ is temperature, Rth is the thermal resistance, and θambis
the ambient temperature. The equation may be rewritten as follows:
amb th
th
d
q
c
dt
R
II. LITERATURE SURVEY
Kweon et.al (2012) briefly present that the life of a power transformer is dependent on the life of the cellulose paper, which Influenced by the hot spot temperature. Thus, the determination of the cellulose paper’s life requires Identifying the hot spot temperature of the transformer [9].
Taghikhani (2012) briefly shows that the Power transformer outages have a considerable economic impact on the operation of an electrical network. In order to draw maximum power from transformers and, at the same time, avoid thermal mishaps, it is essential to carefully study its thermal behaviour [6].
Su et.al. (2014) presents his article which describes the principles and characteristics of wireless temperature measurement technology build a real-time online monitoring wireless temperature measurement system [10].
Betta (2001) represent the paper which deals with a sensor for temperature measurements In fluids. The sensor is based on a fiber-optic sensing element and on microcontroller-based signal processing hardware. The physical principle behind its operation is briefly reviewed, and its application to power transformer hot-spot temperature measurement is reported [11].
Sharma et. al. (2014) in their paper told that knowledge of temperature fluctuations in fast reactor subassembly is very important from a safety point of view. The time constant of thermocouples which are used for measuring coolant temperature in a fast reactor varies owing to various factors [12].
III.
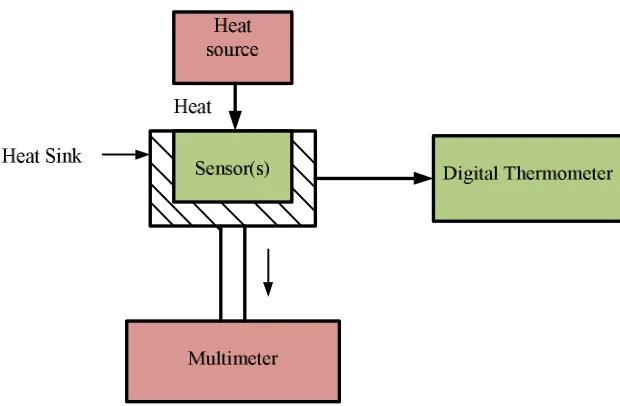
METHODOLOGYFig. 2 Schematic of experimental setup.
Table 1. Various combination of load impedance.
Resistance (Ω)
Capacitance (µF)
Inductance (mH)
Impedance(Z)
2
1
2[
]
Z
R
L
C
124 50
300 127.73 400 138.60 500 155.31 600 176.04 700 199.60 1000 279.60 1200 337.16 1800 517.19
IV.RESULT AND DISCUSSION
Table 2. Sensor output response w.r.t ambient temperature.
Temperature (o C)
O/P single sensor (V)
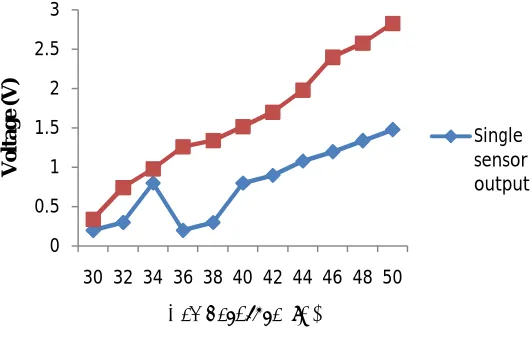
O/P sensor array (V) 30 0.2 0.34 32 0.3 0.74 34 0.8 0.98 36 0.9 1.26 38 1.08 1.34 40 1.2 1.52 42 1.34 1.7 44 1.48 1.98 46 1.8 2.4 48 1.93 2.58 50 2.2 2.83
Figure 3 show output voltage with respect to ambient temperature for single and array of sensor.
Fig. 3 Sensor output response w.r.t temperature.
Table 3 shows the output voltage from the senor when load is connected to the power system for constant interval of time.
Table 3. Sensor output response w.r.t load connected to power system.
Load Impedance
Sensor O/P (V)
127.73 0.32 138.60 0.81 155.31 0.93 176.04 1.10 199.60 1.32 279.60 1.54 337.16 1.61 517.19 1.97
0 0.5 1 1.5 2 2.5 3
30 32 34 36 38 40 42 44 46 48 50
V
o
ltage
(V
)
Temperature (ᵒC)
V.CONCLUSION
The research work is carried out to predict the heat generated in the power system with various range of load connected to it. Single sensor and array of sensor is tested to investigate its performance with varying the heat in the surrounding. Various ranging of load (127.73 to 517.19 ohms) is connected with the power system and rise in the ambient temperature of the system is observed. The sensor output for lowest and highest value of impedance is 0.32 V and 1.97 V respectively. Future scope the research work is to design a system detecting rise in temperature and switch the cooling system.
REFERENCES
[1] Chapman, Stephen J. Electric machinery and power system fundamentals. McGraw-Hill, 2002. [2] Hambley, Allan R. "Electrical Engineering Principles and Applications." (2009).
[3] Rizzoni, Giorgio. Principles and applications of electrical engineering. McGraw-Hill Science/Engineering/Math, 2005.
[4] Gour, Prashant, Kshitij Chautre, Anvita Kotwalla, and Tushar Arora. "Effective Conversion of Transformer Losses into Dissipated Heat." International Journal of Engineering and Innovative Technology (IJEIT), Vol.2, no. 6 pp.14-16, 2012.
[5] Ling, Philip JA, and P. Eng. "Transformers and Associated Losses-The Opportunity for Savings." White paper, Powersmiths International Corps (2001).
[6] Taghikhani, M. A. "Power transformer winding thermal analysis considering load conditions and type of oil." Int J Mat Mech Eng, Vol.1, no. 6, pp.108-13, 2012.
[7] Susa, Dejan, Matti Lehtonen, and Hasse Nordman. "Dynamic thermal modelling of power transformers." Power Delivery, IEEE Transactions on 20, no. 1pp.197-204, 2005.
[8] Swift, Glenn, Tom S. Molinski, and Waldemar Lehn. "A fundamental approach to transformer thermal modeling. I. Theory and equivalent circuit." Power Delivery, IEEE Transactions on 16, no. 2, pp.171-175, 2001.
[9] D.J Kweon, K.S Koo, J.W Woo and J.S Kwak, " A Study on the Hot Spot Temperature in 154kV Power Transformers", Journal of Electrical Engineering & Technology,Vol. 7, No. 3, pp. 312-319, 2012.
[10] Yan-Fei Su, Chen-Xu Zhao, Long Xu, Huan-Ping Ye, and Heng Xu, "Research and Application of WSN Technology in the Contact Points of Distribution Transformer", Journal of Clean Energy Technologies,Vol. 2, no. 1, January 2014.
[11] Giovanni Betta, "An Enhanced Fiber-Optic emperature Sensor System for Power Transformer Monitoring", IEEE transactions on instrumentation and measurement, Vol. 50, no. 5, October 2001.