Primary Frequency Control Contribution By Using
Reactive Compensation With Smart Load Configuration
PALUKURU SREENIVAS1, K.JAGADEESH 2
1PG Student, Dept of EEE (EPS), GPCET, Kurnool, AP, India. 2Assistant Professor, Dept of EEE, GPCET, Kurnool, AP, India.
ABSTRACT
Frequency subordinate loads characteristically add to essential frequency reaction. This venture depicts extra commitment to essential frequency control in light of voltage subordinate noncritical (NC) loads that can endure a wide variety of supply voltage. By utilizing a progression of receptive compensators to decouple the NC load from the mains to frame a smart load (SL), the voltage, and hence the dynamic energy of the NC load, can be controlled to manage the mains frequency. The extent of this venture concentrates essentially on responsive compensators for which just the greatness of the infused voltage could be controlled while keeping up the quadrature connection between the current and voltage. The viability of the SLs in enhancing mains frequency control without considering frequency-subordinate loads and with little unwinding in mains voltage tolerance is illustrated. Affectability examination is included to demonstrate the viability and confinements of SLs for changing load control factors, extent of SLs, and framework qualities.The effectiveness of SL is presented by incorporating in an IEEE 37 node test feeder.
Key Words; Demand response(DR) Demand side management (DSM), Primary frequency control, Statcom, Smart load(SL), Reactive compensator, Voltage control.
I.INTRODUCTION
very subject to the behavior of all the assistant drives, which are related with the fuel, the sustain water and the ignition air supply systems. As has been noted some time recently, system frequency and dynamic power balance are entwined[3]. This suggests an adjustment in dynamic power request at one point in the system is proliferated all through the system as an adjustment in frequency.
The accessibility of numerous generators providing power, circulated all through the system, suggests that a way to allot power request change to the generators ought to be given[5]. A controller named speed senator is typically introduced on each producing unit. It has the ability to control the unit's mechanical power and the system frequency, a function generally named as load-frequency control or essential load-frequency control[6]-[7]. A unit's mechanical power is controlled by following up on the measure of asset accessible for vitality change. The increasing entrance of circulated era (DG) in the power framework will bring about a lessening of the quantity of associated ordinary power plants, which are these days in charge of control of the power organize frequency[8]. At present DG units don't add to frequency control. With increasing entrance of DG it will wind up plainly vital, in any case, that they additionally add to frequency contro. A critical piece of the DG units are associated with the framework by a power electronic converter[9]-[10]. It is conceivable to execute extra control in this converter to give the DG unit a chance to add to frequency control.
II.MODELLING OF SMART LOAD
A.SMARTLOAD WITH REACTIVE
COMPENSATION (SLQ)
A compensator is a converter with a dc connect that infuses a voltage
with controllable greatness (VES) and stage point in arrangement with the NC load as appeared in Fig.1. The voltage over the NC loads is in this manner controlled (inside admissible limits) and the dynamic/receptive power devoured by it is balanced. In the event that the infused voltage is kept up in quadrature with the present stream, there is no dynamic power commitment from the compensator. This kind of SL is called and is appeared in Fig.1.Neglecting the power misfortune in the converter, the dynamic power utilization of the SL is equivalent to the dynamic power utilization of the NC load (PNC). The aggregate receptive power of the SL (QSL) is equivalent to the arithmetical entirety of responsive powers of the compensator and the NC load (QSL). The converter is controlled to keep up and, where just the size of the embedded voltage (VES) is differed while keeping the stage point. Concurrent control of both dynamic and responsive power of SL is unrealistic with a SLQ. Either the dynamic or the receptive power of the SL can be controlled (contingent upon the R/Xratio of the system) to control the supply voltage.
Fig.1 Smart load with reactive compensation (SLQ)
B.TYPES OF COMPENSATION MODES
portrayal is utilized for the NC loads.Frequency dependence of the loads is fail to segregate the commitment to essential frequency reaction from voltage dependence alone. As most impedance sort loads are of resistive-inductive (R-L) nature. Notwithstanding, the inferences are general and are appropriate to resistive-capacitive loads also.
(a) Inductive compensation mode
(b) Capacitive compensation mode
Fig.2 Phasor schematic for SLQ
For a R-L-type SLQ, the phasor diagrams are shown in Fig.2 for (a) inductive and (b) capacitive compensation modes.From the phasor diagrams, the relationship between the voltages across the compensator (VES), the NC load (VNC)
and the mains (VC) can be expressed as shown in Eq.1.
Eq. 1
Since ESis 900. Eq.1 can be written as Eq.2 and Eq.3 by cosine rule.
The positive and negative sign corresponds to the inductive and capacitive compensation modes, respectively.Using
NC
V =I ×ZNC, the compensator voltage (
ES
V ) in inductive compensation mode can be expressed in terms of the current (I) and supply or mains voltage (VC) as shown in Eq.4.
While in capacitive compensation mode,VES can be expressed in terms of the current (I) and supply or mains voltage (VC) as shown in Eq.5.
It can be seen that in inductive compensation mode, there is only one possible value for VES
corresponding to a value of I andVC as the second root of Eq.4 will always be fictitious(negative). However, it is possible to have two values of VEScorresponding to
a value of I and VC in capacitive compensation mode.
C.ACTIVE AND REACTIVE POWER CAPABILITY
SLQ capability
In order to draw the capability curve for SLQ, all possible values of VNC over a range of values of VES (0–1 p.u.) under both possible phase angles (θES=+900andθES=−900). This can be used to find out the values of the active and the reactive powers of SLQ as given by following Eq.6, Eq.7 and Eq.8.
Where the positive and negative sign of
QES corresponds to the inductive and capacitive compensation modes, respectively. IfPSL0andQSL0are the values of SL active and reactive powers with no compensation (VES=0). Change in active and reactive powers are shown in Eq.9, Eq. 10, Eq. 11 and Eq. 12.
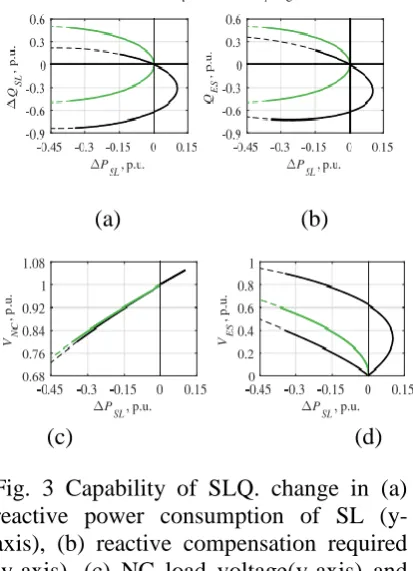
The capability of an SLQ is shown in Fig.3 for two different pfs of the NC load [12]. The thin dotted lines represent the whole range without any constraint on the magnitude of VNC,while the thick solid
lines represent the region in which VNC is
limited within the range of 0.8–1.2 p.u. There is no restriction on the ES reactive power (QES).The change in the active (
SL P
) and reactive ( QSL) powers are shown in Fig.3(a). For unity pf NC load
(green trace),there are no positive values forPSL as VNC cannot be larger than the
supply voltage [Fig.3(c)] for any value of the VES and θES=±900. Hence, a unity pf
NC load can only be used to tackle under-voltage conditions which requires a reduction in active power consumption (i.e., negativePSL)of the SL.
(a) (b)
(c) (d)
Fig. 3 Capability of SLQ. change in (a) reactive power consumption of SL (y-axis), (b) reactive compensation required (y-axis), (c) NC load voltage(y-axis) and (d) compensation voltage (y-axis) for change in active power consumption of SL (x-axis) for two different pfs.
For a 0.95 lagging power factor [shown in Fig.3(a) (black trace)],the active power consumption of the SL can be varied in both directions to tackle under- or over-voltage events. Out of the two possible values of VES which yields
the samePSL[Fig.3(d)], the smaller value should be used to ensure the minimum rating of the compensator. The capability curve for0.95 lagging pf in Fig.3 (a) is not symmetrical about the horizontal axis. There is a smaller operating range on the inductive compensation side if the SLQ is set to operate in the reactive power control mode. The maximum positive value of
SL P
occurs at the point when the inductive reactive power consumption of the NC load is equal to the capacitive reactive power of the converter. The current flowing through the SLQ is maximum at this point. One limitation of an SLQ is either the active or reactive power consumption of the SL can be controlled. It can be seen from Fig.3(b) that QES is mostly negative for positive
values of PSL . An increase in active power consumption in this zone results in a decrease in reactive power of the SL[Fig.3(a)]. This could be a problem in the case of an overvoltage event in LV/MV networks with a moderate R/X ratio where both active and reactive power exchanges are equally critical for voltage control.
D.CONTROL OF SMART LOAD
The control objective is to differ the dynamic power utilization of the SL inside the capacity of the SLQ keeping in mind the end goal to direct the supply frequency [13]. Variety in dynamic power is accomplished by controlling the extent of the voltage infused by the compensator which causes the voltage over the NC load to fluctuate inside as far as possible. The control circle is appeared in Fig.4.
Fig.4 Control loop for frequency regulation using R-L-type SLQ
An ideal phase-lock-loop (PLL) is assumed for frequency measurement. Any
difference (f ) between the reference (
ref
f ) and measured ( fm ) frequency is
filtered through a dead band(±0.01 Hz)and multiplied by a droop gain D= (0.215/PSL0
)to calculate the required change in active power (PSL0) consumed by the SL about
its nominal value ( PSL0). The value of
0
SL
P
is limited based on the maximum and minimum possible values calculated from the supply voltage (VC), and the NC
load impedance (ZNCNC ). The active power to be consumed by the SL at a given instant (PSL) is obtained by adding up the nominal power(PSLO) and the desired change ( PSL ).As the compensator exchanges only reactive power, the current (I) through the SL is obtained by calculating square root of PSLdivided by
NC
R . The current magnitude is limited based on the acceptable limits (V
NC-max-VNC-min) on the voltage across the NC load using its impedance ( ZNC ).From I, the
magnitude of the injected voltage (VES) can be derived using (Eq.4) and (Eq.5). The phase angle of the injected voltage (
ES
) would be set according to the sign of f
as shown in Fig.5. Capacitive compensation ( ES = -900) reduces
SL
P
while an inductive compensation (
0
90
ES
) is more effective in increasingPSL.An additional benefit is that inductive (capacitive) compensation decreases (increases) the supply or mains voltage slightly which would result in decrease (increase) in power consumption of other voltage-dependent loads connected to the mains which helps the frequency regulation further.
the minimum value ofVESis selected to ensure minimum reactive capacity (
I V
QES ES ) of the compensator. The reference values of the voltage magnitude (
ES
V ) and the phase angle ( ES )are provided to the standard control system of the inverter. An ideal tracking response is assumed for the inverters so that the reference values of the compensator voltage (VESref ,ESref )are the same as
their actual ( VES ,ES ) values. For a practical inverter, the non-ideal behaviour of the PLL has to be considered, the time delay for the inverter control, and dynamics of the dc link which might cause the phase angle to change a little from the
reference angle (900) in transient state to account for the losses in the inverter.
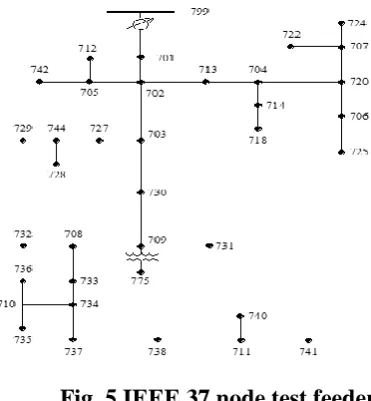
III. IEEE 37 NODE TEST FEEDER
This feeder is a genuine feeder in California, with a 4.8 kV working voltage. It is described by delta designed, all line portions are underground, substation voltage direction is two single-stage open-delta controllers, spot loads, and exceptionally unbalanced. The single line chart of IEEE 37 hub test feeder is appeared in Fig.5.
Fig. 5 IEEE 37 node test feeder
A.MATHEMATICAL MODELLING OF IEEE 37-BUS TEST SYSTEM
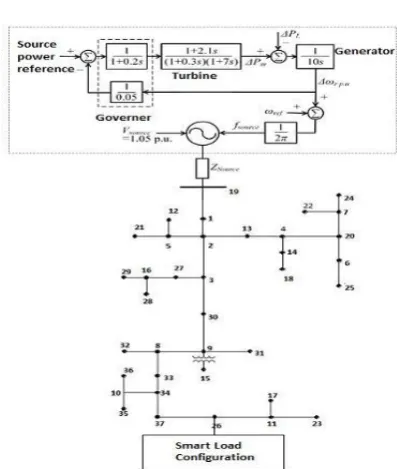
The supply frequency is a worldwide variable which is influenced by the consolidated activity of a few generators and loads associated at the mass power transmission and appropriation systems, separately. It is not direct to lead recreation thinks about with definite portrayal of both mass power transmission system and low-or medium-voltage (LV/MV)distribution arrange. Hence, totaled portrayal of the LV/MV arranges as lumped loads is regularly utilized for frequency control examines. As the SLs would be conveyed at the LV/MV level inside the dissemination arrange, collected portrayal of LV/MV organizes as loads would not be satisfactory. Consequently, a two-section base up and top-down approach as appeared in Fig.6.
Fig. 6 Top-down and bottom-up approaches for system modeling
IV.TESTSYSTEM AND RESULTS
A.TESTSYSTEM
A standard appropriation system, the IEEE 37-transport test system, appeared in Fig.9 is considered for the reproduction. It is a three-stage medium voltage spiral appropriation system with both single stage and unbalanced three stage loads. There are 32 static loads with a blend of steady impedance (Z), consistent current (I), and steady power (P) i.e., ZIP qualities. Around half of these loads are considered as noncritical [14] and thought to be of absolutely impedance sort while alternate loads (associated with the supply or mains) are spoken to by the ZIP display. The area of SLs is the same as the area of unique loads in the standard
system. The IEEE 37-transport test system information is introduced in supplement [15].
Fig. 7 Single line diagram of IEEE 37-bus test system with equivalent dynamic representation of the upstream system at bus 799
B.RESULTS
(i) Results For Frequency Decreasing Mode
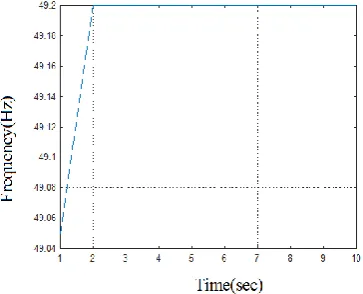
The system frequency diminishes when request is more prominent than era. Essential frequency control is speedier control which re-set up a balance amongst era and request inside the synchronous zone at a frequency not quite the same as the ostensible incentive inside 0 to 30 sec after disturbance of the balance amongst era and request. By utilizing smart load rather than typical load, the frequency deviation is less which is appeared in Fig. 8 Supply voltage and dynamic power varieties at the mains for normal and smart load are appeared in Fig. 9 and Fig. 10 separately.
(a) Frequency variation with normal load
(b) Frequency variation with smart load
Fig. 8 Supply frequency variation in decreasing mode
(a) Voltage variation with normal load
(b) Voltage variation with smart load
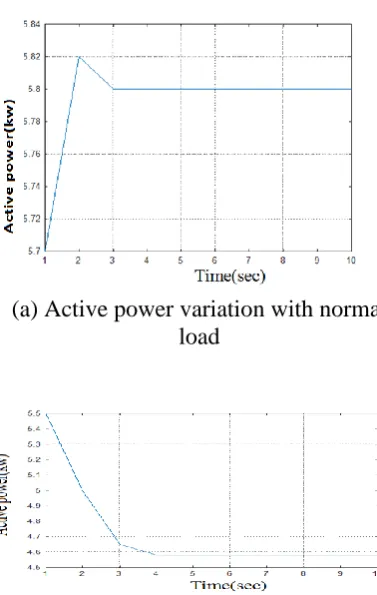
(a) Active Power variation with normal load
(a) Active power variation with smart load
Fig. 10 Active power variation in Decreasing mode
(ii) Results For Frequency Increasing Mode
The system frequency increases when request is not as much as era. Supply frequency variety of ordinary load and smart load for increasing mode is appeared in Fig. 11.Supply voltage and dynamic power varieties at the mains for ordinary load and smart load are appeared in Fig. 12 and Fig. 13 individually.
(a) Supply frequency variation with normal load
(b) Supply frequency variation with smart load
Fig. 11 Supply Frequency variation in Increasing mode
(a) Supply voltage variation with normal load
(b) Supply voltage variation with smart load
Fig. 12 Supply voltage variation in Increasing mode
(a) Active power variation with normal load
(b) Active power variation with smart load
Fig. 13 Active power variation in Increasing mode
V.CONCLUSION
Frequency control in a power system is a vital angle for safe operation of power system. Frequency control should be possible at both era and load side. Era side frequency control takes longer time i.e. 30 seconds to 15 minutes. So as to help the frequency in short time, request side control is picked i.e. essential frequency control. Demand side control (DSM) is for the most part utilized for frequency control on load side, however a few loads with steady power attributes can't be bothered. Smart load concept is utilized to control load power utilization through voltage variety utilizing shunt receptive pay gadget like STATCOM.
The viability and confinements of SLs as far as their commitment to essential frequency control is exhibited in this venture. Without considering any essential frequency
reaction commitment from frequency dependence of loads, the SLs all alone are appeared to accomplish tremendously enhanced frequency control with little unwinding in voltage tolerance for the NC loads and a little (portion of the load rating) receptive compensation.With SL utilizing responsive pay just (SLQ),the mains voltage direction deteriorated (as yet remaining admirably inside satisfactory points of confinement). On the off chance that more tightly voltage direction is a necessity because of presence of touchy loads, at that point SLs with both dynamic and receptive remuneration (SLPQ) would need to be utilized to empower synchronous control of both frequency and voltage this would be accounted for in a take after on extend. Affectability investigation is introduced to demonstrate the adequacy of the SLQs under fluctuating load power factors, extent of SLs and system qualities.
VI.REFERENCES
[1] [1]Akhtar, Z.; Chaudhuri, B.; Shu Yuen Ron Hui, “Primary Frequency Control Contribution FromSmart Loads Using Reactive Compensation,” IEEE Transactions on Smart Grid, vol.6, no. 5, pp. 2356 – 2365, Sept. 2015. [2] K. Tomiyama, J. P. Daniel, and S.
Ihara, “Modeling air conditioner loadfor power system studies,” IEEE Trans. Power Syst., vol. 13, no. 2,pp. 414–421, May 1998. [3] J. A. Short, D. G. Infield, and L. L.
Freris, “Stabilization of grid frequency through dynamic demand control,”IEEE Trans. Power Syst.,vol. 22, no. 3, pp. 1284–1293, Aug. 2007.
[4] N. Lu, Y. Xie, Z. Huang, F. Puyleart, and S. Yang, “Load componentdatabase of household appliances and small office equipment,” in Proc.IEEE Power Energy Soc. Gen. Meeting, Pittsburgh, PA, USA, Jul. 2008,pp. 1–5.
[5] Y. G. Rebours, D. S. Kirschen, M. Trotignon, and S. Rossignol, “A survey of frequency and voltage control ancillary services part I: Technicalfeatures,” IEEE Trans. Power Syst., vol. 22, no. 1, pp. 350–357,Feb. 2007.
[6] M. A. A. Pedrasa, T. D. Spooner, and I. F. MacGill, “Schedulingof demand side resources using binary particle swarm optimization,”IEEE Trans. Power Syst., vol. 24, no. 3, pp. 1173–1181, Aug. 2009.
[7] I. Erlich and M. Wilch, “Primary frequency control by wind turbines,” inProc. IEEE Power Energy Soc. Gen. Meeting, Minneapolis, MN, USA,pp. 1–8, Jul. 2010.
[8] A. H. Mohsenian-Rad, V. W. S. Wong, J. Jatskevich, R. Schober,and A. Leon-Garcia, “Autonomous demand-side management basedon
game-theoretic energy consumption scheduling for the future smartgrid,” IEEE Trans. Smart Grid, vol. 1, no. 3, pp. 320–331, Dec. 2010.
[9] H. T. Ma and B. H. Chowdhury, “Working towards frequency regulationwith wind plants: Combined control approaches,”IET Renew. Power Gener., vol. 4, no. 4, pp. 308–316, Jul. 2010.
[10] C.H. Liu and Y.Y. Hsu, “Design of a self-tuning PI controller fora STATCOM using particle swarm optimization,” IEEE Trans. Ind. Electron., vol. 57, no. 2, pp. 702– 715, Feb. 2010.
[11] M. Parvania and M. Fotuhi-Firuzabad, “Demand response scheduling bystochastic SCUC,” IEEE Trans. Smart Grid, vol. 1, no. 1, pp. 89–98,Jun. 2010.
[12] P. Palensky and D. Dietrich, “Demand side management: Demandresponse, intelligent energy systems, and smart loads,” IEEE Trans. Ind.Informat., vol. 7, no. 3, pp. 381–388, Aug. 2011. [13] C. K. Lee, S. Li, and S. Y. R. Hui,
“A design methodology for smartLED lighting systems powered by weakly regulated renewable powergrids,”IEEE Trans. Smart Grid, vol. 2, no. 3, pp. 548–554, Sep. 2011.
[14] K. Samarakoon, J. Ekanayake, and N. Jenkins, “Investigation of domestic load control to provide primary frequency response using smartmeters,”IEEE Trans. Smart Grid, vol. 3, no. 1, pp. 282–292, Mar. 2012.
Author’s Profile:-
Palukuru Sreenivas was graduated from AVR AND SVR College of engineering and technology (JNTUA), Kurnool, India in the year 2014. He is persuing M.Tech degree from G.Pullaiah college of engineering and technology (JNTUA), Kurnool.