Detection & Analysis of Skin Cancer using
Wavelet Techniques
D.N.V.S.L.S. Indira # , JYOTSNA SUPRIYA P *
#
Department of Computer Science & Engineering,Gudlavalleru Engineering College, Gudlavalleru, Krishna Dt., AP., India
*
Department of Computer Science & Engineering,Swarnandhra Institute ofEngineering & Technology Narsapur-534275, WGDT, AP., India
Abstract— This paper presents a different method to develop a Texture Analysis based Classification Module to improve the decision strategy and overall accuracy of the system. Asymmetry, Border Irregularity, Color variation, Diameter is the major symptoms which we will use in our processing algorithm. By applying multi-level Wavelet Transformation to the input image and then choosing a group of sub-bands to be restored for best defect detection, the procedure for Skin cancer detection and analysis was developed.
Keywords – Skin Cancer, Wavelet Techniques, Melanoma, color
I. INTRODUCTION
Skin cancer is the most common type of cancer and represents 50% all new cancers detected each year. The deadliest form of skin cancer is melanoma, and its incidence has been rising at an alarming rate of 3 % per year. If detected at an early stage, skin cancer has one of the highest cure rates, with rather simple and economical treatments.
The incidence of malignant melanoma has increased dramatically over the past few decades. Although a potentially fatal disease, malignant melanoma has a near 100%cure rate if detected and excised early. Early diagnosis is obviously dependent upon patient attention but also accurate assessment by a medical practitioner. Dermatologist will see numerous melanoma patients, honing their capacity to make accurate diagnoses but general practitioners and other medical professional may not develop such an accurate eye. A computer aided diagnosis system is not meant to replace a trained Dermatologist but to assist less trained practitioners. Such a system would be useful for remote medical clinics that do not have the luxury of a trained dermatologist on hand.
This paper makes use of Matlab’s Image Processing Toolbox and Wavelet Toolbox for all image analysis and wavelet calculations
A. Biology
Cancer can be defined as a group of diseases in which cells are aggressive (grow and divide without respect to normal limits), invasive (invade and destroy adjacent tissues) and metastatic (spread to other locations in the body).
Cancer is usually classified according to the tissue from which the cancerous cells originate as well as the normal cell type they most resemble (Lung, Skin, Breast, Prostate, Bone, etc.).The most common type of cancer found is the Skin cancer. It represents the most commonly diagnosed malignancy, surpassing lung, breast and prostate cancer.
B. Skin Cancer
Skin cancer is a disease in which cancer (malignant) cells are found in the outer layers of the skin. It develops in the epidermis (the outermost layer of skin), so a tumor is usually clearly visible. This makes most skin cancers detectable in the early stages.
C. Types:
There are 3 common types of skin cancer, each of which is named after the type of skin cell from which it arises.
1. Basal Cell Carcinoma: It is the most common type of skin cancer. It typically appears as a small raised bump that has a pearly appearance. It is most commonly seen on areas of the skin that have received excessive sun exposure.
1) Squamous Cell Carcinoma: It is seen on the areas of the body that have been exposed to excessive sun (nose, lower lip, hands, and forehead). Often this cancer appears as a firm red bump or ulceration of the skin that does not heal.
2) Melanoma: The malignant melanoma is a highly malignant skin cancer, it grows rapidly and sometimes with different colors and abnormal shapes. Melanoma has its beginnings in melanocytes, the skin cells that produce in the dark protective pigment called melanin. The melanin is responsible for suntanned skin which acting as a partial protection against sun light.
Figure 1 Skin Cancer Image
Malignant melanoma is a cancerous condition where melanocytes grow unchecked, producing growths with variations in size, color, density and contour. To help medical practitioners recognize melanoma, the American Cancer Society developed the ABCD check list: A (asymmetry), B (border irregularity), C (color variation), and D (differential structure). Lesions exhibiting these characteristics are more likely to be malignant but an accurate diagnosis often requires a skin biopsy. Using these rules, clinicians have a correct diagnosis rate of 65-80%.
D. Wavelets
Wavelets are an extension Fourier analysis. The mathematics of Fourier analysis dates back to the nineteen century but it wasn’t until the mid twentieth century, with the advent of fast algorithms and computers that Fourier analysis began to make an impact on the world. Widely used in signal analysis, hardly a scientific field hasn’t been impacted by this technique.
Figure 2 Fourier transformation converts signal into combinations of sinusoids of different frequencies.
The Fourier transform essentially converts a signal from the time domain to the frequency domain, giving a frequency representation of the signal [Figure 2]. Fourier transformation relies on the fact that a signal can be represented by a combination o sine and cosine functions. Coefficients are calculated which determine how to combine sinusoid to produce the signal. Since sinusoids are not of limited duration, they extend from minus to plus infinity, coefficients calculated from these base waves loose all time information. Windowing techniques are often used to focus the transformation on a specific section of time but the accuracy is limited.
Figure 3 Wavelet family examples, from left to right: Haar, Mexican Hat, Daubechies and Morlet.
Wavelet analysis uses a similar approach but instead of sinusoids, waves of limited duration, termed basis function
or mother wavelets, are used [Figure 3]. Unlike Fourier transformation, a number of different mother wavelet families exist. While Fourier transformation breaks a signal up into sin and cosine functions of various frequencies, wavelet transformation breaks a signal up into shifted and scaled versions of the mother wavelet [Figure 4]. Since the wavelet is of limited duration, it can be shifted down the signal at known intervals. At each step a coefficient is calculated representing how closely the wavelet resembles this section of signal. By scaling the wavelet, stretching or compressing it, information about the overall signal trend to small details can be obtained.
Figure 4 Wavelet analysis represents the signal as combinations of scaled and shifted mother wavelets.
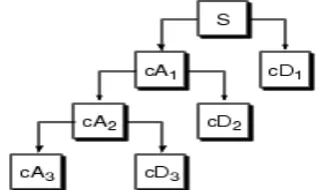
Figure 5 Wavelet decomposition tree. ‘S’ is the source image which is decomposed to cA1 (associations)and cD1 (details). cA1 is then decomposed to make the level two decomposition
Wavelet analysis uses the terms approximations and details. Approximations are the high scale low frequency components while details are the low scale high frequency components. Approximations are what give a signal its identity. The language content of a person’s voice is mostly distinguished by its approximations. Details provide distinct characteristics, such as unique tonal qualities in each individual’s voice Wavelet decomposition can be an iterative process occurring over several levels. The original signal is decomposed into approximations and details with the approximations feeding the next level of decomposition, creating a decomposition tree [Figure 5].
E. Current Techniques in Skin Cancer Detection & Diagnosis
To diagnose skin cancer, the doctor may remove all or part of the suspicious lump or patch and send it to the lab for examination. This may determine whether or not the lump is cancer and what type it is.
II. WAVELETANALYSIS&SUB-BAND DECOMPOSITION
The ABCD system requires a lot subject judgment on the part of the practitioner. Since firm clinical inspection rules do not exist, it is not possible to make a good rule based detection system. If clearly defined description existed for what constitutes features such as border irregularity or color variability, it would be relatively easy to extract the necessary features and make an accurate diagnosis. Considering such features we must rely on a detection system requiring less domain knowledge where original image is submitted and the system “figures out” the cancer affected area required to draw a reasonably accurate conclusion.
Variability appears to be what most separates malignant cancerous part from background therefore the best approach at image manipulation and feature extraction would retain as much of the data variability as possible. Previous systems have focused on collecting numerous data points hoping to best represent the lesion. Wavelet analysis by its very nature looks at variability within a signal, in this case color indexes in an image. Since images are only composed of color values, changes in texture, granularity, and color are all represented by the same value system. Wavelet analysis looks at these changes over different scales which should detect whole lesion changes such as texture and color, and local changes like granularity.
A. Image Preparation
Digital images of skin cancer were collected in BMP or JPEG format from different sources. Matlab’s Wavelet Toolbox only supports indexed images with linear monotonic color maps so the RGB images were converted to indexed images. The next step in the process was to segment the lesion from the surrounding skin. Since a clear color distinction existed between lesion and skin, thresholding was very suitable for this task. A black and white image was produced and its size was adjusted in order to include the entire border region in the segmented image.
B. Wavelet Transformations
Wavelets are a mathematical tool for hierarchically decomposing functions in the frequency domain by preserving the spatial domain. This property can be exploited to segment objects in noisy images based on their frequency response in various frequency bands, separating them from the background and from other objects. Plenty of modern images provide various information of patient, but for many reasons, the use of this information is very limited. In medical image processing applications, we usually deal with discrete data. Therefore we will focus on the Discrete Wavelet Transforms for our project. Wavelet transforms are used in our method for the segmentation problems of targets in images.
C. Discrete Wavelet Transform
Wavelet packets provide more flexibility on partitioning the spatial-frequency domain, and therefore improve the separation of noise and signal into different sub-bands in an approximated sense (this is referred to the near-diagonalization of signal and noise). This property can greatly facilitate the enhancement and de-noising task of a noisy signal if the wavelet packets basis is selected properly.
In practical applications for various medical imaging modalities and applications, features of interest and noise properties have significantly different characteristics that can be efficiently characterized separately with this framework.
The steps needed to compress an image using Wavelet transform are as follows:
Digitize the source image into a signal which is a string of numbers.
Decompose the signal into sequence of wavelet coefficient w.
Use threshold to modify wavelet coefficient w to another coefficient w’.
Use quantization to convert w’ to sequence q. Apply entropy encoding to compress q into a
sequence e.
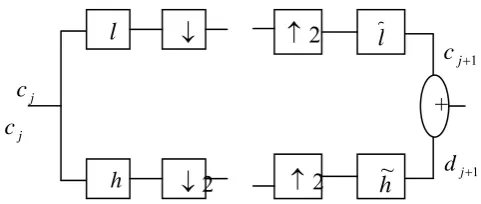
D. Two-Dimensional Discrete Wavelet Transform A 2-D wavelet transform is needed to analyze 2-D signals like images. However, separable 2-D transform can be implemented using series of two 1-D transforms. As an example, two dimensions DWT of images is implemented by applying 1-D transforms on rows of the image, followed by columns transform applied to transformed row. One level 2-D discrete wavelet decomposition and reconstruction implemented using filter banks is explained in [Figure 6] & [Figure 7].
Figure 6 One level DWT Image Decomposition using filter banks
c
j1
c
jj
c
d
j1Figure 7 One level DWT Image Decomposition and Reconstruction using filter banks
So, 2-D input signal like digital images is projected on the four bases as shown and the results are four different set of transform coefficients.
LL Sub band contains all wavelet coefficients those results from applying low pass filter to both rows and columns of an image.
HL Sub band consists of all wavelet coefficient results from low pass filtering of the rows, followed by high filtering of the columns.
LH Sub band consists of all wavelet coefficient results from high pass filtering of the rows ,followed by low pass
2
l
h
+
2
2
l
~
filtering of the columns , and mostly it Carries information about the vertical details or edges.
HH Sub band consists of all wavelet coefficient results from applying high pass filter to both rows by high and columns. This usually captures the diagonal edges or details of the original images.
E. Image Transformation and Reconstruction Using DWT:
An efficient algorithm of computing a discrete wavelet transform of a given signal is introduced by [Figure 8] that each stage of wavelet decomposition process involves extracting a coarser approximate and detail signals from approximate signal of next finer stage.
Figure 8 Multilevel Wavelet Decomposition of the Signal X
So, by keeping the detail signal produced by each decomposition stage, and continuing extracting a coarser approximate and details signals, multi level wavelet decomposition is obtained.
Thus, the reconstruction algorithm of approximate signal
k j
c
, at a scalej
given approximatec
j1,k and detaild
j1,k of scalej
1
, can be viewed as up sampling of the discrete approximate and details, followed by filtering each signal and summing the output signals together. Leth
,
l
, andh
~
,
~
l
by the analysis filter and synthesis filter pair respectively, the corresponding filters were orthogonal i.e., andhg, also h~l~ which produced orthogonal scaling and wavelet basis functions. Since1
j
W
is orthogonal complement subspace ofV
j1 inV
j. The wavelet representation is complete i.e.1
1
j j
j V W
V . So, reconstruction approximation signal
k j
c
, from approximate, and details of coarsersubspace
V
j1 can be expressed as:
l l
l j l k l j l k k
j
h
c
l
d
c
, 2 1, 2 1, ……. (13)For some applications the analysis and synthesis filter pairs do not represent orthogonal sets, but
g
h
~
andh
g
~
, this configuration is called bi-orthogonal filter banks (10), and the corresponding scaling and wavelet function denoted as bi-orthogonal wavelets. However, The decomposition still similar to orthogonal case, described by equation (2.10), but reconstruction may different may be different from in case of orthogonal wavelet basis, and computed as:
l l
l j l k l
j l k k
j
h
c
l
d
c
,~
2 1,~
2 1,(14)
Where the reconstruction or synthesis filters
h
~
,
~
l
may differ from decomposition or analysis filtersh
,
l
.F. Noise Reduction and Image Enhancement using
Wavelet Transforms:
De-noising can be viewed as an estimation problem trying to recover a true signal component X from an observation Y where the signal component has been degraded by a noise component N: Y=X+N. The estimation is computed with a threshold estimator in an ortho-normal basis B = {gm} 0≤m<n as:
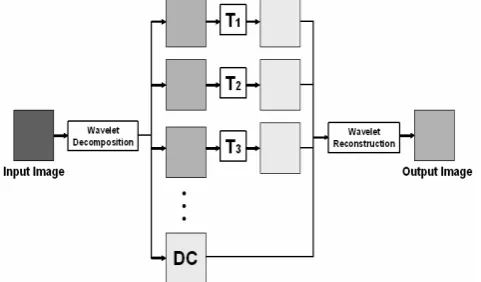
As a general rule, wavelet coefficients with larger magnitude are correlated with salient features in the image data. In that context, de-noising can be achieved by applying a threshold operator to the wavelet coefficients (in the transform domain) followed by reconstruction of the signal to the original image (spatial) domain. This framework of de-noising & image enhancement at 3-level can be well understood from [Figure 9].
Figure 9 A 3-level decomposition framework of de-noising & Enhancement using DWT
Magnitude of wavelet coefficients measures the correlation between the image data and the wavelet functions. For first-derivative based wavelet, the magnitude therefore reflects the “strength” of signal variation. For second-derivative based wavelets, the magnitude is related to the local contrast around a signal variation. In both cases, large wavelet coefficient magnitude occurs around strong edges. To enhance weak edges or subtle objects buried in the background, an enhancement function should be designed such that wavelet coefficients within certain magnitude range were to be amplified. Therefore, the selection of the wavelet basis is a critical step in the design of the de-noising and enhancement procedure.
One
level as
One
level as One
III.AUTOMATICALLYSKINCANCERDETECTION SYSTEM
The first step in the paper is to establish a general idea and structure of typical system for skin cancer detection. Most of the systems consist of following procedures: image pre-processing to remove the noise and fine hair; Post-processing: to enhance the shape of image; Segmentation: to remove the healthy skin from the image and find the region of interest, usually the cancer cell, remains in the image; Feature extraction extracts the useful information or image properties from the segmented images; Finally, this information is used in the detection system for testing purpose ie., to extract the cancer affected area from the original image. The detection system is usually supported by decomposition and reconstruction or de-noising framework . The element of all these ideas will extend in next section.
IV.SYSTEM DESCRIPTION
The adopted approach exploits wavelet transform properties and characteristics of sub-band decomposition schemes, based on the information of the original image and in the transform domain. The wavelet transform is well adapted for this type of application. Given that malignant features correspond to high frequency components, they can be enhanced by suppressing the lowest frequency sub-band before reconstructing the image from the other frequency sub-bands. After the detailed study of different types of skin cancers and their symptoms, this algorithm was implemented with DWT technique at different levels in order to analyze the result well. The system described by block diagram in [Figure 10] was implemented in MATLAB®. The four major steps are as follows:
A. Preprocessing:
This stage consists of resizing the image, masking, cropping, hair removal and conversion from RGB to Grayscale image. We are using an already preprocessed image in this project. An example of a skin cancer cell image that has undergone the steps is shown in the [Figure11].
Figure 10 Process Algorithm Cycle
Figure 11 Preprocessing of Skin Cancer
B. Wavelet Decomposition and Transformation:
In this stage we will perform multilevel 2-D wavelet decomposition on the input image. It is performed by using wavelet filters and Outputs are the decomposition vector say, C and the corresponding bookkeeping matrix say, L. Then we will perform the discrete 2-D wavelet transform on the decomposed image and compute the approximation coefficients matrix cA and details coefficients matrices say, cH, cV, and cD (horizontal, vertical, and diagonal, respectively), obtained by wavelet decomposition of the input matrix X.
C. Reconstruction
After performing DWT and getting the wavelet coefficients we will reconstruct the image by using reconstruction function that computes the matrix of reconstructed coefficients of level N, based on the wavelet decomposition structure [C,S]. We can also compute Single-level inverse discrete 2-D wavelet transform by using the inverse function.
D. Smoothening
After getting the reconstructed image we will smooth the image by using different windowing filtering techniques. We can also convert the processed image into binary image in order for further analysis.
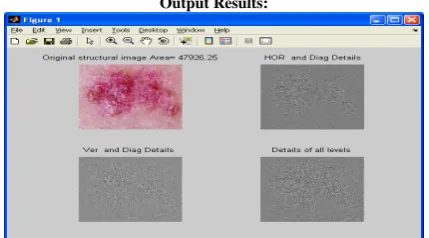
Output Results:
Fig 13. Image Showing Horizontal, Vertical and Diagonal Details of the Input Image
Fig. 14 Filtered image with all details
Fig. 16 Outlined Original Image
CONCLUSION & FUTURE DIRECTION
The rate of patient with skin cancer will be increasing if pollution still damaging the ozone layer. The risk of ultra violet light is a hidden damage to our body skin. It is hard to prevent and the effect can be accumulated. Early detection is important to the patients of the skin cancer.
This project was not defined of any Thresholding for the input image processing, so the processed output will be different in terms of accuracy. In future we can develop an “Automatic Thresholding System” by implying ANN techniques in the algorithm. The accuracy of outlined image can be calculated with respect to the manually outlined image by dermatologist. In future a method can be developed to calculate the area of cancerous part through the algorithm and compare it with the dermatologist outlined image.
In future a test scale can be developed for determining the efficiency of different wavelet filter families in the algorithm.
REFERENCES:
[1] “Skin cancer detection based NIR image Analysis”—by Mang Cao,
Kyung A. Kang, Chein-I Chang, and Duane F. Bruley, University of Maryland-Baltimore County.
[2] “Wavelets in Medical Image Processing: De-noising, Segmentation, and Registration” Yinpeng Jin, Elsa Angelini, and Andrew Laine, Columbia University, New York. Laine, A. and Fan, J.,