10.15662/ijareeie.2014.0308073
A New Image Fusion Algorithm Based on
Wavelet Transform and Adaptive Neuro
Fuzzy Logic Approach
Dr. Pankaj Mohindru, Maninder Singh Gill, Dr. Pooja,
Asst. Professor, Department of ECE, Punjabi University, Patiala, India
Student (M.Tech), Department of ECE, Punjabi University, Patiala, India
Asst. Professor, Department of ECE, Punjabi University, Patiala, India
ABSTRACT:Image fusion is a process of integrating multiple images of the same scene into a single output fused image. It minimizes redundancy and reduce uncertainty and extract all the useful information from the source images. The process of image fusion is required for different applications like remote sensing, medical imaging, machine vision and military applications where critical information and quality is required. In this paper the image fusion using the combination of wavelet transform and adaptive neuro fuzzy logic is implemented. The results are compared with the pixel level image fusion in spatial domain with fuzzy and neuro fuzzy logic approach along with the quality evaluation indices for image fusion like entropy, RMSE(Root Mean Square Error), PSNR(Peak Signal to Noise Ratio) and Correlation Coefficient. Experimental results prove that the above algorithm is better than the other fusion techniques.
KEYWORDS: fuzzy logic, neuro fuzzy logic, image quality indices, root mean square error, peak signal to noise ratio, correlation coefficient.
I.INTRODUCTION
Any piece of paper makes sense only when it is able to convey the information across. The clarity of information is important. Image Fusion is a mechanism to improve the quality of information from a set of images. By the process of image fusion, the good information from each of the given images is fused together to form a resultant image whose quality is superior to any of the input images. This is achieved by applying a sequence of operators on the images that would make the good information in each of the image prominent[20]. The resultant image is formed by combining such magnified information from the input images into a single image.
The input images may be from different sensors[9], medical images[11,16], remote sensing images[7]. Image fusion aims at aggregating two or multiple images from same information sources, so as to achieve improved accuracy and robust inference performance by utilizing redundancy and complementariness in information. It is used for medical di agnostics and treatment. A patient’s images in different data formats can be fused. These forms can include magnetic resonance image (MRI), computed tomography (CT), and positron emission tomography (PET). In radiology and radiation oncology, these images serve different purposes. For example, CT images are used more often to ascertain differences in tissue density while MRI images are typically used to diagnose brain tumors. Image fusion is also used in the field of remote sensing wherein multivariate images like thermal images, IR Images, UV Images, ordinary optical image etc can be fused together to get a better image taken from a satellite.
II. LITERATURE SURVEY
Vol. 3, Issue 8, August 2014
10.15662/ijareeie.2014.0308073
It also provided the assessment and systematic performance analysis of conventional and wavelet image fusion techniques quantitatively. Manjusha Deshmukh [4] presented the utilization of image fusion of PET and MRI images. This paper provide PCA based image fusion and also focuses on image fusion algorithm based on wavelet transform to improve resolution of images in which two images to be fused are firstly decomposed then algorithm works and again reconstructed in the result images. Deepak Kumar Sahu, M.P. Parsai[5] presented the literature review on some of the important image fusion techniques like Primitive fusion(Averaging method, Select Maximum, Select Minimum), fusion based on Discrete Wavelet transform, Principal component analysis(PCA) based fusion etc. Zhu Mengyu, Yang Yuliang [6] presented an image fusion algorithm based on fuzzy logic and wavelet transform. Pixel level image fusion algorithms have been analyzed using visible and infrared image fusion and a new algorithm is proposed based on Discrete Wavelet Transform(DWT) and Fuzzy Logic.
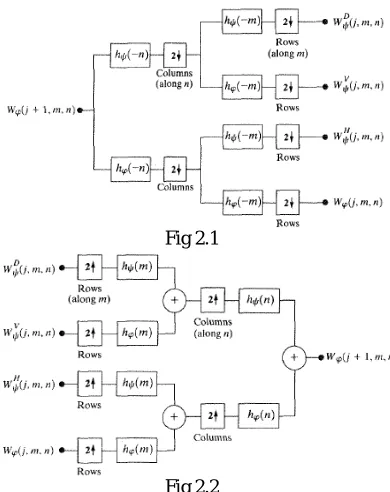
III.WAVELET TRANSFORM
Wavelet transforms are based on small waves, called wavelets, of varying frequency and limited duration. This allows us to provide the equivalent of a musical score for an image, revealing not only what notes(or frequencies) to play but also when to play them. In 1987, wavelets were first shown [22] to be the foundation of a powerful new approach to signal processing and analysis called multi resolution theory. It is concerned with the representation of and analysis of signals and images at more than one resolution. If we look at the fourier transform it gave us the frequency representation of the signal but we would not know that where the high and low frequency take place. The alternative to this problem is that we have to go with the shorter and shorter frames, only then we can extract such kind of localization property better.
In the case of images we have two dimensional signal so, we have to apply wavelet transform in both the directions i.e. horizontal as well as vertical. So, we can define four filters depending on two directions. Suppose S(n1,n2) is an image.
1 2 1 2
( ,
n n
)
( ) * ( )
n
n
: Here we are doing low-pass filtering in both the directions,ΨH(n1,n2)= ψ(n1)* ϕ(n2) : High pass filtering in horizontal direction and low pass filtering in vertical direction.
ΨV(n1,n2)=ϕ(n1)* ψ(n2) : High pass filtering in vertical direction and low pass filtering in horizontal direction.
ψD(n1,n2)= ψ(n1)* ψ(n2) : High pass filtering in both the directions.
Fig 2.1
Fig 2.2
10.15662/ijareeie.2014.0308073
IV.ADAPTIVE NEURO FUZZY INFERENCE SYSTEM (ANFIS)
The basic structure of the fuzzy inference system is that it is a model that maps input characteristics to input membership functions, input membership function to rules, rules to a set of output characteristics, output characteristics to output membership functions, and the output membership function to a single-valued output or a decision associated with the output. We have considered only fixed membership functions that were chosen arbitrarily. We have applied fuzzy inference to only modeling systems whose rule structure is essentially predetermined by the user's interpretation of the characteristics of the variables in the model.
In ANFIS we apply fuzzy inference techniques to data modeling. As we have seen from the other fuzzy inference, the shape of the membership functions depends on parameters, and changing these parameters change the shape of the membership function. Instead of just looking at the data to choose the membership function parameters, we choose membership function parameters automatically.
V.ALGORITHM USING WAVELET TRANSFORM AND ANFIS
Read the first image in variable IM1 and second image in variable IM2.
Convert the images into gray level images.
By using biorthognal3.7 wavelet function, find out the wavelet transform coefficients of both the images i.e. approximation coefficients, horizontal, vertical and diagonal coefficients.
Find out the size of approximation coefficient’s matrix i.e.
W
of both the images. Convert each of the matrix in column form.
Check the maximum and minimum values in both the matrixes to decide the range of ‘fis’ system.
Form a training data, which is a matrix of three columns and entries in each column are from maximum to minimum value insteps of 1.
Form a check data which will be the matrixes in column form of
W
of both the input images. Decide the number and type of membership functions for both the input images by tuning the membership functions. In our case we have taken 5 gaussian shaped membership functions.
For training FIS structure is used, which is generated by genfisl command with training data, number of membership functions and type of membership
functions as input.
To start training, anfis command is used which inputs generated FIS structure and training data and returns trained data.
With the steps of one, apply fuzzification using the generated FIS structure with Check data and trained data as
inputs which will return
W
coefficients of the output image in column format. Convert it from column format to matrix format. Do the similar operation to the WΨH horizontal coefficients, WΨV
vertical coefficients and WΨ
D
diagonal coefficients.
Find out the inverse wavelet transform using
W
, WΨH, WΨV and WΨDcoefficients of the output image andrepresent it as image.
VI. IMPLEMENTATION
Vol. 3, Issue 8, August 2014
10.15662/ijareeie.2014.0308073
VII. IMAGE QUALITY MATRICES
Image Quality is a characteristic of an image that measures the perceived image degradation. Imaging systems may introduce some amounts of distortion or artifacts in the signal, so the quality assessment is an important problem. We have used for quality matrices which are given below.
a. Root Mean Square Error(RMSE)
To find RMSE we have to first calculate Mean Square Error(MSE) which is given by the following relation,
1 1
1
(
)
m n ij ij i jMSE
A
b
mn
2
Where m is the height of the Image implying the number or pixel rows. n is the width of the image, implying the number of pixel columns. Aij being the pixel density values of the input image.
Bijbeing the pixel density values of the fused image. To calculate RMSE from MSE we take square root of MSE.
Root Mean square error is one of the most commonly used error projection method where, the error value is the value difference between the input data and the resultant data.
b. Peak Signal to Noise Ratio(PSNR)
The mathematical relation for PSNR is given below,
* 10
10 log
peak peak MSEPSNR
PSNR is defined as log of the ratio between the square of the peak value to the Mean Square Error multiplied to the value 10. This basically projects the ratio of the highest possible value of the data to the error obtained in the data. 5 In our case, at pixel level, the highest possible value is 255. i.e. in a 8 bit grayscale image, the maximum possible value is having every bit as 1 –> 11111111; which is equal to 255. Then the error between the fused image and the input image is calculated as the Mean Square Error and the ratio value is obtained. If both the fused and the input images are identical, then the MSE value would be 0. In that case, the PSNR value will remain undefined.
c. Entropy(H)
Entropy is defined as amount of information contained in a signal[4]. Shannon was the first person to introduce entropy to quantify the information. The entropy of the image can be evaluated as,
2 1
( ) log ( ( ))
G
i i
H
P i
P d
Where G is the number of possible gray levels, P(di) is probability of occurrence of a particular gray level di . Entropy can directly reflect the average information content of an image. The maximum value of entropy can be produced when each gray level of the whole range has the same frequency. If entropy of fused image is higher than parent image then it indicates that the fused image contains more information.
d. Correlation coefficient
The correlation coefficient measures the closeness or similarity in small size structures between the original and the fused images. It can vary between -1 and +1.Values close to +1 indicate that they are highly similar while the values close to -1 indicate that they are highly dissimilar. The ideal value is one when the reference and fused are exactly alike and it will be less than one when the dissimilarity increases.
1
1 1
(
)(
)
(
) ^ 2
(
) ^ 2
n i i i n n i i i i
X
X Y
Y
CC
X
X
Y
Y
10.15662/ijareeie.2014.0308073
Where Xi is the intensity of the i th
pixel in image1, Yi is the intensity of the i th
pixel in image2, X is the mean intensity of image1 and Y is the mean intensity of image2.
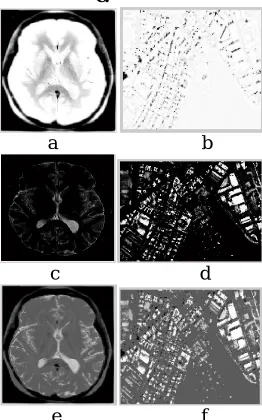
VIII.EXPERIMENTAL RESULTS AND DISCUSSION
We have used two set of images one is the set of MRI images of brain and other is the set of satellite images of Gateway of India, Mumbai, India. The input images are gray level images. The input, fused images and comparison table are given below.
a. Fusion in spatial domain using Fuzzy Logic
a b
c d
e f
The images a, b, c, d are the input images and e and f are fused images.
b. Fusion in spatial domain using Adaptive Neuro Fuzzy Inference System(ANFIS) c.
a b
c d
e f
Vol. 3, Issue 8, August 2014
10.15662/ijareeie.2014.0308073
d. Fusion in Transform domain using Fuzzy Logic.
a b
c d
e f
a, b, c, d are input images, e and f are fused images. After fusing a and c we got image e and fusing b and d we got image f.
e. Fusion using the proposed algorithm using Wavelet Transform and ANFIS.
a b
c d
10.15662/ijareeie.2014.0308073
f. Comparison Tables
Fusion in Spatial Domain Fusion in Transform Domain Evaluation
Measure
Using Fuzzy logic.
Using ANFIS Using Fuzzy Logic
Using ANFIS, Proposed algo.
Entropy(H) 4.6007 5.5714 5.4563 6.0182
RMSE 9.0840 2.2497 4.8893 2.244
PSNR 57.9985 82.2448 62.4539 82.2859
Corre. Coeff. 0.27 0.89 0.44 0.95
Table 1. Comparison of different images matrices for fusion of MRI images of Brain.
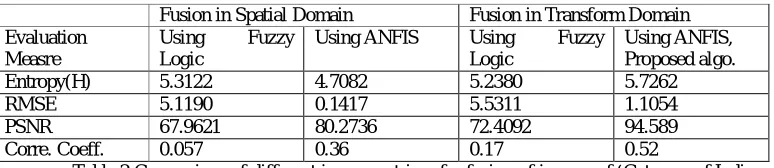
Fusion in Spatial Domain Fusion in Transform Domain Evaluation
Measre
Using Fuzzy Logic
Using ANFIS Using Fuzzy Logic
Using ANFIS, Proposed algo.
Entropy(H) 5.3122 4.7082 5.2380 5.7262
RMSE 5.1190 0.1417 5.5311 1.1054
PSNR 67.9621 80.2736 72.4092 94.589
Corre. Coeff. 0.057 0.36 0.17 0.52
Table 2 Comparison of different image matrices for fusion of images of ‘Gateway of India.
From the above tables, let us first discuss for the fusion of images of brain. In Table 1, the value of entropy(H) for the fused image using proposed algorithm is 6.0182, which is maximum among the other algorithms. Value of Root Mean Square Error(RMSE) is also minimum among all other techniques. The value of Peak Singnal to Noise Ratio(PSNR) is also maximum of all along with the correlation coefficient.
Now come to table 2, here we are having values of image quality measures for fusion of the images of ‘Gateway of India’. The value of entropy by using the proposed technique, of the fused image is 5.7262, which is also maximum of all the other techniques. The RMSE is having value 1.1054 , which is not the minimum but close to it. PSNR is having value 94.589, maximum among all the other techniques and correlation coefficient having value 0.52 is also maximum of all.
IX. CONCLUSION
In this paper the potential of image fusion in transform domain using wavelet transform and Adaptive Neuro Fuzzy Inference System(ANFIS), has been explored along with the quality assessment evaluation measures. The experimental results have shown that the proposed algorithm using the mentioned technique gives considerable improvement for image fusion.
REFERENCES
[1] Harpreet Singh, Jyoti Raj, Gulsheen Kaur, Thomas Meitzler, “Image Fusion using Fuzzy Logic and Applications,” IEEE Conference, Budapest,
Hungary,2004.
[2] Rahul Ranjan, Harpreet Singh, Grant R. Gerhart, “Iterative Image Fusion Technique using Fuzzy and Neuro Fuzzy Logic and Applications,”
IEEE Annual Meeting of the North American Fuzzy Information Processing society,2005.
[3] M.Seetha, Dr. I.V.Murali Krishna, B.L. Deekshatulu, “Data Fusion Performance Analysis based on Conventional and Wavelet Transform Technique,” IEEE conference, 2005.
[4] Manjusha Deshmukh, Udhav Bhosale, “Image Fusion and Image Quality Assessment of Fused Images,” International Journal of Image
Processing(IJIP), Pages 484-508, Volume(4):Issue(5).
[5] Deepak Kumar Sahu, M. P. Parsai, “Different Image Fusion technique- Acritical Review,” International Journal of Modern Engineering Research(IJMER), Pages 4298-4301, Vol. 2, Issue:5,2012.
[6] Zhu Mengyu, Yang Yuliang, “A New Image Fusion Algorithm Based on Fuzzy Logic,” IEEE International Conference on Intelligent
Computation Technology and automation,2008.
Vol. 3, Issue 8, August 2014
10.15662/ijareeie.2014.0308073
[8] Yang-Ping Wang, Jian-Wu Dang, Sha Li, “ Multimodal Medical Image Fusion Using Fuzzy Radial Basis Function Neural Networks,”
Proceedings of International Conference on Wavelet analysis and Pattern Recognition, Beijing, China, 2-4 Nov, 2007.
[9] Yi Zheng, Ping Zheng, “ Multi sensor Image Fusion using Fuzzy Logic for surveillance system,” Seventh International Conference on Fuzzy
Systems and Knowledge Discovery, 2010.
[10] Shivsubramani Krishnamorthy, K P Soman, “ Implementation and Comparative study of Image Fusion algorithms,” International Journal of Computer Applications, Volume 9, November 2010.
[11] Jionghua Teng, Suhuan Wang, Jingzhou Zhang, Xue Wang, “ Neuro-Fuzzy Logic Based Fusion Algorithm of Medical Images,” IEEE,
International Congress on Image and Signal Processing, 2010.
[12] Labib Arafeh, Harpreet Singh, Susil K. Putatunda, “A Neuro Fuzzy Logic Approach to Material Processing,” IEEE Transactions on Systems,
Man and cybernetics- Part c: Applications and Reviews, Vol. 29, No. 3, August,1999.
[13] Yong Yang, “ A Novel DWT Based Multi Focus Image Fusion Method,” International Conference on Advances in Engineering,2011.
[14] Srinivasa Rao, Seetha M, Krishna Prasad MHM, “Comparison of Fuzzy and Neuro Fuzzy Image Fusion Techniques and its Applications,” International Journal of Comuter Applications, Page no. 31-37, Volume 43, April 20, 2012.
[15] Srinivasa Rao Dammavalam, Seetha M, Hazarath Munaga, “ Iterative Image Fusion using Neuro Fuzzy Logic and Applications,” IEEE, 2012.
[16] Aditi Rana, Shaveta Arora, “ Comparative Analysis of Medical Image fusion,” International Journal of Computer Applications, Volume 73, July 2013.
[17] Li-Hui Hui, Guo Lei, Liu Hang, “ Current Research on Wavelet-based Image Fusion Algorithms,” www.paper.edu.cn .
[18] JIA Yong-hong, Li de-ren, SUN Jia-bing “Multidimentional Remote Sensing Imagery Data Fusion” Remote Sensing Technology and
Application 2005,15 (1) : 41-44.
[19] H. Li, B. S. Manjunath, and S. K. Mitra. Multisensor image fusion using the wavelet transform. Graphical Models and Image Processing 1995;
57: 235–245.
[20] Shivsubramani Krishnamoorth, “Development of Image Fusion Techniques And Measurement Methods to Assess the Quality of the Fusion,”
M.S. Thesis, July 2008.
[21] L. Zadeh, “Fuzzy Sets.” Inform. Contr., vol. 8,no. 3.pp. 338-353,1965.