Mining Educational Data to Analyze Student’s
Performance with Graphical Representation
Jatinder Kaur
Guide Name: -
Dr. Dinesh Kumar
University College of Computer Applications
Email Id: - [email protected]
ABSTRACT
Educational data mining is current growing research area and the main essence of data mining concepts are used in the educational field for extracting useful information of the students based on their behavior in the learning process. Prior approaches used decision tree classifications optimized with ID3 algorithms to obtain such patterns but discovering the implicative tendencies is valuable information for the decision-maker which is absent in tree based classifications. So we propose to use outlier detection for mining and evaluating educational data of students. In this paper, outlier detection mechanisms are used for identifying outliers which improve the quality of decision making. We used outlier analysis to detect outliers in the student data. In proposed system, clustering mechanism along with univariant analysis is implemented. Clustering is finding groups of objects such that the objects in one group will be similar to one another and different from the objects in another group. While clustering, the large data set is divide into clusters which consists of outliers. After Clustering, the data points which are present outside the clusters are identified and treated as outliers. Identification is done by using univariate analysis which is the simplest form of quantitative (statistical) analysis. A basic way of presenting univariate data is to create a frequency distribution of the individual cases Here, we analyze the performance of UG students of our college and present the results using outlier detection mechanism. The analyzed results are represented using histograms which are based on univariate analysis.
Index Terms: - Outlier, Clustering, Univariate analysis, and Histograms.
INTRODUCTION
1.1 INTRODUCTION
The topic of explanation and prediction of academic performance is widely researched. Data Mining Techniques is the promising methodology to extract valuable information in this objective. Now-a-days, there are increasing research interests in using data
mining in education. These new emerging fields, called educational data mining, concerned with developing methods that extract knowledge from data come from the educational context.
students and to improve the quality of managerial decisions. In this perspective, one way to achieve highest level of quality in higher education system is discovering and analyzing relevant information results and produce different perspectives to understand more about the students ‗activities so as to customize the course for student learning.
For optimally analyzing the student
performance, the classification task is used on student database to predict the students division on the basis of previous database. As there are many approaches that are used for data classification, the decision tree method is used here. Information‗s like Attendance, Class test, Seminar and Assignment marks were collected from the student‗s previous database, to predict the performance at the end of the semester. This study will help the students and the teachers to improve the division of the student. This study will also work to identify those students which needed special attention to reduce fail percentages and taking appropriate action for the
upcoming evaluations. This kind live
performance monitoring and counter
measures before the big evaluation definitely helps to improve students ‗performance. In recent years, conventional database querying methods are inadequate to extract useful information, and hence researches nowadays are focused to develop new techniques to
meet the raised requirements. Outlier
detection is an important research problem that aims to find objects that are considerably dissimilar, exceptional and inconsistent in the database. Outliers are objects which do not correspond to an ideal model of the data.
Outliers have extraordinary behavior
comparing with other data objects. An object that is significantly different from other objects is called as outlier. These outliers lead us to wrong decision making. Efficient detection of outliers reduces the risk of making poor decisions based on erroneous data, and aids in identifying, preventing, and repairing the effects of malicious or faulty behavior. In this research, outlier detection mechanisms are used for identifying outliers which improve the quality of decision making. We used outlier analysis to detect outliers in the student data. In proposed system, clustering mechanism along with
univariant analysis is implemented.
Clustering is finding groups of objects such that the objects in one group will be similar to one another and different from the objects in another group. While clustering, the large data set is divide into clusters which consists of outliers. After Clustering, the data points which are present outside the clusters are
identified and treated as outliers.
Identification is done by using univariate analysis which is the simplest form of quantitative (statistical) analysis. A basic way of presenting univariate data is to create a frequency distribution of the individual cases here; we analyze the performance of UG students of our college and present the results using outlier detection mechanism. The analyzed results are represented using histograms which are based on univariate analysis.
KNN: k-nearest neighbor classification: A more sophisticated
approach, k-nearest neighbor (kNN)
classification, finds a group of k
objects in the training set that are closest to the test object, and bases the assignment of a label on the predominance of a particular class in this neighborhood. There are three key elements of this approach: a set of labeled objects, e.g., a set of stored records, a distance or similarity metric to compute distance between
objects, and the value of k, the
number of nearest neighbors. To classify an unlabeled object, the distance of this object to the labeled
objects is computed, its k-nearest
neighbors are identified, and the class labels of these nearest neighbors are then used to determine the class label of the object.
The Apriori algorithm: Apriori is a
seminal algorithm for finding
frequent itemsets using candidate generation. It is characterized as a level-wise complete search algorithm using anti- monotonicity of itemsets, ―if an itemset is not frequent, any of its superset is never frequent‖. Apriori first scans the database and searches for frequent itemsets of size 1 by accumulating the count for each item and collecting those that satisfy the minimum support requirement. It then iterates on the following three steps and extracts all the frequent itemsets.
1. Generate Ck+1, candidates of
frequent itemsets of size k +1, from
the frequent itemsets of size k.
2. Scan the database and calculate the support of each candidate of frequent itemsets.
3. Add those itemsets that satisfies the minimum support requirement to
Fk+1.
Naive Bayes: Naïve Bayes method is important for several reasons. It is very easy to construct, not needing any complicated iterative parameter estimation schemes. This means it may be readily applied to huge data sets. It is easy to interpret, so users unskilled in classifier technology can understand why it is making the classification it makes. And finally, it often does surprisingly well: it may not be the best possible classifier in any particular application, but it can usually be relied on to be robust and to do quite well. Here, the initial set of objects are used with known class memberships (the training set) to construct a score such that larger scores are associated with class 1 objects (say) and smaller scores with class 0 objects. Classification is then achieved by comparing this score with
a threshold, t.
probability that this item belongs to each of the possible class categories. The Bayesian classifier is ‗naïve‗in the sense that attributes are treated as
though they are completely
independent, and as if each attribute contributes equally to the model. If extraneous attributes are included in the dataset, then those attributes will skew the model. Despite its simplicity, Naïve Bayes, like OneR, can give surprisingly good results on many real world datasets.
J48 (C4.5 Decision Tree Revision 8):
J48 is an implementation of C4.5 release 8, a standard algorithm that is widely used for practical machine
learning. This implementation
produces decision tree models. This algorithm works by forming pruned partial decision trees (built using C4.5‗s heuristics), and immediately converting them into a corresponding rule. C4.5 algorithm is the most popular tree classifier.
ONER (Onerules): Onerules are rules that classify an object on the basis of a single attribute (i.e. they are 1-level decision trees). ONER is a very simple classification rules performing well on most commonly used datasets. They use the minimum-error attribute for prediction, discretizing numeric
attributes. They ranks attributes
according to an error rate (on the
training set). They treat all
numerically valued attributes as
continuous and use a straightforward
method to divide the range of values into several disjoint intervals.
LITERATURE REVIEW
2.1 LITERATURE REVIEW:
-Educational data mining is a promising area of research and it has a specific requirements not presented in other domains. Thus, work should be oriented towards educational domain of data mining. The goal of this study is to show how useful data mining can be used in higher education to improve student ‗performance.Al-Radaideh et al. [1], applied the data mining techniques, particularly classification to help in improving the quality of the higher educational system by evaluating student data to study the main attributes that may affect the student performance in courses. The extracted classification rules are based on the decision tree as a classification method; the extracted classification rules are studied and evaluated. It allows students to predict the
final grade in a course under study. Ayesha et
right time and improve the performance of students.
Baradwaj and Pal [3], applied the classification as data mining technique to evaluate student‘s performance, they used decision tree method for classification. The goal of their study is to extract knowledge that describes student‘s performance in end semester examination. They used student‗s data from the student‗s previous database including Attendance, Class test, Seminar and Assignment marks. This study helps earlier in identifying the dropouts and students who need special attention and allow the teacher to provide appropriate advising.
Chandra and Nandhini [4], applied the association rule mining analysis based on student‗s failed courses to identifies student‗s failure patterns. The goal of their study is to identify hidden relationship between the failed courses and suggests relevant causes of the failure to improve the low capacity
student‗s performances. The extracted
association rules reveal some hidden patterns of student‗s failed courses which could serve as a foundation stone for academic planners in making academic decisions and an aid in
the curriculum re-structuring and
modification with a view to improving student‗s performance and reducing failure rate.
Cesar et al. [5] proposed a recommendation system based on data mining techniques to help students to make decisions related to their academic track. The system supports students to better choose how many and which courses to enroll on. As a result, the authors developed a system that is capable of predicting the failure or success of a student
in any course using a classifier obtained from the analysis of a set of historical data related to the academic field of other students who took the same course in the past.
Pathom et al. [6] proposed a classifier algorithm for building Course Registration Planning Model (CRPM) from historical dataset. The algorithm is selected by comparing the performance of four classifiers include Bayesian Network, C4.5, Decision Forest, and NBTree. The dataset were obtained from student enrollments including grade point average (GPA) and grades of undergraduate students. As a result, the NBTree was the best of the four classifiers. NaïveBayes classifier (NBTree) was used to generate the CRPM, which can be used to predict the student GPA and consider student course sequences for registration planning.
Ramaswami and Bhaskaran [7] have constructed a predictive model called CHAID with 7-class response variable by using highly influencing predictive variables obtained through feature selection so as to evaluate the academic achievement of students at higher secondary schools in India. Data were
collected from different schools of
Tamilnadu, 772 student‗s records were used for CHAID prediction model construction. As a result, set of rules were extracted from the CHAID prediction model and the efficiency was found.
private tutoring and this variation of intensity of private tutoring depends on the collective factor namely socio-economic conditions.
PROBLEM FORMULATION
Before developing research we keep
following things in mind so that we can develop powerful and quality research.
3.1 PROBLEM FORMULATION
Outlier detection is an important research problem that aims to find objects that are considerably dissimilar, exceptional and inconsistent in the database. Outliers are objects which do not correspond to an ideal model of the data. Outliers have extraordinary behavior comparing with other data objects. An object that is significantly different from other objects is called as outlier. These outliers lead us to wrong decision making. Efficient detection of outliers reduces the risk of making poor decisions based on erroneous data, and aids in identifying, preventing, and repairing the effects of malicious or faulty behavior. In this research, outlier detection mechanisms are used for identifying outliers which improve the quality of decision making. We used outlier analysis to detect outliers in the student data. In proposed system, clustering mechanism along withunivariant analysis is implemented.
Clustering is finding groups of objects such that the objects in one group will be similar to one another and different from the objects in another group. While clustering, the large data set is divide into clusters which consists of outliers. After Clustering, the data points which are present outside the clusters are
identified and treated as outliers.
Identification is done by using univariate analysis which is the simplest form of quantitative (statistical) analysis. A basic way of presenting univariate data is to create a frequency distribution of the individual cases here; we analyze the performance of UG students of our college and present the results using outlier detection mechanism. The analyzed results are represented using histograms which are based on univariate analysis.
3.2 OBJECTIVE
A basic way of presenting univariate data is to create a frequency distribution of the individual cases here; we analyze the performance of UG students of our college and present the results using outlier detection
mechanism. The analyzed results are
represented using histograms which are based on univariate analysis.
RESEARCH
METHODOLOGY
4.1 DATA MINING PROCESS
Now-a-days, performance of individual
4.1.1 DATA PREPARATIONS: The data set used in this study was obtained from B.TECH
students all branches of KITS College from session 2008 to 2012. Initially size of the data is 240.
In this step data stored in different tables was joined in a single table after joining process errors
were removed. The domain values for some of the variables were defined for the present
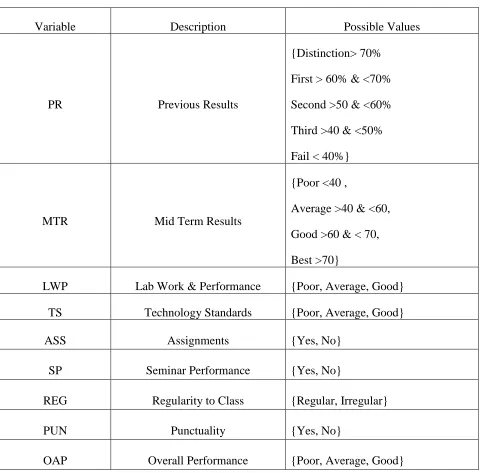
investigation as follows:
Table 4.1: Data Preparations
Variable Description Possible Values
PR Previous Results
{Distinction> 70%
First > 60% & <70%
Second >50 & <60%
Third >40 & <50%
Fail < 40%}
MTR Mid Term Results
{Poor <40 ,
Average >40 & <60,
Good >60 & < 70,
Best >70}
LWP Lab Work & Performance {Poor, Average, Good}
TS Technology Standards {Poor, Average, Good}
ASS Assignments {Yes, No}
SP Seminar Performance {Yes, No}
REG Regularity to Class {Regular, Irregular}
PUN Punctuality {Yes, No}
FE Final Examination
{Distinction> 70%
First > 60% & <70%
Second >50 & <60%
Third >40 & <50%
Fail < 40%}
PR: PR means previous results in B.Tech
course. It is split into five class values: Distinction> 70%, First > 60%, Second >50 & <60%, Third >40 & <50% and Fail < 40%.
MTR: MTR means Mid Term Results conducted internally in college. In each semester, two written exams and two online exams are conducted and averages of four tests are used to calculate internal marks. It is split into three class values: Poor, Average, Good and Best.
SP: Seminar performance participated
outside the campus. Seminar performance is split into two classes: yes- Students participated in seminars, No- Students does not participated in seminars.
ASS – Assignment performance. Assignment
performance is divided into two classes: Yes – student submitted assignment, No – Student not submitted assignment.
LWP – Lab Work and Performance Lab
work means both internal and external lab work and exams. Lab work is divided into three classes: Poor, Average and Good.
PUN- Punctuality of student in college. It is
split into two class values: yes- Student is punctual; No- Student is not punctual.
TS - Technology Standard of student and
his/her interest. It is divided into three
classes: poor- Students are not willing to know and accept the new technology; Average- Students are willing to know and not ready to accept or Students are not willing to know but if any chance ready to accept the technology; Good- Students are willing to know and accept the technology.
REG- Regularity of student in college. It is
split into two class values: yes- Student is regularly attending to class; No- Student is not regularly attending to class.
FE – Final examinations obtained in B.Tech
and it is declared as response variable. It is split into five class values: Distinction>70%, First > 60 % & < 70%, Second > 50 & < 60%, Third > 40 & < 50% and Fail < 40%.
OAP- Over All Performance of Student in
class, sports and outside the campus. It is divided into three classes: Poor, Average and Good.
this paper, students are clustered into three
groups according to their academics,
punctuality, exams and soon.
4.1.3 OUTLIER DETECTION: After performing clustering, Outlier detection discovers data points that are significantly different than the rest of the data. Outlier detection is a task that finds objects that are dissimilar or inconsistent with respect to the remaining data or which are far away from their cluster centroids. In outlier detection, data points which are significantly different than the rest of the data are discovered. In educational data mining, outlier analysis can be used to detect students who irregular, suffering with learning problems and soon. In our case study, we used outlier analysis to detect outliers in the student data. Based on the identified outliers, decision making is done effectively and efficiently which will
result improvement in performance of student. For outlier detection, here we are using another technique called univariate analysis for detecting the outliers.
4.1.4 UNIVARIATE ANALYSIS: After analyzing the performance of UG students of our college, outliers are identified. The analyzed results are represented using histograms or pie charts which are based on univariate analysis. Univariate analysis is the simplest form of quantitative (statistical) analysis. A basic way of presenting univariate data is to create a frequency distribution of the individual cases, which involves presenting the number of attributes of the variable studied for each case observed in the sample. This can be done in a table format, with a histogram, bar chart or a similar form of graphical representation.
Table 4.2: Data Set
SR.NO PR MTR TS ASS SP LWP PUN REG FE OAP
1 Distinction Best Good Yes Yes Good Yes Yes Distinction Good
2 Distinction Good Poor Yes No Good Yes Yes Distinction Poor
3 Distinction Good Poor Yes No Good Yes Yes First Poor
4 First Average Good Yes No Average Yes Yes First Good
5 First Poor Good No No Average Yes Yes First Good
6 First Poor Good No No Good Yes Yes First Good
7 First Good Average No Yes Good Yes Yes Second Average
8 Second Good Average No Yes Good No Yes Second Average
9 Second Good Good Yes Yes Average No Yes Second Good
11 Distinction Poor Good Yes Yes Poor No No Distinction Good
12 Distinction Best Average Yes Yes Good No Yes Distinction Average
13 Distinction Best Poor Yes Yes Good No Yes Third Poor
14 Third Best Poor Yes Yes Good Yes Yes Third Poor
15 Third Average Good Yes Yes Poor Yes Yes Third Good
16 Third Average Good Yes Yes Poor Yes Yes Third Good
17 Third Average Good No Yes Good Yes Yes Fail Good
18 Fail Average Poor No Yes Good Yes Yes Fail Poor
19 Fail Good Poor No No Good Yes Yes Third Poor
20 First Good Good No No Average Yes Yes Third Good
EXPERIMENTAL RESULT
5.1 EXPERIMENT RESULT
The above sample data set consists of 30 students with domain values. Some of unclustered instances i.e., outliers are:
(1) Student who got first class in previous results, but overall performance is poor due to the student irregularity, average performance in labwork and midterm marks and also poor result in final examination.
(2) Student who was failed in previous results, but overall performance is good due to best performance in lab as well as in midterm, regular and punctual in class and also best result in final examination.
(3) Student who got distinction in previous result, but overall performance of student is average due to his/her unwillingness to know and accept the new technology and also not participating in seminars.
(4) Student who was interested in participating in every activity which are conducting in and outside
Fig 5.1: Pie Chart of Overall Performance variable
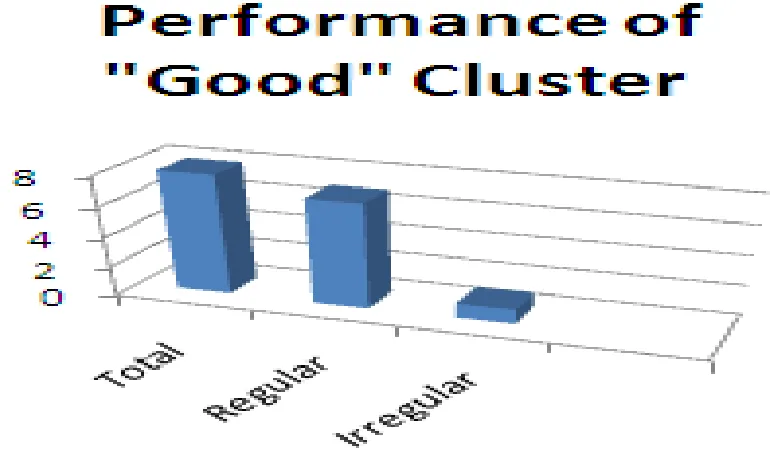
When clustering is performed based on the overall performance, then 3 clusters are formed i.e., poor, average and good as shown in fig 5.1. Let Consider cluster ― good‖ of overall performance field in the above chart of the data set. From that cluster, now identify the regularity of the student as shown below:
Fig 5.2: 3-D view for regularity of cluster "good"
Fig 5.3: Histogram for Mid-term Results according to overall performance
From the above chart, the student who was best in mid-term results but poor in overall performance is an outlier. By combing the implementation of univariant analysis along with clustering, will results to outlier detection. Outliers are identified by recursively applying the proposed system. After gaining the information of different outliers as specified above, the entire performances of students are categorized. Later, Decision making is done based on the outlier‗s performance which results improvement in students educational standards.
CONCLUSION
6.1 CONCLUSION & FUTURE
WORK
Now-a-days, there are increasing research interests in using data mining in education. The main objective of higher education institutes is to provide quality education to its students and to improve the quality of managerial decisions. In this paper, outlier detection mechanisms are used for identifying outliers which improve the quality of decision making. We used outlier analysis to detect outliers in the student data. In proposed system, clustering mechanism along with univariant analysis is implemented. Clustering is finding groups of objects such that the objects in one group will be similar to one another and different from the objects in another group. While clustering, the large data set is divide into clusters which consists of outliers.
After Clustering, the data points which are present outside the clusters are identified and treated as outliers. Identification is done by using univariate analysis which is the simplest form of quantitative (statistical) analysis. A basic way of presenting univariate data is to create a frequency distribution of the individual cases Here, we analyze the performance of UG students of our college and present the results
using outlier detection mechanism. The
analyzed results are represented using
histograms which are based on univariate analysis.
REFERENCES
[1] Radaideh, Q., Shawakfa, E. and
Al-Najjar, M. (2006) ―Mining Student Data Using
Decision Trees”, The 2006 International Arab
Conference on Information Technology
[2] Ayesha, S. , Mustafa, T. , Sattar, A. and
Khan, I. (2010) ―Data Mining Model for
Higher Education System‖, European Journal
of Scientific Research, vol. 43, no. 1, pp. 24-29.
[3] Baradwaj, B. and Pal, S. (2011) ―Mining
Educational Data to Analyze Student’s Performance‖, International Journal of Advanced Computer Science and Applications, vol. 2, no. 6, pp. 63-69.
[4] Chandra, E. and Nandhini, K. (2010) ―Knowledge Mining from Student Data‖,
European Journal of Scientific Research, vol. 47, no. 1, pp. 156-163.
[5] Cesar V., Javier B., liela S., and Alvaro O., ―Recommendation in Higher Education Using Data Mining Techniques‖, In Proceedings of the Educational Data Mining Conference, 2009.
[6] Pathom P., Anongnart S., and Prasong P., ―Comparisons of Classifier Algorithms: Bayesian Network‖, C4.5, Decision Forest and
NBTree for Course Registration Planning Model of Undergraduate Students, Sripatum University Chonburi Campus, Office of Computer Service, Chonburi Thailand, IEEE, 2008.
[7] Ramaswami M., and Bhaskaran R., ―CHAID Based Performance Prediction Model in Educational Data Mining”, IJCSI International Journal of Computer Science Issues, Vol. 7, Issue 1, No. 1, 2010.
[8] M. Bray, ―The Shadow Education
System: Private Tutoring and Its
Implications For Planners‖, (2nd ed.),
UNESCO, PARIS, France, 2007.
[9] A. Moreira, M. Y. Santos and S. Carneiro, ―Density-based clustering algorithms-DBSCAN and SNN”, July 2005
[10] M. Ankerst, M. M. Breunig, H. P. Kriegel
and J. Sander, ―OPTICS: Ordering Points to