Studies of the wind filtering effect of gravity waves observed
at Allahabad (25.45
◦N, 81.85
◦E) in India
G. K. Mukherjee1, Pragati Sikha R.2, N. Parihar3, Rupesh Ghodpage3, and P. T. Patil4
1Indian Institute of Geomagnetism, Panvel (W), Navi Mumbai 410218, India 2Department of Physics, Andhra University, Visakhapatnam—500003, India
3Dr. K.S.K.G.R. Laboratory, IIG, Allahabad—221505, India 4Medium Frequency Radar, IIG, Shivaji University, Kolhapur, India
(Received December 11, 2008; Revised September 16, 2009; Accepted November 29, 2009; Online published March 4, 2010)
Well-de ned coherent wave sources associated with the passage of short-period gravity waves were observed in all-sky images of OH emission on a total 21 occasions during January to May 2008 at Allahabad (25.45◦N, 81.85◦E, dip lat∼16.49◦N) in India. The wave motions exhibited similar spatial and temporal properties during each month, but the north-east ward motions were distinctly dominant in April and May 2008. It is a well-known theory that the upward propagating gravity waves may be blocked or absorbed at a critical layer. We have computed the magnitude and direction of atmospheric gravity waves subject to blocking by horizontal winds, i.e., critical layer directional ltering. The HWM-93 model (Hedinet al., 1996) was used to compute the two components of neutral wind velocity at Allahabad for the period of observation of gravity waves during March and April 2008. Data from two components of wind velocity were then used to construct the blocking diagrams, which show the directions and apparent phase velocities of wave propagation blocked at a given altitude. The blocking diagrams were then compared with experimental observations of gravity waves in OH airglow to determine the accuracy of the wind model and explain the critical layer theory.
Key words: Gravity waves, critical layer, blocking, wind directional ltering effect, Allahabad, propagation characteristics.
1.
Introduction
Low light images of OH hydroxyl bands taken with CCD cameras (Tayloret al., 1997; Nakamuraet al., 1999; Mukherjee, 2003) can provide excellent opportunities for remote sensing of the two-dimensional (2D) evolution of spatial and temporal characteristics of the movement of short-period gravity waves over a large geographical region with great precision. The image data provides vital statis-tical information on the apparent horizontal phase velocity, direction, wavelength, and period of these waves. This col-lective body of data together with geographical locations, shape, orientation, and time of displays has been most help-ful to researchers investigating the main sources of these waves.
In the troposphere, large-amplitude gravity waves are produced by ow over mountains, severe weather events (fronts, squall lines, etc), convection, jet streams, and other processes. These waves can cause cloud banding and affect the rainfall pattern. They also break, in the same manner as the ocean waves break near the sea shore, producing turbu-lence which can be a hazard to aircrafts.
Gravity waves which propagate higher up into the atmo-sphere (e.g., into the stratoatmo-sphere and mesoatmo-sphere) grow in amplitude due to decreasing air densities. When gravity
Copyright cThe Society of Geomagnetism and Earth, Planetary and Space Sci-ences (SGEPSS); The Seismological Society of Japan; The Volcanological Society of Japan; The Geodetic Society of Japan; The Japanese Society for Planetary Sci-ences; TERRAPUB.
doi:10.5047/eps.2009.11.008
waves propagate through the airglow layers, the densities of atoms, molecules, and ions that cause photochemical re-actions uctuate. As a result, the airglow layers show 2D wave patterns. This means that in the horizontal airglow extent, the areas with strong and weak emission intensities change both temporarily and spatially. Consequently, tem-poral and spatial structures of gravity waves can be mapped by observing the airglow intensity images taken with a sen-sitive CCD camera, enabling researchers to study the dy-namic processes occurring in the mesosphere.
It is well known that both the background wind and en-ergy attenuation have profound effects on the characteristics of upward propagating atmospheric gravity waves (Dinget al., 2003). Hines (1960) and Cowling et al.(1971) stud-ied the effect of background winds on the gravity ray paths. Both research groups found that changes in the intrinsic fre-quency of the gravity wave were dependent on the direction of the wind. If the gravity wave propagates along the wind, the intrinsic frequency is shifted downward; when the wave frequency equals to zero, wave energy is lost to the mean ow, a process known as critical coupling. Medioroset al. (2003) and Tayloret al.(1993) found that winds have a di-rectional ltering effect on propagation of gravity waves.
Preliminary data on gravity waves collected at the Alla-habad station (25.45◦N, 81.85◦E, dip lat∼16.49◦N) in In-dia showed that, in 2008, the preferential direction of wave propagation was towards the north-east in the months of April and May and in the south-west direction in February– March (Pragatiet al., 2010). Tayloret al.(1993) explained
that the apparent asymmetry in the wave propagation direc-tion may be caused by a wave ltering effect that can occur at any height where the horizontal wind velocity along the direction of the horizontal wave vector equals the horizon-tal phase velocity and the intrinsic frequency is Doppler-shifted to zero. A horizontal surface (r-θ plot) has been constructed at the critical altitude to identify the region where the gravity waves are blocked for upward propaga-tion. Gravity waves propagating within the region would be heavily absorbed by diverse mechanisms (Ryan, 1991), and it would not be possible to observe those with horizontal phase speeds lying outside this region.
We have used the HWM-93 model for computing the two components of the background neutral wind. The model re-produces the mean wind pro le for any geographic location on any day and at any time of the year. Here, we present and discuss the use of this model in computing the blocking diagrams for a given site—in this case, Allahabad—for dif-ferent altitudes. The results of new imaging measurements (Pragatiet al., 2010) have been compared with the model computation to study the wind ltering effect on the prop-agation characteristics of gravity waves. These are the rst imaging observations of gravity waves from this latitude re-gion in India.
2.
The All-sky Imaging System
The nighttime airglow observations were carried out at Allahabad, using an all-sky imager, between January and May 2008. The all-sky imaging system has three
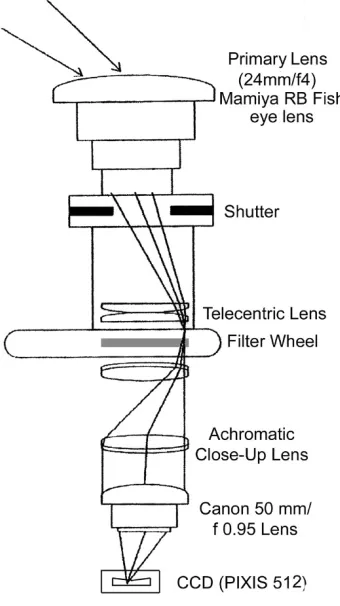
compo-Fig. 1. Schematic of the optical ray paths of the all-sky imager.
nents: an optical system, a detector, and an operating note-book PC (hp). A schematic diagram of the optical layout of the all-sky imager is presented in Fig. 1. The optical system collects light from a 180◦ eld of view with a Mamiya RB sheye lens that has focal length of 24 mm and a focal ratio of 4. The collected light beam is collimated by a telecen-tric optical plano-convex lens combination to pass through a narrow-band lter with nearly⊥incidence angles. Six lters were used among six lter positions of a lter drum. The six lters installed in the lter wheel are to allow the transmission of OI 630-nm, OI 557.7-nm, 840-nm, 846-nm, and OH Meinel bands at 720–910 nm and the transmission of background light at 857 nm. The OI lters have 2.0-nm band widths, while the OH lter has blocking between 850 and 870 nm with 87% transparency, with a notch at 868 nm to avoid O2 (0,1)atmospheric bands. The maximum alti-tudes of OI 630.0-nm, OI 557.7-nm, and OH Meinel band emissions are 250, 97, and 87 km, respectively. The colli-mated beam after the lter (diameter∼69 mm) is fed to a Canon camera lens (50 mm, f/0.95) mounted onto the CCD camera to make an image onto the CCD detector’s active image area. The detector is a thermo-electrically cooled CCD camera (PIXIS 512) kept at a temperature of−70◦ to reduce the thermal noise. The CCD chip has 512×512 square pixels of 24μm. The lter wheel and camera shutter are controlled by a notebook PC (hp) with the Windows XP operating system. WINVIEW software was used.
3.
Image Processing for Spectral Analysis
Table 1. OH data analysis for February, March, April and May, 2008.
Date Day number Wave propagation time Wave azimuth Observed phase speed Horizontal wavelength
(h) (±5◦) (m/s) (km)
February 03, 2008 34 00:10–00:52 260 43±2 14
February 15, 2008 46 01:21–02:16 30 22±1 13
March 03, 2008 63 00:06–01:19 45 (localized) 10±2 10
March 09, 2008 69 21:50–22:25 220 18±2 10
March 27, 2008 (25) 87 20:00–20:48 260 36±2 37
March 27, 2008 (27) 87 21:26–22:41 300 35±1 34
April 02, 2008 93 20:34–21:55 10 37±2 17
April 07, 2008 OH1 98 20:33–22:54 45 40±2 20
April 10, 2008 101 01:51–02:31 40 12±2 11
April 10–11, 2008 101–102 23:24–00:04 30 31±1 24
April 12, 2008 103 00:40–01:56 15 28±2 15
April 29, 2008 120 01:09–02:31 45 36±1 15
April 30, 2008 121 02:49–03:08 40 48±1 16
May 01, 2008 122 20:05–21:45 20 40±2 20
the horizontal distancerfrom the station and the azimuth) is given geometrically by Kubotaet al.(2001) as
r=RE.α
and
α=θ−sin−1(RE.sinθ/(RE+hm))
where RE is the radius of the earth andhm is the altitude of the airglow emission layer. Coordinate transformation facilitates the measurement of the direction and velocity of movement of airglow structures (Garciaet al., 1997).
In the case presented here, we have converted the sh-eye lens image into an image in geographic coordinates as-suming 87 km (hm) to be the altitude of the OH layer. Af-ter processing the all-sky images, from a warped image to an unwarped one, the gravity wave parameters, horizontal wavelength, period, phase velocity, and propagation direc-tion are retrieved from successive images by knowing the size of the images transformed into the geographical coor-dinates and the time difference of two sequential images, respectively (Maekawa, 2000). The imager eld of view with 75◦zenith angle is 500 km in diameter at an altitude of 87 km.
4.
Observations and Results
4.1 OH nightglow observations
Nightglow observations of OH Meinel bands (wave-length spread=550.0 nm–4.4 μm) were carried out at a tropical station, K.S.K.G.R.L. Allahabad, India using an all-sky CCD-based imaging system. The nightglow obser-vations on clear moonless nights centred around the new moon period between 2000 hours and 0500 hours (total observation time: 9 h) on successive days during January, February, March, April, and May, 2008. Wave structure was detected at almost all azimuths up to a range of∼600 km (limited by the local horizon and assuming emission alti-tude of 87 km) on 21 occasions during this time. In our study, we analyzed only 16 nights of quality data on the observed gravity wave phenomena, discarding the night-glow observations during this period that were contami-nated with clouds. The gravity wave structure showed a
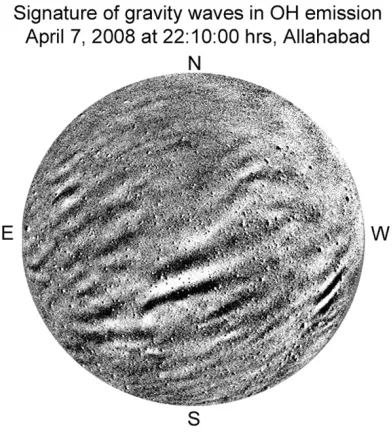
Fig. 2. Signature of gravity waves observed at Allahabad in OH emission on the night of April 7, 2008.
well-de ned OH-pattern, with near east-west-aligned wave fronts extending over the whole camera eld of view. The data were rst analyzed to determine the geographic loca-tion and orientaloca-tion of the wave patterns; in doing so, we also determined the horizontal phase speeds and horizontal wavelengths. Then, for each display (assuming the emis-sion height of 87 km), we determined the average horizon-tal wavelengths and velocities. Some of the results obtained are summarized in Table 1, which lists the azimuth of the wave motions (i.e., the normal to the wave fronts) together with their date, timings, observed phase speeds, and hori-zontal wavelengths for 14 of the displays recorded (Pragati et al., 2010). It was usually easier to determine the orienta-tion and direcorienta-tion of the moorienta-tion of the wave pattern than to accurately measure the speed of the wave motions.
4.2 OI 557.7-nm nightglow observations
Fig. 3. Signature of gravity waves observed in OI 557.7-nm images on April 21, 2009 at Kolhapur. The image at the center shows an example of wave breaking at 0105:47 hours.
(a) Raw image (b) Processed image
Fig. 4. Signature of gravity waves observed at Allahabad in the OI 557.7-nm images at 22:48:36 hours on the night of April 25, 2009. (a) raw image, (b) processed image.
74.2◦E) and Allahabad stations, but these signatures were not recorded in the OI 630.0-nm and OH images. Figure 3 shows three sequential OI 557.7-nm images observed at Kolhapur on the night of April 20–21, 2009. They were spread over a distance of more than 400 km at an alti-tude of 97 km. The gravity wave fronts were observed to be aligned along the north-west to south-east direction at 00:47:48 hours. At the center of the image, the breaking of the wave fronts can be seen to take place at 01:05:47 hours on April 21, 2009. Thereafter, their propagation in the south-west direction slows down. However, the align-ment of the wavefronts changes during the course of night. The wavelengths varied between 30 and 40 km.
Figure 4 shows the signature of gravity waves observed at Allahabad in the OI 557.7-nm images obtained on the night of April 25, 2009. These waves were prominent in the
east portion of the sky and were moving in the north-east direction. Based on consecutive images, we inferred the phase velocity of the waves to be 50 m/s; the wave-length and periodicity of the waves were 38 km and 13 min, respectively. These values are the signature of short-period atmospheric gravity waves at an altitude of 97 km.
4.3 Wind profiles for the Allahabad station
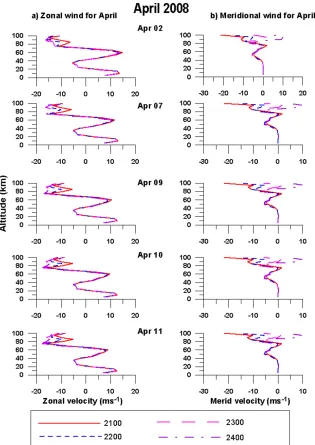
Fig. 5. Two components (zonal and meridional) of wind velocity computed from the HWM-93 model during the period of observation of gravity waves at Allahabad in April 2008 showing the effect of change in the local time as a function of altitude.
1990). The HWM-93 model adopted by us for determining the total velocity component is an empirical model of the horizontal neutral wind (Vm andVz) in the upper thermo-sphere. It is based on wind data obtained from the AE-E and DE-2 satellites. A limited set of vector spherical har-monics is used to describe the zonal and meridional wind components. The first edition of the model, released in 1987, was extended for winds above an altitude of 220 km with the inclusion of wind data from a ground-based inco-herent scatter radar and Fabry-Perot optical interferometer. HWM-90 was extended down to 100 km and uses mf/meter data; HWM-93 was extended down to the ground solar cy-cle variations. Variations with magnetic activity (Apindex), including mid- and low-latitude data, are reproduced by the model.
The model describes the transition from predominantly diurnal variation in the upper thermosphere to semi-diurnal variation in the lower thermosphere and the transition from
merid-ional winds varied substantially. The maximum value for the zonal component of the wind was∼15 m/s around 60 km, and the maximum value of the meridional component was∼ −20 m/s around 90 km.
4.4 The model for critical level blocking
The observations revealed the spatial and temporal prop-erties for the wave, but with a distinct tendency toward pref-erential directions of motion which varied from month to month. The apparent asymmetry in the propagation head-ings of the gravity waves is due to the presence of critical layers, which can occur at any height level where the hori-zontal wave vector equals the horihori-zontal phase velocity and the intrinsic frequency is Doppler-shifted to zero. A hori-zontal surface region can be constructed at the critical layer height to obtain a polar plot (“a blocking diagram”) showing the range of azimuthal angles and speeds of gravity waves that are blocked from further upward propagation (Ryan, 1991). Gravity waves with horizontal phase speeds and di-rections within this region would encounter heavy absorp-tion from a large number of diverse and relatively unstruc-tured mechanisms (Booker and Bretherton, 1967; Hazel, 1967; Jones, 1968; Fritts and Geller, 1976; Fritts, 1978; He et al., 1990) as they approach the critical layer. A horizon-tal surface can be constructed at the critical layer altitude to obtain a polar plot. Gravity waves with horizontal phase ve-locities outside this region would not encounter any critical layer and should be observable.
The Doppler-shifted frequency,, due to the horizontal windVois given by
=ω−kx.Vox (1)
whereω is the source frequency, kx is the magnitude of
the horizontal wave vector, and Vox is the component of
Voalong wave propagation direction. Equation (1) can be rewritten as
=ω(1−Vox/vx) (2)
Where vx, is the observed horizontal phase speed of the
wave. Consequently, at the critical layer, whenVox → vx,
→0. According to Wang and Tuan (1988), Eq. (2) can be expressed in terms of the zonal and meridional compo-nents as
=ω
1− Vzcosφ+Vmsinφ
vx
(3)
where Vz and Vm are the zonal and the meridional wind components, respectively.
Using the condition given in Eq. (3) de ned by≤ 0, the blocking diagrams (forbidden regions) were prepared for each month using two components of wind pro le (HWM-93) derived for the Allahabad station with the ap-propriate parameters (Ap,F10.7 cmvalues) during the period of observation of gravity waves at any height below the peak of the OH layer for each propagation directionφand phase speedvx. Although downward re ection from any critical
layer can be signi cant (Heet al., 1990), they do not af-fect the OH layer if the sources are located in the lower atmosphere. Polar plots (blocking diagrams) withvxas the
radius andφ as the polar angle were then constructed to determine which directions and magnitudes are blocked in terms of gravity wave propagation up to OH altitudes. As expected, the plot shows the “forbidden” region for wave
Fig. 7. Blocking diagram for March 2008 at Allahabad. Parameters: altitude, 80 km; time 20:00 hours.
propagation due to the strong winds in the stratosphere and lower mesosphere. The blocking region restricts all prop-agating gravity waves with observed phase speeds below a critical value.
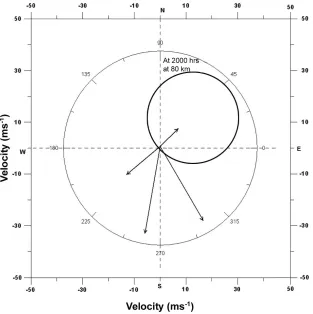
Figure 6 shows the blocking diagram for April at local midnight for the observation site. The gure was computed for a height of 85 km, which is just below the nominal peak of the OH emission (∼87 km, thickness 8 km), and the plot therefore represents the cumulative effects of wave blocking for all heights up to and including the base of the OH layer. The circular nature of the plot indicates the restricted regions for wave propagation. Added to this plot is another polar plot which represents the horizontal propagation direction of gravity waves in the north-east direction along with their magnitudes recorded during the month of April.
In March, four wave displays and four velocity measure-ments were made (see Table 1). Figure 7 represents the blocking diagram for the month of March. It can be seen that the waves propagate in the north-east direction for only one day; for the remaining three days of observation the propagation is in the south-west direction. On two occa-sions (March 2 and 4), localized gravity waves were ob-served. The horizontal phase velocity and horizontal wave-length could not be determined on March 4 because the im-age obtained was faint.
5.
Discussion
The spatial and temporal properties of the wave motions observed are typical of the low-latitude nightglow displays. These displays have occassionally been observed with a time period of<19 min and having a horizontal phase ve-locity<48 m/s and a horizontal wavelength<39 km. Al-though individual sources for the waves have been dif cult to locate, there are a number of factors that satisfactorily ex-plain the sources. There is almost a complete agreement be-tween the image measurements and the model predictions, and between the predicted and observed directions of wave propagation. This agreement suggests that the middle atmo-spheric winds can play an important role in governing the ux and azimuthal propagation distribution of short-period wave energy reaching the upper atmosphere.
Fig. 8. Blocking diagram for April at 85 km, showing the effects of changing time on the blocking area of the plot.
Fig. 9. Three-dimensional blocking diagram from an altitude of 20 to 100 km for April, 2008 at 22:00 hours.
lower atmosphere. It is possible that some of the waves may survive the critical layers and reach higher altitudes.
The two factors which govern the wave propagation di-rection in the mesopause region are (1) its source location in the lower atmosphere relative to the observer and (2) the background mean wind field in the stratosphere and meso-sphere. Gravity waves propagating upward from the lower atmosphere are absorbed into the mean flow as they ap-proach a critical layer where the intrinsic frequency of the
wave is Doppler-shifted to zero. This situation may occur at any height when the local horizontal wind speed along the direction of propagation equals the apparent horizon-tal phase speed of the gravity wave. Gravity waves with horizontal phase velocities outside of this region would not meet, by chance, a critical layer and should be observable. The absence of waves toward the south-west in April indi-cates that there was little wave source to the north-east of the observer.
Hapgood (1988) also identi ed thunderstorms as a source of short-period gravity waves.
6.
Summary and Conclusions
Atmospheric gravity waves play an important role in the dynamics and energetics of the mesosphere, thermosphere, and ionosphere. To understand these wave phenomena we carried out imaging observations with a CCD-based All-sky imager at Allahabad and Kolhapur on clear moonless nights between January and May 2008 and in April 2009. The characteristics of the horizontal propagation parameters (time period, phase velocity, and wavelength) of the gravity waves have been inferred from OH and OI 557.7-nm im-ages. The effect of attenuation or the ltering of gravity waves by neutral wind ow has been also studied.
(1) The theory of gravity wave absorption at critical lay-ers is well-developed. Gravity waves propagating energy upward from the lower atmosphere are absorbed into the mean ow as they approach the critical layer where the in-trinsic frequency of the wave is Doppler-shifted to zero. Gravity waves can propagate upwards only when the prop-agation direction of gravity wave is opposite to the neutral wind direction. All-sky images of the near-infrared OH emission is well suited for this study as they provide rea-sonable estimates of the direction of motion and the appar-ent speed of the waves reaching the upper atmosphere. The observations reported here show very good agreement be-tween the observed and the permitted wave azimuths and speeds. For the month of April 2008, the blocking region was in south-west direction, and the waves were propa-gating towards the north-east direction. The anisotropy in propagation direction in March and April may be due to a wave- ltering effect, which is in agreement with the nd-ings of Tayloret al.(1993). The blocking region also var-ied as a function of time and altitude. There is, however, an overall consistency between the observed GW propagation and the blocking diagrams. The theory of the ltering ef-fect of a gravity wave by its absorption into the mean wind ow at a critical layer is valid only when the background wind through which wave is propagating is somewhat sta-ble (Richardson’s number, Ri, of the background medium is greater than 1/4). When there is a steep vertical gradi-ent of wind ow, wind pro les may become unstable, caus-ing refraction or over-re ection of the upward propagatcaus-ing gravity wave (Tayloret al., 1993).
(2) As most of the wave propagation was in the north-east direction, it is possible that for few months each year the direction is reversed and waves may propagate in other directions (south-west). Thus, in order to obtain a lucid un-derstanding of the gravity wave propagation throughout the year, we need a larger data base. It is important to have a large number of measurements of gravity waves span-ning different months at the observation site, Allahabad, to con rm the ndings of the current wave lter theory. This would enable the apparent change in the drift speed direc-tions to be studied for both the summer and winter period. In future studies, it may also be possible to study the signa-ture of gravity wave simultaneously in OI 557.7-nm emis-sions (∼97 km). The OI data can provide support and evi-dence for wave ltering by winds. Sunet al.(2007) recently
studied the lter effects of the background winds on the propagation of gravity waves using a 3D transfer function model. They concluded that the gravity waves travel easily in the anti-windward direction, primarily because the prop-agation distance of gravity wave packets along the winds is longer than that against the winds. This leads to a higher energy loss when gravity waves are propagating along the winds than against the winds in the same altitude range. The results showed that the atmospheric winds may act as a directional lter that would permit gravity wave packets propagating against the winds to reach evene ionospheric height with a minimum energy loss and minimum travel time. Therefore, with directional ltering by the winds, the action of the atmospheric processes seems to favor those gravity wave packets that take the minimum time to reach the ionosphere. Other components of gravity waves are also ltered by the viscosity and thermal conduction of the atmo-sphere as well as by the background winds when the gravity waves propagate upward to higher altitudes.
Acknowledgments. The Department of Science and Technology (DST), Govt. of India, New Delhi funded the research in Upper Atmospheric Sciences in IIG. The night airglow observations at Kolhapur were carried out under the scienti c collaboration pro-gram (MoU) between IIG, Panvel, and Shivaji University, Kolha-pur.
References
Booker, J. R. and F. P. Bretherton, The critical layer for internal gravity waves in a shear ow,J. Fluid Mech.,23, 513–520, 1967.
Chandra, S. E., E. Fleming, M. Schoeberi, and J. J. Barett, Monthly mean global climatology of temperature, wind, geo potential height, and pres-sure for 0-120 km,Adv. Space Res.,10(6), 3–12, 1990.
Cowling, D. H., H. D. Webb, and K. C. Yeh, Group rays of internal gravity waves in a wind-strati ed atmosphere,J. Geophys. Res.,76, 213–220, 1971.
Ding, F., W. Wan, and H. Yuan, The in uence of background winds and attenuation on the propagation of atmospheric gravity waves,J. Atmos Terr. Phys.,65, 857–869, 2003.
Fleming, E. and S. Chandra, Equatorial zonal wind in the middle atmo-sphere derived from geo potential height and temperature data,J. Atmos. Sci.,46(6), 860–866, 1989.
Fleming, E., S. Chandra, M. Shoeberi, and J. Barnett, Monthly mean global climatology of temperature, wind, geo potential height, and pressure for 0-120 km,NASA Tech. Memo. 100697, 1988.
Forbes, J. M., Atmospheric tides, 1. Model description and results for the solar diurnal component,J. Geophys. Res.,87(A7), 5222–5240, 1982a. Forbes, J. M., Atmospheric tides, 2, the solar and lunar semi diurnal
com-ponents,J. Geophys. Res.,87(A7), 5241–5252, 1982b.
Fritts, D. C., The nonlinear gravity wave critical level interaction,J. Atmos. Sci.,35, 397–413,1978.
Fritts, D. C. and M. A. Geller, Viscous stabilization of gravity wave critical level ows,J. Atmos. Sci.,33, 2276–2284, 1976.
Garcia, F. J., M. J. Taylor, and M. C. Kelly, Two dimensional spectral anal-ysis of mesospheric airglow image data,Appl. Optics,36(29), 7374– 7385, 1997.
Hapgood, M. A. and M. J. Taylor, Analysis of gravity wave image data,
Ann. Geophys.,8, 805–813, 1982.
Hazel, P., The effect of viscosity and heat conduction on internal gravity waves at a critical layer,J. Fluid Mech.,30, 775–786, 1967.
He, F., T. F. Tuan, R. Picard, and J. Isler, Optical model analysis of gravity waves re ection from critical layers,EOS Trans. AGU,71, 1495–1496, 1990.
Hedin, A. E., E. L. Fleming, A. H. Manson, F. G. Schmidlin, S. K. Avery, R. R. Clarck, S. J. Franke, G. J. Fraser, T. Tsuda, F. Vial, and R. A. Vincent, Empirical wind model for the upper, middle and lower atmosphere,J. Atmos. Terr. Phys.,58, 1421–1427, 1996.
Hines, C. O., Internal atmospheric gravity waves at ionospheric heights,
Jones, W. L., Re ection and stability of waves instably strati ed uids with shear ow: A numerical study,J. Fluid Mech.,34(3), 609–624, 1968. Kubota, M., H. Fukunishi, and S. Okano, Characteristics of medium and
large scale TIDs over Japan derived from OI 630 nm nightglow obser-vation,Earth Planets Space,53, 741–751, 2001.
Maekawa, R., Observations of gravity waves in the mesopause region by multicolor airglow imaging, Master Thesis, Kyoto University, 2000. Medeiros, A. F., M. J. Taylor, H. Takahashi, P. P. Batista, and D. Gobbi,
An investigation of gravity wave activity in the low-latitude upper mesosphere: propagation direction and wind ltering,J. Geophys. Res., 108(D14), 4411–4419, 2003.
Medeiros, A. F., R. A. Buriti, E. A. Machado, M. J. Taylor, H. Takahashi, P. P. Batista, and D. Gobbi, Comparison of gravity wave activity observed by airglow imaging from two different latitudes in Brazil,J. Atmos. Sol. Terr. Phys.,66(6–9), 647–655, 2004a.
Medeiros, A. F., H. Takahashi, P. P. Batista, D. Gobi, and M. Taylor, Observation of atmospheric gravity waves using airglow all-sky CCD imager at Cachoeira Paulista (23.1◦S, 45.1◦W),Geof´ısica Int.,43(1), 29–39, 2004b.
Mukherjee, G. K., The signature of short period gravity waves imaged in OI 557.7 nm and near infrared OH nightglow emissions over Panhala,
J. Atmos. Sol. Terr. Phys.,65, 1329–1335, 2003.
Nakamura, T., T. Tsuda, R. Maekawa, M. Tsutsumi, M. J. Taylor, and M. A. Hapgood, Identi cation of a thunderstorm as a source of short period gravity waves in the upper atmospheric nightglow emission,Planet Space Sci.,36, 975–985, 1988.
Nakamura, T., A. Higashikawa, T. Tsuda, and Y. Matsushita, Seasonal variations of gravity wave structures in OH airglow with a CCD imager at Shigaraki,Earth Planets Space,51, 897–906, 1999.
Nakamura, T., T. Aono, T. Tsuda, A. G. Admiranto, E. Achmad, and Suranto, Mesospheric gravity waves over a tropical convective region observed by OH airglow imaging in Indonesia, Geophys. Res. Lett., 30(17), 1882–1885, 2003.
Pragati Sikha, R., N. Parihar, Rupesh Ghodpage, and G. K. Mukherjee, Observations of Gravity Waves in the upper mesosphere region by near infrared Airglow Imaging,Current Sci.,98(3), 392–397, 2010. Ryan, E. H., Critical layer directional ltering of atmospheric gravity
waves: A comparison of airglow observation and a wind pro le model, M.Sc. thesis, The University of Cincinnati, Ohio, 1991.
Sun, L., W. Wan, F. Ding, and T. Mao, Gravity wave propagation in the realistic atmosphere based on a three dimensional transfer function model,Ann. Geophys.,25, 1979–1986, 2007.
Taylor, M. J. and M. A. Hapgood, Identi cation of a thunderstorm as a source of short period gravity waves in the upper atmospheric nightglow emission,Planet Space Sci.,36, 975–985, 1988.
Taylor, M. J., E. H. Ryan, T. F. Tuan, and R. Edwards, Evidence of prefer-ential direction of gravity wave propagation due to wind ltering effect in the middle atmosphere,J. Geophys. Res.,98, 6047–6057, 1993. Taylor, M. J., W. R. Pendleton Jr., S. Clark, H. Takahashi, D. Gobbi, and
R. A. Goldberg, Image measurements of short-period gravity waves at equatorial latitudes,J. Geophys. Res.,102(D22), 26,283–26,299, 1997. Wang, D. Y. and T. F. Tuan, Brunt Doppler ducting of small-period gravity
waves,J. Geophys. Res.,93(A9), 9916–9926, 1988.