Testing of almost all the hadronic interaction models by comparing calculated
muon energy spectrum with data
L. G.Dedenko1,2,∗,A.V.Lukyashin3,4,∗∗,T. M.Roganova2,∗∗∗, andG. F.Fedorova2,∗∗∗∗
1Faculty of Physics M.V. Lomonosov Moscow State University, Leninskie Gory, 119991 Moscow, Russia 2Skobeltsyn Institute of Nuclear Physics, Lomonosov Moscow State University, 119234 Moscow, Russia
3Institute for Theoretical and Experimental Physics named by A.I. Alikhanov of National Research Center "Kurchatov Institute", 117218 Moscow, Russia
4National Research Nuclear University (MEPhI) Moscow Engineering Physics Institute, 115409 Moscow, Russia
Abstract. Uncertainties of the model energy spectra of the most energetic secondary charged mesons are discussed. Computer simulations of the partial energy spectra of the atmospheric vertical muons induced by primary cosmic particles with various fixed energies in terms of hadronic interactions models had been carried out with the help of the CORSIKA package. These partial spectra have been convolved with the contemporary spectra of the primary cosmic particles in the energy range 0.1-10 000 TeV. Results of simulations are compared with the contemporary data of the atmospheric vertical muon flux. Comparison shows that all models underes-timate the production of secondary chargedπ±-mesons (andK±-mesons) by a factor of∼1.4÷2 at the highest energies. This underestimation induces a more rapid development of extensive air showers in the atmosphere and results in uncertainties in estimates of energy and composition of the primary cosmic particles.
1 Introduction
Extensive air showers (EAS) are the only tool to under-stand the origin and composition of cosmic rays, their possible sources and the transport of cosmic particles in various magnetic fields on their way to the Earth at very high energies. All features of the energy spectrum, ar-rival directions and composition of the primary cosmic particles should be determined through an analysis of the EAS data. These data as signals in the surface and under-ground detectors are usually interpreted in terms of vari-ous models of hadronic interactions [1–9]. It happened, that such interpretation leads to some inconsistency. As an example, the energy of showers calculated in terms of the QGSJET II-03 [3] model with the help of the sur-face detectors signals at the Telescope Array [10] hap-pened to be 1.27 times lager than this energy estimated with help of the fluorescence light. To ensure that re-sults of such interpretation are as accurate as possible these models should be thoroughly tested. Usually these mod-els are tested with the help of accelerator data at small values (∼0) of the pseudorapidity, η, where most of
sec-ondary particles (mainly mesons) are produced [11–13]. However, calculations have shown that the maximal en-ergy flow carried by secondary particles occurs at much larger values (∼8-10) of the pseudorapidityη[14]. Let us
also note that the longitudinal development of EAS
de-∗e-mail: [email protected] ∗∗e-mail: [email protected] ∗∗∗e-mail: [email protected]
∗∗∗∗e-mail: [email protected]
pends strongly on the rate of the projectile particle en-ergy fragmentation. The atmospheric muon flux also de-pends strongly on this production of the highest energy mesons. So, it is of primary importance to verify a pro-duction of the most energetic mesons simulated in terms of various models. This verification may be carried out by comparing model predictions of these muon fluxes with data. We select the classical experiments L3+Cosmic [15],
ap-102 103 104 105 106 107
103
104
Approximation
AMS-02 ATIC-2 PAMELA CREAM KASCADE KASCADE-Grande TA (All particles) KASCADE (All particles) KASCADE-Grande (All particles) ARGO-YBJ (Assumption) ARGO-FWCTA (Assumption) Tunka Tunka (All particles)
IceCube IceCube (All particles)
•
E, GeV
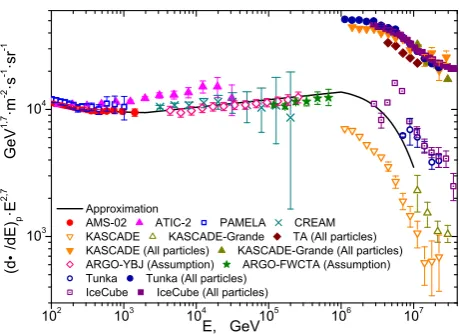
Figure 1. Energy spectra of the primary protons. Solid line
-suggested approximation. All particle spectra depends on the energy per particle.
proximations for the energy spectra of the primary protons and helium nuclei to estimate convolutions with the partial muon spectra. Thus, with the help of any of the interaction models [1–9], the CORSIKA package and approximations of data on fluxes of the primary cosmic nuclei [21–31] one can predict the energy spectra of atmospheric vertical high energy muons at sea level. These predictions can be com-pared with data observed by the L3+Cosmic, MACRO and
LVD collaborations at energies above 100 GeV. Finally, some conclusion can be drawn about the validity of vari-ous models.
In fact, some low energy models with the FLUKA package [33] have been tested in such a way. We are sorry that some our results of models testing in [34–36] are not correct. We do apologize for our mistake in input data for the atmosphere.
In this paper the eight models: QGSJET01 [1], QGSJET II-03, QGSJET II-04 [4], DPMJET 2.55 [5], VENUS 4.12 [6], EPOS LHC [7, 8], SIBYLL 2.1 and SIBYLL 2.3 [9] have been tested. A comparison of muon data observed in [15–18] with results of simulations al-lows to draw a conclusion about the most energetic meson production described by these models.
2 Method
To estimate the energy spectraD(Eµ) of atmospheric
ver-tical muons in the energy range of 102 −105 GeV we need to know the energy spectra dIp/dE and dIHe/dE
of the primary protons and helium nuclei within the en-ergy interval 102−107 GeV and the partial energy spec-tra Sp(Eµ,E) and SHe(Eµ,E) of the vertical muons in EAS induced by the primary protons and helium nu-clei with various fixed energies,E. Simulations of these partial muon spectra have been carried out in terms of the QGSJET01, QGSJET II-03, QGSJET II-04, DPM-JET 2.55, VENUS 4.12, EPOS LHC, SIBYLL 2.1 and SIBYLL 2.3 hadronic interaction models in the same en-ergy range of 102−107GeV. The smooth approximation of the atmospheric muon data observed by the L3+Cosmic,
102 103 104 105 106 107 102
103 104
•
En, GeV Approximation
AMS-02 PAMELA CREAM ATIC-2 ARGO-YBJ (Assumption)
ARGO-FWCTA (Assumption)
Tunka IceCube KASCADE-Grande
Figure 2. Energy spectra of the primary helium nuclei. Solid
line - suggested approximation.
Table 1.Parameters of approximation for the primary nucleon
spectra.
Nuclei K1 K2 R1 R2 α s
H 0.4544 5833 45 336 2.849 2.64
He 0.1896 493 22.5 122.5 2.78 2.623
MACRO and LVD collaborations have been used for com-parison with the results of simulations.
FunctionsSp(Eµ,E) andSHe(Eµ,E) are the partial dif-ferential energy spectra of muons in showers induced by primary protons and helium nuclei with fixed values of energy E. These spectra were calculated for 24 diff
er-ent fixed values of energyEof the primary protons. The energy distributions of muons induced by primary helium nucleiSHe(Eµ,E) have also been calculated and compared with simulations based on the hypothesis of superposi-tion [37]. As direct results coincide with simulasuperposi-tions in terms of the hypothesis of superposition, we will use this hypothesis.
The energy spectra of the primary particles are impor-tant ingredients of simulations. As the energy per nucleon is of importance only the energy spectra of the primary protons and helium nuclei should be taken into account. We have used approximations (eqn. (1)) for (dIp/dE) and (dIHe/dE) based on Berezhko calculations [32] and nor-malized at AMS-02 data at 1.8 TeV [21]. Figures 1 and 2 demonstrate how these approximations fit the data [21– 31].
To take into account a possible change of primary spectrum above the "knee" at energies above E1 106 GeV for the primary protons and helium nuclei we have used an additional exponential multiplier. The values of parameters for these new approximations are listed in Ta-ble 1. For primary protonsβ=5.5417 andγ=0.024. For
primary helium nucleiβ=4.4074 andγ=0.027.
102 103 104 105 106 107
103
104
Approximation
AMS-02 ATIC-2 PAMELA CREAM KASCADE KASCADE-Grande TA (All particles) KASCADE (All particles) KASCADE-Grande (All particles) ARGO-YBJ (Assumption) ARGO-FWCTA (Assumption) Tunka Tunka (All particles)
IceCube IceCube (All particles)
•
E, GeV
Figure 1. Energy spectra of the primary protons. Solid line
-suggested approximation. All particle spectra depends on the energy per particle.
proximations for the energy spectra of the primary protons and helium nuclei to estimate convolutions with the partial muon spectra. Thus, with the help of any of the interaction models [1–9], the CORSIKA package and approximations of data on fluxes of the primary cosmic nuclei [21–31] one can predict the energy spectra of atmospheric vertical high energy muons at sea level. These predictions can be com-pared with data observed by the L3+Cosmic, MACRO and
LVD collaborations at energies above 100 GeV. Finally, some conclusion can be drawn about the validity of vari-ous models.
In fact, some low energy models with the FLUKA package [33] have been tested in such a way. We are sorry that some our results of models testing in [34–36] are not correct. We do apologize for our mistake in input data for the atmosphere.
In this paper the eight models: QGSJET01 [1], QGSJET II-03, QGSJET II-04 [4], DPMJET 2.55 [5], VENUS 4.12 [6], EPOS LHC [7, 8], SIBYLL 2.1 and SIBYLL 2.3 [9] have been tested. A comparison of muon data observed in [15–18] with results of simulations al-lows to draw a conclusion about the most energetic meson production described by these models.
2 Method
To estimate the energy spectraD(Eµ) of atmospheric
ver-tical muons in the energy range of 102 −105 GeV we need to know the energy spectra dIp/dE and dIHe/dE
of the primary protons and helium nuclei within the en-ergy interval 102−107 GeV and the partial energy spec-tra Sp(Eµ,E) and SHe(Eµ,E) of the vertical muons in EAS induced by the primary protons and helium nu-clei with various fixed energies,E. Simulations of these partial muon spectra have been carried out in terms of the QGSJET01, QGSJET II-03, QGSJET II-04, DPM-JET 2.55, VENUS 4.12, EPOS LHC, SIBYLL 2.1 and SIBYLL 2.3 hadronic interaction models in the same en-ergy range of 102−107GeV. The smooth approximation of the atmospheric muon data observed by the L3+Cosmic,
102 103 104 105 106 107 102 103 104 •
En, GeV Approximation
AMS-02 PAMELA CREAM ATIC-2 ARGO-YBJ (Assumption)
ARGO-FWCTA (Assumption)
Tunka IceCube KASCADE-Grande
Figure 2. Energy spectra of the primary helium nuclei. Solid
line - suggested approximation.
Table 1.Parameters of approximation for the primary nucleon
spectra.
Nuclei K1 K2 R1 R2 α s
H 0.4544 5833 45 336 2.849 2.64
He 0.1896 493 22.5 122.5 2.78 2.623
MACRO and LVD collaborations have been used for com-parison with the results of simulations.
FunctionsSp(Eµ,E) andSHe(Eµ,E) are the partial dif-ferential energy spectra of muons in showers induced by primary protons and helium nuclei with fixed values of energy E. These spectra were calculated for 24 diff
er-ent fixed values of energyEof the primary protons. The energy distributions of muons induced by primary helium nucleiSHe(Eµ,E) have also been calculated and compared with simulations based on the hypothesis of superposi-tion [37]. As direct results coincide with simulasuperposi-tions in terms of the hypothesis of superposition, we will use this hypothesis.
The energy spectra of the primary particles are impor-tant ingredients of simulations. As the energy per nucleon is of importance only the energy spectra of the primary protons and helium nuclei should be taken into account. We have used approximations (eqn. (1)) for (dIp/dE) and (dIHe/dE) based on Berezhko calculations [32] and nor-malized at AMS-02 data at 1.8 TeV [21]. Figures 1 and 2 demonstrate how these approximations fit the data [21– 31].
To take into account a possible change of primary spectrum above the "knee" at energies above E1 106 GeV for the primary protons and helium nuclei we have used an additional exponential multiplier. The values of parameters for these new approximations are listed in Ta-ble 1. For primary protonsβ=5.5417 andγ=0.024. For
primary helium nucleiβ=4.4074 andγ=0.027.
The approximation parameters: R1,R2,α, s,βandγ are dimensionless. ParametersK1andK2are dimensional as [1/(GeV ·m2·s·sr)]. The notation E is the kinetic energy per nucleon in GeV.
dI dE =
K1·RE1
−α
·1+RE
2
βγ
E∈102÷1.8·103GeV
K2·E−s E∈1.8·103÷106GeV
K2·E−s·exp−(E−10
6)
6·106
E∈106÷107GeV (1) The CORSIKA 7.4 package (CORSIKA 6.9 in the case of DPMJET 2.55 and QGSJET II-03 models and COR-SIKA 7.56 in the case of SIBYLL 2.3 model) have been used to simulate the second important ingredients - the partial energy spectraSp(Eµ,E) andSHe(Eµ,E) of verti-cal muons in showers induced by the primary protons and helium nuclei with various fixed energies, E, in terms of the eight models in the energy range 102−105 GeV with statistics 106events for the most energetic muons.
The results of these calculations in the energy range 102−107GeV were interpolated for 100 values of energies E with equal intervals in decimal logarithmic scale. The energy interval 102−105GeV of muons was divided into 60 equal bins also in decimal logarithmic scale. So, the width of the bin was equal toh=lg(Eµ,(i+1)/Eµ,i)=0.05. Let us note that average muon energies for the 1st, 21stand 41stbins we will use later are equal to 1.059·102, 1.059· 103and 1.059·104GeV respectively. In fact simulations for helium nuclei have been carried out only for energies 104 and 106 GeV to test the hypothesis of superposition. As results of simulations for the primary nuclei showed a good agreement with this hypothesis we have used this hypothesis to estimate the flux of the nucleons from the primary helium nuclei.
The energy spectraDp(Eµ) andDHe(Eµ) of muons for
primary protons and helium nuclei are calculated as inte-grals of products of functions Sp(Eµ,E) and SHe(Eµ,E) with corresponding intensitiesdIp/dEanddIHe/dEof the
primary protons, on energyEof primary nucleons.
Dp(Eµ)=
dIp dE
·Sp(Eµ,E)·dE (2)
DHe(Eµ)= dIHe
dE
·SHe(Eµ,E)·dE (3)
The resulting energy spectrum of atmospheric muons is the sum of these energy spectra of muons produced by primary protons and helium nuclei.
D(Eµ)=Dp(Eµ)+DHe(Eµ) (4)
3 Results of simulations
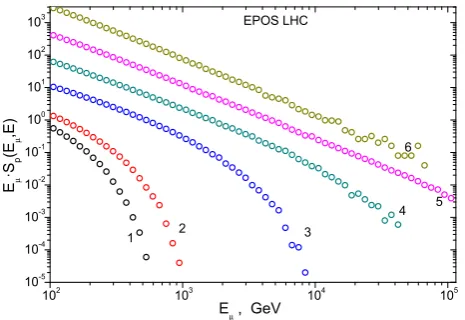
The partial energy spectra Sp(Eµ,E) of the atmospheric vertical muons simulated for various fixed energiesE of the primary protons in terms of the EPOS LHC model are shown in figure 3. It is seen that statistics of∼106at the higher energy end (tail) of the spectra is not enough.
Table 2 displays the total number of muons with en-ergies above 102and 103GeV in showers induced by pri-mary protons with energies 105and 106GeV estimated in
102 103 104 105
10-5 10-4 10-3 10-2 10-1 100 101 102 103 µ µ
Eµ , GeV EPOS LHC
1 2 3
4 5 6
Figure 3. The partial energy spectra of muons in showers
in-duced by primary protons with various fixed energies E: 1 - 5·102 GeV; 2 - 103GeV; 3 - 104 GeV; 4 - 105GeV; 5 - 106GeV; 6 -107GeV.
102 103
106 107
VENUS 4.12 SIBYLL 2.1 SIBYLL 2.3 DPMJET 2.55 EPOS LHC QGSJET-01 QGSJETII-03 QGSJETII-04
µ µ
Eµ , GeV
Figure 4. The partial energy spectra of muons in showers
in-duced by primary protons with fixed energy E=104GeV.
terms of the eight models in our simulations and in [38]. A very reasonable agreement is seen.
The next figure 4 demonstrates a comparison of the partial muon energy spectraSp(Eµ,E) calculated in terms of the eight models for a fixed energyE=104GeV of the
primary protons. The results for the SIBYLL 2.1 model are the highest, and the QGSJET01 model values are the lowest at muon energy Eµ 103 GeV. The result of the
rest of models are in between these two models.
It is important to estimate energy intervals of the pri-mary protons which contribute into various bins of the muon energy spectrum. But first some dependence of muon numbers inside the partial bins on energyEshould be illustrated.
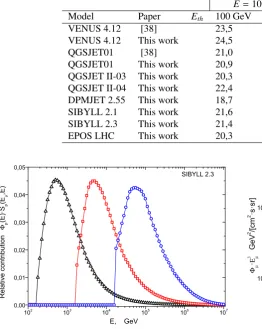
Table 2.Average number of muons with energies above the thresholdEthin showers induced by primary protons with energiesE.
E=105GeV E=106GeV
Model Paper Eth 100 GeV 1000 GeV 100 GeV 1000 GeV
VENUS 4.12 [38] 23,5 0,679 153,5 3,932
VENUS 4.12 This work 24,5 0,652 156,2 3,839
QGSJET01 [38] 21,0 0,605 132,3 3,612
QGSJET01 This work 20,9 0,593 132,8 3,490
QGSJET II-03 This work 20,3 0,592 122,8 3,301
QGSJET II-04 This work 22,4 0,613 141,3 3,584
DPMJET 2.55 This work 18,7 0,538 116,7 3,150
SIBYLL 2.1 This work 21,6 0,6 131,4 3,515
SIBYLL 2.3 This work 21,4 0,573 136,2 3,461
EPOS LHC This work 20,3 0,576 128,2 3,206
102 103 104 105 106 107
0,00 0,01 0,02 0,03 0,04 0,05
Φ
µ
E, GeV
SIBYLL 2.3
Figure 5. The energy distributions of primary protons
con-tributed to three bins with muon average energies:- 1.059·102 GeV,- 1.059·103GeV and◦- 1.059·104GeV.
for any fixed muon energyEµ. The maximal contributions
occur at energies∼5·102GeV (to the 1stbin),∼5·103 GeV (to the 21stbin) and∼5·104GeV (to the 41stbin).
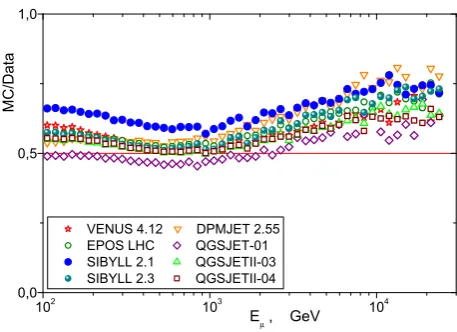
The final results of the muon energy spectraD(Eµ)
cal-culated in terms of the eight hadronic interaction models and data [15–18] are shown in figure 6. The ratios of MC simulation to data are shown in figure 7.
It should be noted that at energies above∼ 100 GeV both the simulated spectra and data are steepened. It is because the decay constant Bfor the charged mesons is equal to B ∼ 100 GeV and the probability of decay for charged mesons is decreasing at higher energies.
It should be noted that contributions to the genera-tion of muons into the 21stbin with an average energy of Eµ 103GeV are most considerable from primary
pro-tons with energyE =104GeV as shown in figure 5. So,
various models may be effectively compared at energies at
which their contributions into the muon spectrum is most considerable. Such comparison of relative contributions of the eight models to the generation of muons into the 21st bin are shown in figure 4 and corresponds to the final result in the same energy region shown in figure 7.
It is seen that calculated spectra are ∼ 2 times be-low data in the case of the QGSJET01 model and∼ 1.4
102 103 104 105
10-2 10-1
Data (Smooth Approximation) VENUS 4.12 DPMJET 2.55 EPOS LHC QGSJET-01 SIBYLL 2.1 QGSJETII-03 SIBYLL 2.3 QGSJETII-04
Φµ
Ε
3 µ
Eµ , GeV
Figure 6.The energy spectra of near vertical muons.
times below data for the SIBYLL 2.1 model. The results of DPMJET 2.55 model is∼1.86 below data at energies Eµ102GeV and∼1.36 below data at energiesEµ104
GeV. The results of QGSJET01 model is∼2 below data at energiesEµ 102GeV and∼1.7 below data at energies
Eµ104GeV. The results of SIBYLL 2.1 model is∼1.5
below data at energiesEµ 102 GeV and∼ 1.35 below
data at energies Eµ 104 GeV. The result of the rest of
models are in between these limits and slightly different
from each other by ∼10-15% . The main conclusion is quite clear. All considered models demonstrate the valu-able deficit of muons [39–43].
In this paper the muon fluxes intensities for the DPM-JET 2.55, QGSDPM-JET II-03, SIBYLL 2.3 and VENUS 4.12 models differ by∼ 2÷15% with an increase in energy
from∼ 102 GeV to∼ 104 GeV compared with the work of Ref. [42, 43] due to slightly different modified
approxi-mations of the primary cosmic ray spectrum.
4 Conclusion
Table 2.Average number of muons with energies above the thresholdEthin showers induced by primary protons with energiesE.
E=105GeV E=106GeV
Model Paper Eth 100 GeV 1000 GeV 100 GeV 1000 GeV
VENUS 4.12 [38] 23,5 0,679 153,5 3,932
VENUS 4.12 This work 24,5 0,652 156,2 3,839
QGSJET01 [38] 21,0 0,605 132,3 3,612
QGSJET01 This work 20,9 0,593 132,8 3,490
QGSJET II-03 This work 20,3 0,592 122,8 3,301
QGSJET II-04 This work 22,4 0,613 141,3 3,584
DPMJET 2.55 This work 18,7 0,538 116,7 3,150
SIBYLL 2.1 This work 21,6 0,6 131,4 3,515
SIBYLL 2.3 This work 21,4 0,573 136,2 3,461
EPOS LHC This work 20,3 0,576 128,2 3,206
102 103 104 105 106 107
0,00 0,01 0,02 0,03 0,04 0,05 Φ µ
E, GeV
SIBYLL 2.3
Figure 5. The energy distributions of primary protons
con-tributed to three bins with muon average energies:- 1.059·102 GeV,- 1.059·103GeV and◦- 1.059·104GeV.
for any fixed muon energyEµ. The maximal contributions
occur at energies∼5·102 GeV (to the 1stbin),∼5·103 GeV (to the 21stbin) and∼5·104GeV (to the 41stbin).
The final results of the muon energy spectraD(Eµ)
cal-culated in terms of the eight hadronic interaction models and data [15–18] are shown in figure 6. The ratios of MC simulation to data are shown in figure 7.
It should be noted that at energies above∼100 GeV both the simulated spectra and data are steepened. It is because the decay constant Bfor the charged mesons is equal to B ∼ 100 GeV and the probability of decay for charged mesons is decreasing at higher energies.
It should be noted that contributions to the genera-tion of muons into the 21st bin with an average energy of Eµ 103 GeV are most considerable from primary
pro-tons with energyE =104GeV as shown in figure 5. So,
various models may be effectively compared at energies at
which their contributions into the muon spectrum is most considerable. Such comparison of relative contributions of the eight models to the generation of muons into the 21st bin are shown in figure 4 and corresponds to the final result in the same energy region shown in figure 7.
It is seen that calculated spectra are ∼ 2 times be-low data in the case of the QGSJET01 model and∼ 1.4
102 103 104 105
10-2 10-1
Data (Smooth Approximation) VENUS 4.12 DPMJET 2.55 EPOS LHC QGSJET-01 SIBYLL 2.1 QGSJETII-03 SIBYLL 2.3 QGSJETII-04
Φµ
Ε
3 µ
Eµ , GeV
Figure 6.The energy spectra of near vertical muons.
times below data for the SIBYLL 2.1 model. The results of DPMJET 2.55 model is∼1.86 below data at energies Eµ102GeV and∼1.36 below data at energiesEµ104
GeV. The results of QGSJET01 model is∼2 below data at energiesEµ 102GeV and∼1.7 below data at energies
Eµ104GeV. The results of SIBYLL 2.1 model is∼1.5
below data at energiesEµ 102 GeV and∼ 1.35 below
data at energies Eµ 104 GeV. The result of the rest of
models are in between these limits and slightly different
from each other by ∼10-15% . The main conclusion is quite clear. All considered models demonstrate the valu-able deficit of muons [39–43].
In this paper the muon fluxes intensities for the DPM-JET 2.55, QGSDPM-JET II-03, SIBYLL 2.3 and VENUS 4.12 models differ by∼ 2÷15% with an increase in energy
from∼ 102GeV to∼104 GeV compared with the work of Ref. [42, 43] due to slightly different modified
approxi-mations of the primary cosmic ray spectrum.
4 Conclusion
Muons which contribute much to the muon energy spectra are produced in decays of the most energetic π±-mesons and K±-mesons generated in first interactions of the pri-mary particles with nuclei in the atmosphere. As cal-culated vertical muon energy spectra in the case of the
102 103 104
0,0 0,5 1,0
VENUS 4.12 DPMJET 2.55 EPOS LHC QGSJET-01 SIBYLL 2.1 QGSJETII-03 SIBYLL 2.3 QGSJETII-04
M
C
/D
at
a
Eµ , GeV
Figure 7.The ratio MC/DATA.
eight (QGSJET01, QGSJET II-03, QGSJET II-04, DP-MJET 2.55, VENUS 4.12, EPOS LHC, SIBYLL 2.1 and SIBYLL 2.3) hadronic interaction models are∼ 1.4÷2 times below data we can conclude that production of the most energeticπ±-mesons andK±-mesons in these models is considerably suppressed. This suppression may induce smaller values of signals in the surface scintillation detec-tors and will result in larger values of the calculated energy estimates. So, the coefficient 1.27 used by the TA
collab-oration [10] to decrease the energy estimates of showers calculated on the basis of signals in the surface detectors may be understood as a result of this suppression. The in-creased intensity of the primary particle flux observed at the Yakutsk array at super high energies [44] may also be a result of smaller values of calculated signals in surface scintillation detectors.
Acknowledgement
The authors thank N. N. Kalmykov who kindly showed alter-native calculations and A. A. Lagutin for important assistance in the verification of the results for the QGSJET01 model.
References
[1] Kalmikov N. N., Ostapchenko S. S., Phys. Atom. Nucl.Vol. 56, 346 (1993).
[2] Ostapchenko S. S., Nucl. Phys. B (Proc. Suppl.)Vol. 151, 143 (2006).
[3] Ostapchenko S. S., Phys. Rev. D.Vol. 74, 014026 ; hep-ph/0505259 (2006).
[4] Ostapchenko S. S., Phys. Rev. D. Vol. 83, 014018 (2011).
[5] Ranft J., Phys. Rev. D. Vol. 51, 64 (1995); hep-ph/9911213 (1999).
[6] Werner K., Phys. Rep.Vol. 232, 87 (1993).
[7] Werner K., Nucl. Phys. B (Proc. Suppl.)Vol. 175, 81 (2008).
[8] Werner K. Liu F. M. and Pierog T., Phys. Rev. C.Vol. 74, 044902; hep-ph/0506232(2006).
[9] Ahn E.-J., Engel R., Gaisser T. K., et al., Phys. Rev. D.Vol. 80, 094003 (2009).
[10] Abu-Zayyad T., Aida R., Allen M., et.al., (Tele-scope Array Collab.) Astrophys. J. Lett.,Vol. 768:L1, 5 (2013).
[11] Pierog T., EPJ Web of Conf.,Vol. 99, 09002 (2015). [12] Ostaphcenko S. S., Progr. of Theor. Phys. Suppl.,
Vol. 193, 204 (2012).
[13] D’Enterria D., Engel R., Pierog T., et. al., Astropart. Phys.,Vol. 35, 98 (2011).
[14] Engel R., Rebel H., Acta Phys. Polonica B.,Vol. 35, 321 (2004).
[15] Achard P. Adriani O., Aguilar-Benitez M., et al.,(L3 Collab.), Phys.Lett. B.598, 15-32; hep-ex/0408114v1K
(2004).
[16] Ambrosio M., Antolini R., Auriemma G., et al., (MACRO Collab.), Phys. Rev. D.Vol. 52, 3793 (1995). [17] Aglietta M., Alpat B., Alieva E. D., et al., (LVD Collab.), Phys.Rev. D.58, 092005; hep-ex/9806001v1
(1998).
[18] Tenholt F., et al., (Ice Cube Collab.)Proceedings of the 35th International Cosmic Ray Conference, (Busan, Korea 2017) PoS(ICRC2017) 317.
[19] Heck D., Knapp J., Capdevielle J.-N., et al., Report FZKA 6019 Forschungszentrum Karlsruhe, (1998). [20] Maurin D., Melot F. and Taillet R., Astronomy and
Astrophysics, 569, A32 (2014).
[21] Aguilar M., Aisa D., Alpat B., et al, (AMS Collab.) Phys. Rev. Lett.Vol. 114, 171103 (2015). Aguilar M., Aisa D., Alpat B., et al, (AMS Collab.) Phys. Rev. Lett.
Vol. 115, 211101 (2015).
[22] Adriani O., Barbarino G. C., Bazilevskaya G. A., et. al., (PAMELA Collab.) Advances in Space Research
Vol. 51, 219-226 (2013).
[23] Panov A. D., Adams J. H., Ahn H. S. et al. (ATIC Collab.), Bull. Russ. Acad. Sci. Phys. Vol. 71, 494 (2007); Bull. Russ. Acad. Sci. Phys. Vol. 73, 564 (2009).
[24] Ahn H. S. Allison P., Bagliesi M. G., et al (CREAM Collab.), , Astrophys.J., 707, 593 (2009).
[25] Bartoli B., Bernardini P., Bi X., et al (ARGO-YBJ Collab.) Phys. Rev. D 91, 11, 112017; arXiv:1503.07136 (2015). Di Sciascio G. et. al. (ARGO-YBJ Collab.), J. of Physics: Conf. Series632, 012089 (2015).
[26] Bartoli B., Bernardini P., Bi X., et al (ARGO-YBJ Collab.), Chinese Physics C38, 4, 045001 (2014). [27] Antoni T., Apel W. D., Badea A. F., et al.,
(KAS-CADE Collab.) Astroparticle Physics 24, p. 1-25 (2005).
[28] Apel W. D., Arteaga-Velazquez J. C., Bekk K., et al., (KASCADE-Grande Collab.) Astroparticle Physics47, p. 54-66 (2013).
[29] Prosin V. V., Berezhnev S. F., Budnev N. M., et al., (Tunka Collab.) Nuclear Instruments and Methods in Physics Research A756, p. 94-101 (2014).
Ray Conference, (The Hague, The Netherlands 2015) PoS(ICRC2015) 334.
[31] Ivanov D., et al., (Telescope Array Collab.) Proceed-ings of the 34th International Cosmic Ray Conference, (The Hague, The Netherlands 2015) PoS(ICRC2015) 349.
[32] Berezhko E. G. Nucl. Phys. B (Proc. Suppl.)Vol. 256 - 257, 23-35 (2014); Berezhko E. G., Knurenko S. P., Ksenofontov L. T., Astropart. Phys. Vol. 36 31-36 (2012).
[33] Battistoni G., Ferrari A., Muraro S., et al., Proc. Suppl. Nucl. Phys. B.Vol. 168, 286 (2007).
[34] Dedenko L. G., Roganova T. M., Fedorova G. F., JETP Lett.Vol. 100, 223 (2014).
[35] Dedenko L. G., Roganova T. M., Fedorova G. F., Phys. Atom. Nucl.Vol. 78, N10, 894-902 (2015). [36] Dedenko L. G., Lukyashin A. V., Fedorova G. F., et
al., EPJ Web of ConferencesVol. 99, 10003 (2015). [37] Dedenko L.G., Zatsepin G.T.,Calculations of some
characteristics of air showers taking fluctuations into account; Proceedings of the 6th International Cosmic
Ray Conference, (Moscow, USSR) Vol. II; Extensive air showers and cascades process, 201-208 (1960). [38] Lagutin A. A., Tyumentsev A. G., Yushkov A. V.,
J. Phys. G., Vol. 30, 573-596 hep-ph/0402070Journal
(2004).
[39] Dedenko L. G., Lukyashin A. V., Roganova T. M. et al., Bull. Russ. Acad. Sci. Phys. 81: 496 (2017). [40] Dedenko L. G., Lukyashin A. V., Roganova T. M. et
al., EPJ Web of ConferencesVol. 14516003 (2017). [41] Dedenko L. G., Lukyashin A. V., Fedorova G. F.,
et al., Journal of Physics: Conference SeriesVol. 798
012045 (2017).
[42] Dedenko L. G., Lukyashin A. V., Fedorova G. F., et al., EPJ Web of ConferencesVol. 158, 06006 (2017). [43] Dedenko L. G., Lukyashin A. V., Fedorova G. F.,
et al., Journal of Physics: Conference SeriesVol. 934, 012017 (2017).