Mode analysis limitations of ECE-I & ECE measurements at the plasma edge
B.Vanovac1,∗,S.S.Denk2,E.Wolfrum2,M.Willensdorfer2,W.Suttrop2,R.Fischer2,N.C.Luhmann Jr3, and the ASDEX Upgrade Team
1DIFFER - Dutch Institute for Fundamental Energy Research, De Zaale 20, 5612 AJ Eindhoven, the Netherlands 2Max-Planck-Institut für Plasmaphysik, D-85748 Garching, Germany
3Department of Applied Science, the University of California at Davis, Davis, CA 95616, USA
Abstract.Interpretation of the Electron Cyclotron Emission (ECE) and ECE Imaging (ECE-I) measurements concerning the measurement position and the radiation temperature (Trad) at the plasma edge is associated with
significant uncertainty. Various limitations such as low and high-density limits, relativistic and Doppler shift-broadening, mode overlap were identified in the past. Here, we analyse the influence of density profile variation onto the radiation temperature in H-mode plasmas at ASDEX Upgrade tokamak. We show that, in the region of steep gradients, the variation of the density profile leads to an outward-shift of the measurement position, towards lowerTrad. The analysis is extended towards the study of the contribution of the ordinary mode
(O-mode) emission to the measuredTradat the plasma edge. With this analysis, we show the qualitative agreement
between experimental observations and modeling when taking into account the O-mode contribution to the ECE measurements. All of these effects are assessed via the Electron Cyclotron Radiation transport forward model that is now routinely used to model the response of the ECE-I and ECE systems in different plasma scenarios.
1 Introduction
The Electron Cyclotron Emission (ECE) diagnostic is widely used to measure the electron temperature (Te) and electron temperature fluctuations (δTe) [1]. The electron cyclotron emission imaging (ECE-I) diagnostic [2] works on the same principle, with the difference that it has mul-tiple lines of sight (LOS), which allow measurements of δTe in a poloidal plane. At ASDEX Upgrade, both di-agnostics measure the extraordinary mode (X-mode) mi-crowave intensity, which can be converted into a radiation temperatureTrad. The calibratedTradcan, in many cases, be directly related toTeat the measuring position defined by the strength of the toroidal magnetic field, only. The measurement position defined in this way is called ’cold’ resonance position. However, in specific plasma scenarios and plasma regions, the microwave radiation does not al-ways originate at the cold resonance. This ambiguity is of particular importance for the measurements at the plasma edge. Various types of limitation of the ECE radiometry at the plasma edge such as low and high-density limits, relativistic and Doppler broadening effects are reviewed in [3]. Shine-through in ECE measurements at ASDEX Up-grade is studied in detail in [4, 5] and for the DIII-D ECE-I system in [6]. The ECE-I diagnostic at ASDEX Upgrade has an oblique observation angle, and hence an enhanced Doppler shift of the emission frequency. It also suffers from even higher relativistic down-shift of the respective frequencies due to an oblique angle [7] which makes the scrape-off layer (SOL) non-accessible. However, it has
∗e-mail: [email protected]
been shown that strong perturbations such as density fil-aments in the SOL can be detected but the reconstruction of an accurateTeprofile fromTrad is, in general, not pos-sible [8]. In [9] the slow variations in density measured with Lithium Beam Emission Spectroscopy (Li-BES)[10] are found to influence the changes in theTradsignal mea-sured by ECE-I and ECE diagnostics in the pedestal. From here it was concluded that the knowledge of the electron density (ne) plays a vital role in the interpretation of the ECE-I in this region. The same effect has been studied for the marginally optically thick plasmas at KSTAR [11]. In this work, we study the response of the ECE-I and ECE systems to the variations ofneprofile in the optically thick (τ > 3) region. To probe the emission volume for each channel and interpret the radiation temperatureTradwe use the electron cyclotron radiation transport model. In this way, we acquire the detailed knowledge on the position of the channels andTradassociated with it. This information is essential for the interpretation of measured variations in Trad. Since the ordinary mode (O-mode) contribution to the ECE radiation is not perfectly blocked by the polar-ization filter at the ECE antennas in ASDEX Upgrade, the radiation transport model was extended to take this effect into account. In order to test the modeling of the O-mode contribution, we examine a case where the O-mode contri-bution to the measuredTradbecomes significant.
Section 4, we show the particular case where the O-mode contribution is significant.
2 Electron Cyclotron Radiation transport
forward model
At ASDEX Upgrade we routinely use the radiation trans-port model for interpreting measurements of ECE and ECE-I diagnostics [12, 13]. The radiation transport model accounts for the geometry of the detection systems, and radiation transport effects. For a specific frequency, ray tracing is performed, and the radiation transport equation is solved backwards until the ray reaches the antenna. This model is able to treat both X-mode and O-mode polariza-tion. The radiation transport model delivers the
informa-0.920 0.94 0.96 0.98 1
0.1
0.2 0.3 0.4 0.5 0.6 0.7
Te
(keV)
Te Dω cold warm
0.92 0.94 0.96 0.98 10
10 20 30 40 50 60
# 34244 at 3.14s at = 0.94773
ρpol p ρ
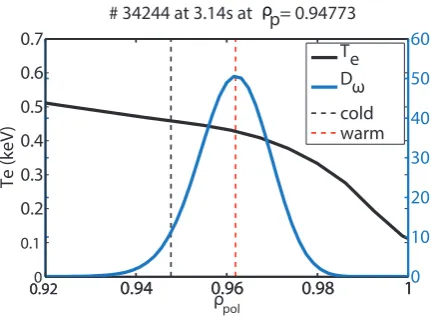
Figure 1. # 34244 att=3.14 s: Midplane edge channel with frequency f=110.4 GHz of the ECE-I diagnostic. The cold res-onance position atρpol =0.947, is determined by the magnetic
field strength, and is shown as black dashed line. A birthplace distribution of the observed intensity (Dω) is shown in blue. The peak of theDωrepresents a warm resonance of a channel. The Teprofile is shown in a solid black line.
tion on the location of the emitted radiation associated to a certain channel and theTrad associated with that chan-nel. The location of the emitted radiation is determined as the peak of the birth place distribution of the observed intensity (Dω) (see figure 1 and figure 2), defined in [12]. We label this peak as the ’warm’ resonance position. This ’warm’ resonance can differ from the ’cold’ resonance po-sition. The cold resonance (ω = neB/me, where n is the
harmonic of the cyclotron emission) is determined only by the strength of the magnetic field. The characteristic po-sitions for a single ECE-I midplane channel of frequency f =110.27 GHz are shown in figure 1. The warm res-onance (peak in Dω) is shifted outwards in comparison
to the cold resonance (black dashed line). The measured electron emission does not originate from a single location but rather from a broad portion of the plasma determined by the width of Dω. The most important broadening
ef-fects in the case of the ECE-I system are instrumental and Doppler broadening. The Doppler shift-broadening origi-nates from the oblique observation angle of the ECE-I di-agnostics. The outward shift towards lower temperatures
0.920 0.94 0.96 0.98 1
0.1 0.2 0.3 0.4 0.5 0.6 0.7
Te
(ke
V)
Te Dω cold warm
0.92 0.94 0.96 0.98 10
30 60 90 120 150
ρ pol
# 34244 at 3.14s at ρp = 0.94422
Figure 2. # 34244 at t=3.14 s: Midplane edge channel of f =110.27 GHz of the ECE diagnostic. The cold resonance posi-tion, determined by the magnetic field strength, is shown as black dashed line. A birthplace distribution of the observed intensity (Dω) is shown in blue. The peak of theDω represents a warm resonance for a respective channel. TheTeprofile is shown in a
solid black line.
and lower magnetic field compared to the cold resonance (black dashed line) is about 0.5 cm. This is proximately half of the radial resolution for this channel (1.1 cm for this channel).
The ECE system, on the other side, has negligible Doppler shift-broadening (see figure 2) as the observation angle is perpendicular to the magnetic field lines. The radial res-olution of this ECE channel, determined by the width of Dω, is about 5 mm. However, due to a small divergence
of the antenna pattern, a slight Doppler shift can also be observed for the case of the ECE system.
3 Variation of the density profile
0.850 0.9 0.95 1 1.05 1
2 3 4 5 6
# 34244 at 3.14s
0.85 0.9 0.95 1 1.050
0.1 0.2 0.3 0.4 0.5 0.6 0.7 0.8 0.9 1
n
e(1
0
19
m
-3
)
T
e(keV)
---- w/o perturbation
-- -- w perturbation
ρ
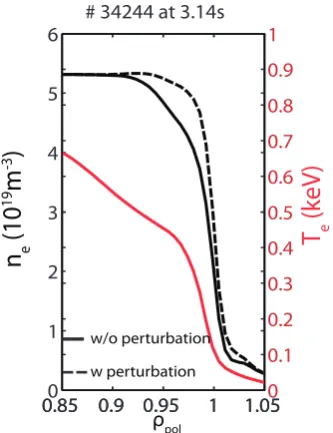
polFigure 3. # 34244 at 3.14 s: Input profiles ofTe (red) andne
(black) used to model the response of the ECE-I and ECE chan-nels to the presence of the density modulation. Background den-sity profile is shown as a black solid line while the perturbed density profile is displayed as black dashed line. The tempera-ture profile is kept the same for the two cases.
profile (black solid line in figure 3), and for the case 2 we use a density profile with added perturbation (shown as dashed black line in figure 3). Figure 4(a) shows the syntheticTradfor all channels of the ECE-I system for the two cases shown in figure 3. The channels are mapped onto warm resonances, and they align very well with the profile of the electron temperature inside the confined re-gion. The channels with the cold resonances outside the separatrix obey a relativistic frequency downshift, and are excluded from the analysis. The optical depth (τ) for the two cases is shown in figure 4(b). The effect of modified density is reflected in the form of a displaced profile of the optical depth (blue profile in figure 4(b)). The background profile is shown in gray. In case 1 the channel position is atρpol,1 = 0.978. It corresponds to the major radius po-sition ofRwarm,1 =2.138 m. In case 2, the same channel has its warm resonance atρpol,2 = 0.981 with Rwarm,2 = 2.14 m. TheTrad,1 =347 eV in case 1, andTrad,2 =323 eV in case 2. For∆Rwarmof 2 mm the∆Tradis∼20 eV. This
makes 3 % change in the Trad and is comparable to the sensitivity level of the present ECE-I system. The shift of 2 mm is within the radial resolution of this ECE-I chan-nel (11.4 mm). The result of the modeling for the profile ECE system is shown in figure 5. For case 1, the position of the channel isρpol,1=0.977 with major radius position atRwarm,1 =2.135 m. The warm resonance of the same channel for case 2 isρpol,2=0.980 andRwarm,2=2.137 m. TheTrad,1 =350 eV, andTrad,2 =315 eV. The∆Rwarm is
2 mm, and is the same as for the ECE-I system. However, ∆Tradis 35 eV and is higher than that of the ECE-I
chan-nel. This makes about 5 % ofTeat the channel position. The radial resolution of this ECE channel is∼6 mm thus,
0.9 1
0 100 200 300 400 500 600 700
1
ρ
pol
T
ra
d
(e
V)
2
# 34244 at 3.14s
0.9 1
0 5 10 15 20
ρ
pol
τ
1
2
Figure 4. a) ModeledTrad profile of the ECE-I system shown
against warm resonances. The dark gray circles correspond to a case without density perturbation with input density profile shown as a solid black line in figure 3. The blue circles corre-spond to a case where the perturbed density profile, shown as a dashed black line in figure 3, was used. The channel analyzed in this manuscript is labeled as 1 for the case without perturba-tion, and 2 with perturbation present. b) Optical depth for ECE-I channels for case 1 and 2, marked as gray and blue circles, re-spectively.
0.9 1
0 100 200 300 400 500 600 700
1
ρ
pol
T
ra
d
(e
V)
2
# 34244 at 3.14s
0.9 1
0 5 10 15 20 25 30
ρpol
τ
1
2
Figure 5. a) ModeledTrad profile of the ECE system shown
the radial shift of 2 mm is half of the radial resolution of this diagnostic. Therefore, in both diagnostics, variation of the density profile (noTemodulation in the modeling) leads to the modulation of measuredTrad, visible in a sgle channel in the optically thick pedestal region. An in-crease inneleads to a decrease ofTe, hence ifneandTe are modulated in phase, then the ECE underestimates the measured amplitude. Since the density fluctuations during the inter-ELM modes are nearly almost always present, it is necessary to perform the measurements of the density fluctuations simultaneously. As shown, the effect on the channels that should be sensitive toTe only (the optical depth is high) is non-negligible and falls within the sensi-tivity of both ECE-I and ECE diagnostics.
4 O-mode emission
To measure the X2 (extraordinary polarizationEwave⊥Bt, second harmonic) radiation only, it is necessary to prevent the coexistent O2 (ordinary polarizationEwave k Bt) con-tribution via proper orientation of the polarizing grid. The polarizing grid is not always perfectly aligned (pitch an-gle changes with plasma safety factor q), therefore some of the O-mode leaks into the waveguides, and some of the X2 radiation is missing. This way the O-mode contributes to measured radiation temperatures. To study the signif-icance of the O-mode contribution, the radiation trans-port model described in [12] has been extended. While the formalism is unchanged for X- and O-mode individu-ally, the calculation of the mixture of O- and X-mode was added. As the polarizing wire grid is aligned toroidally, the poloidal magnetic field introduces an inherent misalign-ment of the polarization filter. This misalignmisalign-ment is super-imposed by the small toroidal and poloidal inclination of the lines of sight. We calculate the O-mode contribution by projecting the polarization vector~eof each mode onto the polarization vector of the filter~p. The polarization vector of the microwave is calculated from the cold plasma dis-persion relation [15, 16] using the magnetic field vector and the electron densityneat the separatrix position. This is the common way of calculating the optimal polariza-tion for electron cyclotron resonance heating (ECRH)[17] therefore, also it applies to the ECE case, because of reci-procity. However, it should be noted that the Faraday effect and the Cotton-Mutton effect can change the polarization of the wave while it traverses the SOL[18]. Nevertheless, in this work, any change of wave polarization in the SOL is neglected. Since the intensity depends on the square of the electric field,Trad,modis composed of the X- and O-mode according to:
Trad,mod= ~eX·~p 2
Trad,mod,X+ ~eO·~p 2
Trad,mod,O (1)
With this formalism synthetic spectra containing a mix-ture of X-mode and O-mode can be computed. Because the optical depth for the O-mode contribution is usually a lot lower than for X-mode, the birthplace distribution is significantly different and can be much wider for O-mode electron cyclotron emission. This formalism, inte-grated into the radiation transport model, is applied to one
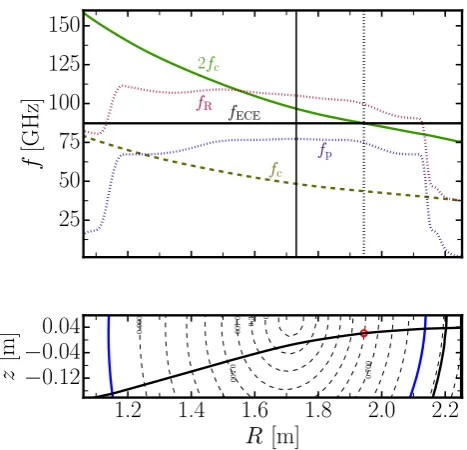
case where the X-mode polarized ECE of the second har-monic is in cut-offfor the large fraction of the low-field side (LFS) radius. In figure 6 we show the radial domain of the fundamental (fc) and second harmonic (2fc) cyclotron frequency for the magnetic field configuration of this dis-charge # 32934 att=3.298 s with an on axisBt=−1.8 T.
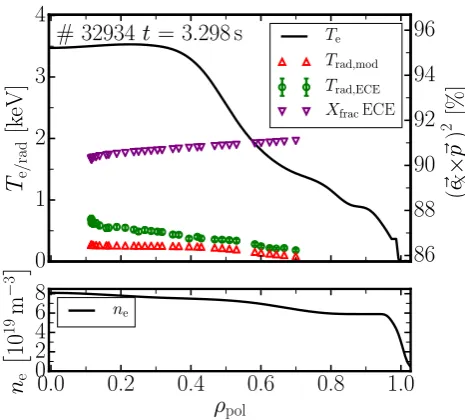
One probing frequency of the ECE radiometer (fECE) is shown as a horizontal solid line. Assumed O-mode ray propagation is depicted in the lower plot. If we were to measure Trad via the X2 mode it would not be possible due to its cut-offat most of the LFS. Note that fR > 2fc for the large fraction of the LFS hence, the X2 cyclotron emission is non-accessible. This includes the cold reso-nance positions of all ECE measurements in the frequency range fECE=86 to 98 GHz. For clarity, note that the verti-cal solid black line corresponds to the magnetic axis. Al-though the X-mode electron cyclotron emission is in cut-offfor this discharge, the measuredTrad, shown as green circles in figure 7, is significant and is in the range of 200 to 700 eV. This intensity originates from the second har-monic O-mode emission, which is not affected by cut-off because fp < 2fc. Synthetic and measured ECE
spec-25
50
75
100
125
150
f
[GHz
]
fc
2fc
fp
fECE fR
1.2
1.4
1.6
1.8
2.0
2.2
R
[m]
¡
0.12
¡
0.04
0.04
z
[m
]
0.100
0.200
0.300
0.400
0.500
0.600
0.700
0.800
0.900
1.100
1.100
1.200
1.200
Figure 6. # 32934 att=3.298 s: Radial dependence of the first and second harmonic of the cyclotron frequency fc, the plasma
frequencyfp, the right hand cut-offfrequencyfRand a
measure-ment frequency of 86 GHz. The solid vertical line indicates the position of the magnetic axis. The bottom plot shows the cal-culated Ordinary mode (O-mode) ray propagation for fECE =
86 GHz in the (R,z) plane.
tra for the discharge # 32934 att =3.298 s are compared in figure 7. The ECE measurements are shown as green dots and the synthetic ECE spectrum as red triangles. De-picted are ne and Te-profiles. The kinetic profiles were computed with the integrated data analysis technique[14]. On the same figure, we also show the polarizer efficiency
~
0
1
2
3
4
T
e=rad
[k
eV
]
# 32934
t
= 3.298 s
86
88
90
92
94
96
(
~e
£
X)
2
[%
]
Te
Trad,mod
Trad,ECE
XfracECE
0.0
0.2
0.4
0.6
0.8
1.0
½
pol0
2
4
6
8
n
e£
10
19
m
¡
3
¤
ne
~p
Figure 7. # 32934 att =3.298 s: Te(top) andne (bottom)
profiles versus normalized poloidal radius (black lines). Radia-tion temperaturesTrad,ECE(measured, green circles) is compared
toTrad,mod(modelled with ECFM, red triangles), with the
polar-izing efficiency ~eX·~p 2
of 91 % shown as purple triangles.
about 91 %. 100 % of polarizing efficiency would corre-spond to a perfect X-mode polarization. As can be seen, the syntheticTrad,modand measuredTrad,ECEdo not match perfectly. There are two possible explanations for the ob-served discrepancy. The first is the influence of wall re-flections due to the low optical depth τω ≈ 0.05 of the
O2 emission. At the stellarator TJK, full wave calcula-tions were performed to asses which parts of the plasma can contribute to ECE measurements at extremely low op-tical depth[19]. They found that radiation from any point in the machine is capable of reaching their ECE antenna, because of the wall reflections. The model of infinite re-flections between two plane mirrors, which is employed in the radiation transport model [12], is not suitable in this case. Furthermore, the reflections of the metallic surface of the vessel can cause mode conversion between O- and X-mode. The model assumes that Trad,mod,X = 0 due to the cut-off. It means that any mode conversion from O to X-mode could greatly increase the modeledTraddue to the much larger acceptance of X-mode radiation of the polar-izing beam splitter. Since only 91 % of the O-mode radi-ation is rejected in the current model, even small changes in the polarization state of radiation could have a signifi-cant impact on the observedTrad. Unlike the influence of wall reflections, this effect is independent on the optical depth and could also affect scenarios in which the O-mode is optically thick. Additional effects, that were omitted in this work, include polarization change in the SOL and X-mode emission reflected from the cut-offlayer back to the antenna.
5 Conclusions
The radiation transport model enables us to model the re-sponse of the ECE-I and ECE systems to different plasma scenarios at the ASDEX Upgrade tokamak. Of special in-terest are H-mode plasmas with pronounced density fluc-tuation at the plasma edge region during the inter-ELM periods. We have modeled such a scenario and shown the effect of the density at the pedestal top on an ECE-I and ECE channels both being shifted towards lower mag-netic fields and lower radiation temperatures. The effective change in the radiation temperature seen by one channel due to the density is within the sensitivity for both ECE-I and ECE systems and might, therefore, be interpreted as real temperature variation. This effect can have an impact when analyzing the cross phase betweenneandTe[20]. It is not possible to disentangleneandTe fluctuations with ECE-I and ECE measurements only, however, the mea-surement ofnefluctuations allows a quantification of their contribution toTradvia radiation transport model. Further-more, we have shown that in the particular plasma sce-nario, where X-mode polarization is in cut-off, the mea-sured radiation temperature is significant. This opens up the possibility to treat the O-mode contribution to the ra-diation temperatures. However, with the current rara-diation transport model it is not possible to quantitatively analyze ECE of the second harmonic O-mode measured at ASDEX Upgrade. Nevertheless, it is important to note that even when the X-mode is not in cut-off,Tradis underestimated by 5-10 % due to O-mode contributions.
6 Acknowledgments
This work has been carried out within the framework of the EUROfusion Consortium and has received funding from the Euratom research and training programme 2014-2018 under grant agreement No 633053. The views and opin-ions expressed herein do not necessarily reflect those of the European Commission.
References
[1] H.J. Hartfuss, T. Geist, M. Hirsch, Plasma Physics and Controlled Fusion39, 1693 (1997)
[2] I.G.J. Classen, C.W. Domier, N.C.L. Jr., A.V. Bogo-molov, W. Suttrop, J.E. Boom, B.J. Tobias, A.J.H. Donné, Review of Scientific Instruments85, 11D833 (2014)
[3] W. Suttrop, A. Peeters, IPP report (1996)
[4] S.K. Rathgeber, L. Barrera, T. Eich, R. Fischer, B. Nold, W. Suttrop, M. Willensdorfer, E. Wolfrum, the ASDEX Upgrade Team, Plasma Physics and Controlled Fusion55, 025004 (2013)
[5] S.S. Denk, R. Fischer, O. Maj, E. Poli, M. Willens-dorfer, J. Stober, U. Stroth, W. Suttrop et al., Shine-through in electron cyclotron emission measure-ments, in44th EPS Conference on Plasma Physics
[6] B.J. Tobias, M.E. Austin, J.E. Boom, K.H. Burrell, I.G.J. Classen, C.W. Domier, N.C.L. Jr., R. Nazikian, P.B. Snyder, Review of Scientific Instruments 83, 10E329 (2012), https://doi.org/10.1063/1.4733742
[7] M. Willensdorfer, S.S. Denk, E. Strumberger, W. Suttrop, B. Vanovac, D. Brida, M. Cavedon, I. Classen, M. Dunne, S. Fietz et al., Plasma Physics and Controlled Fusion58, 114004 (2016)
[8] B. Vanovac, I. Classen, S. Denk, E. Wolfrum, M. Hoelzl, A. Lessig, F. Orain, N.C.J. Luhmann et al.,ELM filaments on ASDEX Upgrade: ECEI ob-servations and modelling, in43thEPS Conference on
Plasma Physics(2016), proceedings of the 43thEPS Conference on Plasma Physics
[9] B. Vanovac, E. Wolfrum, S.S. Denk, F. Mink, F.M. Laggner, G. Birkenmeier, M. Willensdorfer, E. Viezzer, M. Hoelzl, S.J. Freethy et al., Plasma Physics and Controlled Fusion60, 045002 (2018) [10] M. Willensdorfer, E. Wolfrum, R. Fischer,
J. Schweinzer, M. Sertoli, B. Sieglin, G. Veres, F. Aumayr, the ASDEX Upgrade Team, Review of Scientific Instruments83, 023501 (2012)
[11] M.K. Ayub, G.S. Yun, W. Lee, H.K. Park, Journal of the Korean Physical Society70, 268 (2017)
[12] S.S. Denk et al.,Radiation transport modelling for the interpretation of oblique ECE measurements, in
19th Joint workshop (EC-19) on Electron Cyclotron Emission (ECE) and Electron cyclotron Resonance Heating (ECRH)(EPJ, 2016)
[13] S.S. Denk, R. Fischer, H.M. Smith, P. Helander, O. Maj, E. Poli, J. Stober, U. Stroth, W. Suttrop, E. Westerhof et al., Plasma Physics and Controlled Fusion60, 105010 (2018)
[14] R. Fischer, C.J. Fuchs, B. Kurzan, W. Suttrop, E. Wolfrum, the ASDEX Upgrade Team, Fusion Sci-ence and Technology58, 675 (2010)
[15] M. Bornatici, R. Cano, O.D. Barbieri, F. Engelmann, Nuclear Fusion23, 1153 (1983)
[16] F. Albajar, N. Bertelli, M. Bornatici, F. Engelmann, Plasma Physics and Controlled Fusion49, 15 (2007) [17] R. Prater, Physics of Plasmas 11, 2349 (2004),
https://doi.org/10.1063/1.1690762
[18] TSUJIMURA et al., Plasma and Fusion Research1 (2016)
[19] G. Sichardt, E. Holzhauer, A. Köhn, M. Ramisch, T. Hirth,Electron cyclotron emission measurements at the optically thin plasmas of the stellarator TJ-K, in44th EPS Conference on Plasma Physics(2017) [20] S.J. Freethy, G.D. Conway, I. Classen, A.J. Creely,