Mathematical simulation of temperature influence on pressure
drop at pump suction line
Tomáš Polášek1, *, Adam Bureček1, and Lumír Hružík1
1VŠB-Technical University of Ostrava, Faculty of Mechanical Engineering, Department of Hydromechanics and Hydraulic Equipment,
708 33 Ostrava, Czech Republic
Abstract. The article is focused on mathematical simulation of the temperature influence on the pressure drop at the pump suction line. It is evaluated pressure drop depending on mineral oil flow rate. The courses of individual dependencies are determined by mathematical simulation using the ANSYS CFD computing software. The temperature affects significantly physical properties of the flowing mineral oil. In a paper is also described the experimental measurement of a mineral oil sample and determination of its physical properties depending on temperature.
1 Introduction
The operating temperature of the mineral oil used in hydraulic machines and equipment significantly affects oil physical properties. It can have an essential influence on a correct operation of the equipment. For this reason, it is necessary to pay an increased attention to this issue.
The oil viscosity decreases with the increasing oil temperature in hydraulic mechanisms. In these cases, the flow losses are increased, pressure losses are reduced and the lubricating ability is worse with the decreasing oil viscosity.
It can be concluded that the viscosity is a measure of a liquid internal friction. Between two adjacent layers of a liquid which are moving with different velocities, the shear stress τ arises. According to the Newton´s law for laminar flow, the shear stress τ is linearly proportional to the velocity gradient in a perpendicular direction to the direction of the flowing liquid. The shear stress τ is formulated in the following equation:
𝜏 = 𝜂 ∙𝑑𝑣
𝑑𝑦 , (1)
where η is dynamic viscosity, dv/dy is velocity gradient in a perpendicular direction to the direction of movement.
The temperature influence is less pronounced on the change in the mineral oil density in comparison to the change in the oil viscosity. The mineral oil density decreases with the increasing operating temperature.
The determination of these two mineral oil physical properties in dependence on temperature is necessary to correctly define the flowing liquid in the mathematical model. This makes it possible to verify the oil temperature t influence on the pressure drop ∆p when the mineral oil flows through the suction line of the pump. Gear pumps are very often used in mobile hydraulics where they are operated in heavy conditions. On the
suction side, the significant negative vacuum is generated due to running at maximum operating parameters. The pumps are therefore extensively stressed by cavitation (aeration) erosion, resulting in a shorter service life and serviceability of the pump, noise level and vibration are increased and performance parameters are also reduced [1, 2].
2 Experimental measurements
Mineral oil physical properties are determined for the sent sample obtained from Jihostroj Company. For this sample, the oil dynamic viscosity η dependence and oil density ρ dependence were determined for the temperature range t = (10 ÷ 80) °C.
2.1 Determination of the oil dynamic viscosity
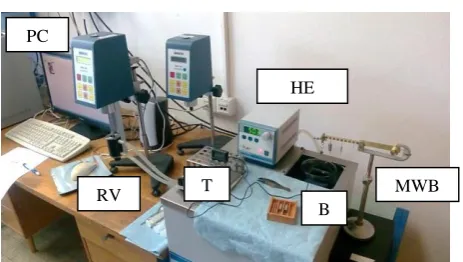
The Brookfield DV-II+Pro rotary viscometer was used to determine the viscous curve of the mineral oil sample. The aforementioned rotary viscometer operates on the principle of controlled shear rate and consist of a rotating spindle (type SEARLE). The small sample adapter was used to measure the mineral oil viscous curve. The rotary viscometer RV control was realized via Rheocalc V2.5 software. In order to achieve a constant temperature of the mineral oil sample, the rotary viscometer is equipped with a heat exchanger HE where the thermostat is included, see Figure 1.
Figure 1 shows the complete measuring device for determining mineral oil physical properties.
Fig. 1. Experimental measurements of the oil dynamic viscosity η and the oil density ρ
The obtained viscous curve depending on the oil temperature t is shown in Figure 2.
Fig. 2. Dependence of the oil dynamic viscosity η on the temperature t
In Figure 2, it is possible to observe that the oil dynamic viscosity η decreases significantly with the increasing temperature t [3]. This mentioned viscosity decrease is more significant in the lower temperature range t.
2.2 Determination of the oil density
For determining the oil density ρ dependence on the temperature t, the Mohr-Westphal balance MWB was used. The same heat exchanger HE as for the oil dynamic viscosity measurement was used to change the oil temperature in the beaker B. The oil temperature t was measured by the thermometer T in the beaker B, see Figure 1.
Figure 3 shows the measured dependence of the oil density ρ on the temperature t.
Fig. 3. Dependence of the oil density ρ on the temperature t
In Figure 3, it can be seen that the oil density ρ decreases with the increasing temperature t.
From these obtained dependencies of the oil physical properties on the temperature t, it is possible to define the flowing mineral oil for the wide range of temperatures t using ANSYS CFX software.
Subsequently, the change in the pressure drop ∆p was monitored by changing the oil temperature t at the suction line of the gear pump.
3 Definition of the mathematical model
and boundary conditions
The geometry of the investigated external gear pump type GHD0-22.5R-S03D13-SU07U05- N was obtained from Jihostroj Company. The geometry preparation of the investigated flow domain was performed. Further, the computational mesh was created and boundary conditions were set up.
3.1 Inverse geometry and computational mesh
The DesignModeler environment was used to modify the geometry of the pump. All components that were irrelevant to the suction line flow investigation were removed from the model. The inverse geometry of the pump suction line was also created. The suction line parameters are the following:
suction line length from the pump inlet L = 100 mm, suction line inner diameter d = 26.8 mm,
depth of the fitting is included h = 14.5 mm.
Figure 4 shows the inverse geometry of the suction line with the entire gear pump assembly.
Fig. 4. The investigated flow domain
Then the computational mesh was created on the modified geometry. The mesh contained about 1 000 000 elements which that made up of tetrahedron elements.
The generated computational mesh was checked for an element deformation before another mathematical model setting and the numerical calculation running. For the evaluation, the skewness criterion was used. This criterion judges how close an element shape approaches an ideal geometric shape. The computational mesh, including boundary conditions of the investigated flow domain is shown in Figure 5.
η= 0.3035e-0.053∙t
R² = 0.9974
0.00 0.05 0.10 0.15 0.20 0.25 0.30
0 20 40 60 80 100
η
/ Pa∙
s
t/ °C
ρ= -0.609∙t+ 878.081 R² = 0.998
820 830 840 850 860 870 880
0 20 40 60 80 100
ρ
/ k
g∙
m
-3
t / °C
MWB HE
RV PC
T
B
L h
0
Fig. 5. The computational mesh and boundary conditions of the investigated flow domain
3.2 Mathematical model and boundary
conditions setting
The numerical simulations were performed for flow velocities v, corresponding to the pump revolutions np, the
outlet area S and the geometric pump volume Vp = 22.5 cm3. The theoretical flow rate Qp of the
investigated gear pump deals with the following expression:
𝑄𝑝= 𝑉𝑝∙ 𝑛𝑝. (2)
The flow velocity v can be determined by the continuity equation according to the expression:
𝑣 =𝑄𝑝
𝑆 , (3)
where the flow area S depends on the shape and dimensions of the domain.
These flow simulations were performed for the oil temperature range t = (10 ÷ 80) °C. The flow velocities v, corresponding to the pump revolutions np and the flow
area (SL suction line – circular cross section, and outlet duct – non-circular cross section) are shown in Table 1.
Tab. 1. Flow velocities v (outlet duct)and flow velocities vSL
(suction line) corresponding to the pump revolutions npand the
flow area
np / min-1 v / m∙s-1 vSL / m∙s-1
500 0.773 0.332 1500 2.318 0.997 2000 3.091 1.330 3000 4.636 1.994
At the entrance to the investigated domain, the Opening boundary condition, which was defined by the absolute pressure pabs = 101 325 Pa, was situated. Then at
the outlet from the domain, the Velocity - outlet boundary condition was situated. This boundary condition was defined by the flow velocities v, corresponding to outlet duct, see Table 1.
The flowing liquid was defined based on the measured data that were obtained from the experimental measurements of the mineral oil physical properties, see Chapter 2.
The flow regime in the investigated domain was expressed by the Reynolds number Re. The values of the Reynolds numbers were determined by means of the oil dynamic viscosity η, the oil density ρ, the inner diameter d of the suction line and the flow velocity vSL at the suction
line. The analytical determination of the Reynolds number Re is expressed as follows:
𝑅𝑒 =𝑣𝑆𝐿∙ 𝑑 ∙ 𝜌
𝜂 . (4)
The results of the Reynolds number Re analytical determination depending on the oil temperature t and the individual revolutions of the pump np are shown in
Figure 6.
Fig. 6. Dependence of the Reynolds number Re on the oil temperature t
The values of the Reynolds number Re correspond to laminar flow at most oil temperatures t. The Reynolds numbers Re are higher than the critical value Rekrit for the
simulated revolutions np = (1 500, 2 000, 3 000) min-1
and the oil temperatures t = (60, 70, 80) °C. Above the critical Reynolds number Rekrit, the flow is developing in
a transition and a turbulent region. The laminar model was defined for the entire range of the oil temperatures t and the flow velocities v.
4
Evaluation
of
the
numerical
simulations
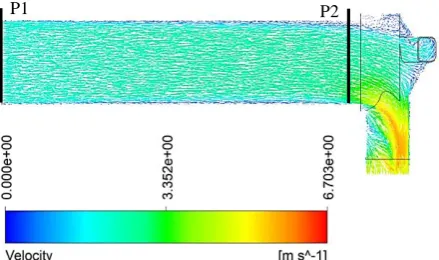
Figure 7 shows velocity vectors in the symmetry plane of the investigated domain. The planes P1 and P2 are also shown in Figure between which the pressure drops ∆p of the suction line were determined.
Fig. 7. Velocity vectors in the symmetry plane of the suction line for revolutions np = 3 000 min-1, oil temperature t = 50 °C,
Laminar model 0 2000 4000 6000 8000 10000 12000
0 10 20 30 40 50 60 70 80 90
Re
/
1
t/ °C
Otáčky 500 1/min Otáčky 1500 1/min Otáčky 2000 1/min Otáčky 3000 1/min Opening - absolute pressure - inlet
Velocity - outlet
Rekrit.
Transition / turbulent region
Revolutions 500 min-1
Revolutions 2 000 min-1
Revolutions 1 500 min-1
Revolutions 3 000 min-1
The total pressure contours are shown in the symmetry plane and the suction line wall in Figure 8.
Fig. 8. Total pressure contours in the symmetry plane (a) and the suction line wall (b) for revolutions np = 3 000 min-1, oil
temperature t = 50 °C, Laminar model
The area of the largest total pressure decrease is also indicated on the suction line wall in Figure 8b. This area could then perform a significant role at the beginning of an air bubble formation [4, 5].
Figure 9 shows the pressure drops ∆p depending on the oil temperatures t and the pump revolutions pump np
that were evaluated for the laminar model.
Fig. 9. Dependence of the pressure drop ∆p on the oil temperature t and pump revolutions np for the laminar model
In Figure 9, it is possible to observe that the pressure drop ∆p decreases with the increasing oil temperature t at the suction line. It is also visible in Figure 9 that the pressure drop of the suction line ∆p increases with the increasing pump revolutions np (the flow velocity v).
For higher oil temperatures t = (60, 70, 80) °C and pump revolutions np = (1 500, 2 000, 3 000) min-1, there
wasn´t a convergence of the laminar model.
For these cases, the mathematical simulations were performed for turbulent k - ω, SST, k - ε and RNG models. It was done by comparing the pressure drop ∆p depending on the oil temperature t for a transition/turbulent flow regime [6].
Figure 10 shows numerical simulation results for selected turbulent models. The laminar model dependence ∆p = f(t) and aforementioned turbulent models dependencies ∆p = f(t) are compared for the pump revolutions np = 3 000 min-1 and the oil temperatures
t = (60, 70, 80) °C.
Fig. 10. Dependence of the pressure drop ∆p on the oil temperature t and the pump revolutions np = 3 000 min-1 for the
laminar and turbulent models
The dependencies ∆p = f(t) determined by turbulent SST and k - ω models approximate with their trends to the dependence ∆p = f(t) determined by the laminar model. For the turbulent k - ε and RNG models, the results differ significantly at oil temperatures t = 60 a 70 °C. In Figure 10, it is possible to observe that the pressure drops ∆p determined by the turbulent k - ε and RNG models approximate to pressure drops ∆p determined by the turbulent SST and k - ω models with the increasing oil temperature t (and therefore the increasing Reynolds number Re).
The use of the turbulent SST and k - ω models in ANSYS CFX software is suitable in a transition flow region.
5 Conclusion
The article deals with mathematical simulations of the oil temperature influence on the pressure drop at the suction line of the external gear pump. The mineral oil physical properties were experimentally determined. The mathematical flow model was created in the ANSYS CFX environment. The Reynolds numbers were determined by the analytical calculation depending on the oil temperature. The numerical solution result was decreasing dependence of the pressure drop on the oil 0
500 1000 1500 2000 2500 3000 3500
0 10 20 30 40 50 60 70 80 90
∆
p
/
P
a
t/ °C
LAMINAR - 500 LAMINAR - 1500
LAMINAR - 2000 LAMINAR - 3000
0 400 800 1200 1600 2000 2400 2800 3200 3600
0 10 20 30 40 50 60 70 80 90
∆
p
/
P
a
t/ °C
LAMINAR - 3000 K-EPS - 3000 RNG - 3000 K-OMEGA - 3000 SST - 3000
Laminar model 500 min-1
Laminar model 2000 min-1
Laminar model 1500 min-1
Laminar model 3000 min-1
Laminar model 3 000 min-1 RNG model 3 000 min-1 SST model 3 000 min-1
k-ε model 3 000 min-1 k-ω model 3 000 min-1 Local total pressure decrease
on the suction line wall (a)
temperature for the laminar model. In some cases, the Reynolds numbers reached higher values than the critical value. The simulations were performed for this area using the turbulent k - ω, SST, k - ε, RNG models. The turbulent SST and k - ω models most closely approximated with their results to the dependence ∆p = f(t) which was determined by the laminar model.
This work was supported by the European Regional Development Fund in the Research Centre of Advanced Mechatronic Systems project, project number CZ.02.1.01/0.0/0.0/16_019/0000867 within the Operational Programme Research, Development and Education.
The work presented in this paper was supported by a grant SGS „Modeling and Experimental Verification of Dynamic Phenomena in Fluid and Vacuum Systems" SP2018/157.
References
1. R. Sikora, A. Bureček, L. Hružík, M. Vašina, EPJ Web of Conferences, EFM14, Experimental investigation of cavitation in pump inlet, 92, 02081, (2015) 2. M. Kozubková, M. Bojko, J. Jablonská, D. Homa, J.
Tůma, EPJ Web of Conferences, EFM15, Experimental research of multiphase flow with cavitation in the nozzle, 114, 02058, (2016)
3. D. Knežević, V. Savić, FACTA UNIVERSITATIS, Mechanical Engineering, Mathematical modeling of changing of dynamic viscosity, as a function of temperature and pressure, of mineral oils for hydraulic systems, 4 (1), 27-34 p., (2006)
4. K. Fraňa, I. Nová, International Journal of Mechanics, A interface formation in two-phase flow problems, 12, 102-108p., (2018)
5. J. Jablonská, M. Bojko, EPJ Web of Conferences, EFM15, Mathematical and experimental modelling of flow of air-saturated water through a convergent-divergent nozzle, 114, 02050, (2016)