An Efficient Generation of Potential High Utility
Itemsets from Transactional Databases
Velpula Koteswara Rao, Ch. Satyananda Reddy Department of CS & SE, Andhra University
Visakhapatnam, Andhra Pradesh, India.
Abstract: - The importance of Utility Mining is to identify the
itemsets with maximum utilities, by considering profit, quantity, cost or other user preferences. An Efficient discovery of high utility itemsets from transactional databases refers to finding the itemsets with high utility like profits. High utility itemsets mining extends frequent pattern mining and weighted frequent mining to discover itemsets in a transaction database with utility values above a given threshold. We proposed an efficient algorithm namely UP-Growth+ (Utility Pattern Growth+), which improves the mining performance in terms of time and space complexities. The information of high utility itemsets is maintained in tree -based data structure named as Tree (Utility Pattern Tree).The performance of both UP-Growth and UP-UP-Growth+ is compared with the state-of- the- art algorithms on different types of datasets. UP-Growth+ is not only reduces the number of candidates effectively but also better than other algorithms substantially in terms of execution time and space requirement, especially when the database contains lots of long transactions.
Keyword:- Data mining, Frequent Pattern Mining, Weighted Frequent Pattern Mining, Utility Mining
1 INTRODUCTION
Data mining (sometimes called data or knowledge discovery) is the process of analyzing data from different perspectives and summarizing it into useful information - information that can be used to increase revenue, cuts costs, or both. Discovering useful patterns hidden in a database plays an essential role in several data mining tasks, such as frequent pattern mining [1][12][13][14], weighted frequent pattern mining [4], and high utility pattern mining [5]. The goal of frequent itemset mining is to identify all frequent itemsets and it collects the set of items that occur frequently together. Therefore, frequent itemset mining cannot satisfy the needs of customers, who all are wanted the itemsets with high profits. To solve this problem weighted association rule mining [4] was proposed. In this concept, the quantities of items are not taken yet. In view of this, utility mining emerges as an important topic in data mining for mining the itemsets with high utility like profits. The basic meaning of utility is the interestedness/ importance/ profitability of items to the users. The utility of an itemset is defined as the product of its external utility and internal utility, where external utility is the importance of different items, and internal utility is the importance of the items in the transaction. If the utility of an itemset is no less than a user specified minimum utility threshold then it is called
high utility itemset. Otherwise, the itemset is called a low utility itemset.
However, mining high utility itemsets from the databases is not an easy task since the downward closure property [1] used in frequent itemset mining cannot be applied here. In other words, pruning search space for high utility itemset mining is difficult because a superset of a low utility itemset may be a high utility itemset. To solve this problem by enumerate all itemsets from the databases by the principle of exhaustion. Obviously, this approach will encounter the large search space problem, especially when databases contains lots of long transactions or a low threshold is set. Hence, how to effectively prune the search space and efficiently capture all high utility itemsets with no miss is a big challenge in utility mining.
Existing studies [4] [5] [6] [10] [11] applied overestimated methods to facilitate the mining performance of utility mining. These methods give potential high utility itemsets first, and then an additional database scan is performed for identifying their utilities. However, the existing methods often generate a huge set of potential high utility itemsets and the mining performance is degraded consequently. The situation may become worse when the database contains many long transactions or low threshold is set. The huge number of potential high utility itemsets forms a challenging problem to the mining performance since the higher processing cost and execution time is incurred with more potential high utility itemsets are generated. To address this issue, we proposed an efficient algorithm called UP-Growth+ algorithm.
The rest of this paper is organized as follows. In section 2, we introduce the background and related work for high utility itemset mining. In section 3, the proposed algorithm and data structure are described in details. Experiment results are shown in section 4 and the conclusions are given in section 5
2 BACKGROUND
In this section, we first include some definitions and describe the problem of utility mining, and then introduce related work in utility mining.
2.1 Basic Definitions
A transaction database D= {T1, T2, .Tn} and each
transaction Td (1 ≤d ≤n) has a unique identifier d, called
TID. Each item ip in transaction Td is associated with a
quantity q (ip,Td), that is, the purchased quantity of ip in Td.
A set of items I= {i1, i2. . . im} each item ip (1 ≤p≤ m) has a
Definition 1. The utility of an item is the product of its internal utility and external utility. The utility of the item in a transaction is denoted as u ( and defined as
u( =pr (ip) * q (ip,Td).
For example u ({P}, T2) =2*1=2
Definition 2. The utility of an itemset X in transaction is the sum of the utilities of all the items in X in T, it is denoted as u(X, and defined as
u(X, =
(
,)
p d
i ∈ ∧ ⊆X X T
u i T
p d
For example u ({PQ}, T2) = u ({P}, T2) + u({Q}, T2)
=2+6=8
Definition 3. The utility of an itemset X in database D is the sum of the utilities of X in all transactions containing X. It is denoted as u(X), and defined as
u(X)=
( ,
)
d d
X⊆T ∧ ∈T D
u X T
d
For example
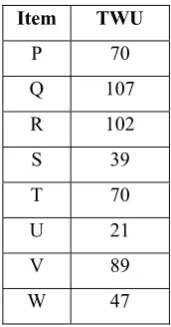
u({V})=u({V},T2)+u({V},T3)+u({V},T4)=15+3+6=24 TABLE 1
An Example Transactional Database
TID Transaction
T1 (P,3) (Q,1) (R,1) (S,3)
T2 (P,2) (Q,2) (R,3) (T,2) (V,5)
T3 (P,2) (Q,4) (V,1) (W,2)
T4 (Q,5) (R,2) (T,6) (V,2)
T5 (R,3) (S,7) (U,5) (W,3)
T6 (P,1) (Q,1) (S,1) (W,2)
TABLE 2 Profit Table
Item P Q R S T U V W
Profit 1 3 2 1 2 1 3 1
Definition 4. The utility of transaction is the sum of the utilities of all the items in the transaction. It is denoted as TU( ) and defined as
( )
( , )
p d
d p d
i T
TU T
U i T
∈
=
Definition 5. The transaction weighted utility of an itemset X is the sum of the transaction utilities of all the transactions containing the itemset X in the database. It is denoted as TWU(X) and defined as
( )
( )
d d
d
X T T D
TWU X
T
T
⊆ ∧ ∈
=
∪
TABLE 3
Transaction Utilities Table Transaction Transaction
Utility
TU(T1) 11
TU(T2) 33
TU(T3) 19
TU(T4) 37
TU(T5) 21
TU(T6) 7
TABLE 4
Transaction Weighted Utilities Table (TWU)
Item TWU
P 70 Q 107 R 102 S 39 T 70 U 21 V 89 W 47
2.2 Related Work
Extensive studies have been proposed for mining frequent patterns [1], [2]. Among the issues of frequent pattern mining, the most famous are association rule mining [1] and sequential pattern mining [2]].Association rule mining is considered to be an interesting research area and studied widely [1] [2]by many researchers. In the recent years, some relevant methods have been proposed for mining high utility itemsets from transaction databases.
In 1994, Agrawal .R et al. [1] proposed Apriori algorithm by exploit “downward closure property”, which is the pioneer for efficiently mining association rules from large databases. This algorithm generated and tested candidate itemsets iteratively. This may scan database multiple times, so the computational cost is high. This problem is overcome by FP-Growth algorithm is proposed by Han .J et al. [3].
In the frequent itemset mining, the importance of items to users is not considered. Later different algorithms proposed like Two-Phase [5][7], IIDS [6] and IHUP [2].In 2006, H. Yao et al. proposed UMining [8] algorithm to find almost all the high utility itemsets from an original database. But it suffers to capture a complete set of high utility itemsets. Later, In 2010 V. S. Tseng et al. [10] proposed UP-Growth algorithm to rectify the problems of FP-Growth.
3 PROPOSED METHOD
by UP-Growth+ 3) identify actual high utility itemsets from the set of PHUIs.
3.1. Construction of global UP-Tree
In an UP-Tree, each node G consists of G.name, G.count, G.nu, G.parent, G.hlink and a set of child nodes. G.name is the node’s item name. G.count is the node’s support count. G.nu is the node’s node utility, i.e., overestimated utility of the node. G.parent records the parent node of G. G.hlink is a node link which points to a node whose item name is the same as G.name.
A header table is maintained to represents the traversal of UP-Tree. Header table contains three fields such as item name, an overestimated utility, and a link. The link points to the last occurrence of the node which has the same item as the entry in the UP-Tree.
3.1.1 Constructing a Global UP-Tree by Applying DGU and DGN
The construction of a global UP-Tree is performed with two database scans. In the first scan, each transaction’s TU is computed for each transaction; at the same time, TWU of each item is computed. An item ip is called a unpromising
item if TWU (ip) less than min_util.Otherwise it is called
promising item. We can get promising and unpromising items. In the second scan transactions are inserted one after the other into a UP-Tree. When a transaction is retrieved, the unpromising items should be removed from the transaction and their utilities should also be eliminated from the transaction’s TU. New TU after removing unpromising items is called the reorganized transaction utility (RTU).Re organized transaction utility of a transaction Tn is indicated
with RTU (Tn). The transactions are reorganized by
discarding the unpromising items and the remaining items are arranged in descending order of their TWU’s.
DGU can be performed repeatedly till unpromising items are not contained in all reorganized transactions. This entire process comes under the DGU strategy. During the DGN strategy the utilities of descendent nodes from their node utilities in global UP-Tree.
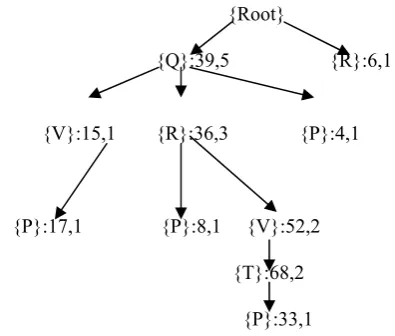
An example is given to explain how to apply the two strategies during the construction of a global UP-tree. Consider the transactional database in Table 1 and profit table in Table 2.suppose min_util is 50.In the first scan TU’s of transactions are represented in Table 3 and TWU’s of items are represented in Table 4.Five promising items, i.e., {P}:70, {Q}:107, {R}:102, {T}:70, {V}:89 are sorted in the header table by descending order of TWU, that is {Q}, {R}, {V}, {T} and {P}.The reorganized transaction and their RTUs are shown in Table 5. After a transaction has been reorganized, it is inserted into the global UP-Tree. When T1’={(Q,1) (R,1) (P,3)} is inserted, the first node GQ
is created with GQ.item={Q} and GQ.count=1 GQ.nu is
increased by RTU(T1’) minus the utilities of the rest items
that are behind {Q} in T1’ that is, GQ.nu=RTU(T1’
)-(u({R},T1’)+u({P},T1’)=8-(2+3)=3.The second node GR is
created with GR.nu=RTU (T1’)-u ({P}, T1’) =8-3=5. The
third node GP is created with GP.nu=RTU (T1’) =8.The
same process is repeated for all the remaining reorganized transactions, results are shown in Table 6.
TABLE 5
Reorganized Transactions and their utilities
TID Reorganized Transaction RTU
T1 (Q,1) (R,1) (P,3) 8
T2 (Q,2) (R,3) (V,5)
(T,2) (P,2) 33 T3 (Q,4) (V,1) (P,2) 17
T4 (Q,5) (R,2) (V,2)
(T,6) 37
T5 (R,3) 6
T6 (Q,1) (P,1) 4
TABLE 6
Node utilities of every item in a transaction
Transaction Node Utilities
T1 GQ.nu=3 GR.nu=5 GP.nu=8
T2 GQ.nu=6 GR.nu=12 GV.nu=27
GT.nu=31 GP.nu=33
T3 GQ.nu=12 GV.nu=15 GP.nu=17
T4 GQ.nu=15 GR.nu=19 GV.nu=25
GT.nu=37
T5 GR.nu=6
T6 GQ.nu=3 GP.nu=4
After inserting all reorganized transactions by the same way, the global UP-Tree is shown in Fig.1
{Root}
{Q}:39,5 {R}:6,1
{V}:15,1 {R}:36,3 {P}:4,1
{P}:17,1 {P}:8,1 {V}:52,2
{T}:68,2
{P}:33,1
Fig. 1.Construction of global UP-Tree by DGU and DGN
3.2 Generate PHUI’s and its Utilities from global UP-Tree
utilities of itemsets. we proposed an improved method, named UP-Growth+, for dropping overestimated utilities more in fact.
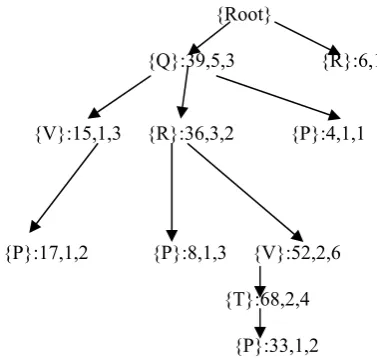
In UP-Growth, minimum item utility table is used to reduce the overestimated utilities. In UP-Growth+, minimal node utilities in each path are used to build the estimated pruning values closer to real utility values of the pruned items in database. Model diagram for UP-Growth+ is shown in Fig.3 Minimal node utility for each node can be acquired during the construction of a global UP-Tree. First, we add an element, namely G.mnu, into each node of UP-Tree. G.mnu is minimal node utility of G. When G is traced, G.mnu keeps way of the minimal value of G.name’s utility in different transactions. If G.mnu is larger than u(G.name,Tcurrent), G.mnu is set to u(G.name,Tcurrent).
Fig. 2 shows the global UP-Tree with G.mnu in each node. In Fig. 2, G.mnu is the last number in each node.
{Root}
{Q}:39,5,3 {R}:6,1
{V}:15,1,3 {R}:36,3,2 {P}:4,1,1
{P}:17,1,2 {P}:8,1,3 {V}:52,2,6
{T}:68,2,4
{P}:33,1,2
Fig. 2. An UP-Tree with minimal node utilities.
UP-Growth+ introduces two more strategies, named DNU and DNN With minimum node utilities in each path, minimal node utilities in each path are used to build the estimated pruning values closer to real utility values of the pruned items in database. In the mining process, when a path is retrieved, minimal node utility of each node in the path is also retrieved.
Fig 3: Model Diagram for UP-Growth+
3.2.1 Methodology for UP-Growth+ Algorithm:
1. Calculate TU, TWU
2. Discard unpromising items and their path utilities 3. Reorganize the transactions
4. Construct UP-Tree with root R 5. Insert Transactions into tree
6. For every item in path maintain minimum node utility
7. Generate conditional pattern bases 8. Discard local unpromising items and their
utilities(DNU & DNN)
9. Construct conditional pattern tree 10. Obtain PHUIs
11. Obtain high utility itemsets
DNU:
Assume that there is a path in {B}-CPB and UI {B}-CPB is the
set of unpromising items in {B}-CPB. The path utility of p in {B}-CPB, i.e., pu (p, {B}-CPB) is calculated as follows
pu(p, {B}-CPB) =p. {B}.nu - ∑x߳UI {B}-CPB min_node_util(x)*
p.count
Where min_node_util(x) is the minimum node utility of x and p.count is the support count of path p.
Next, we use an example for describing the processes of DNU in UP-Growth+. Consider the UP-Tree in Fig. 2 and assume that min_util is set to 50. After applying DNU step the reorganized paths and its utilities are shown in Table 7, and their path utilities of items are listed in Table 8
TABLE 7
Path’s Utilities of {P}-CPB
Local Paths to {P}-CPB Path’s Utility
<Q(3),R(2)> 8 <Q(3),R(2),V(6),T(4)> 33
<Q(3),V(3)> 17 <Q(3)> 4
TABLE 8
Path Utilities of items in {P}-CPB
Item Path Utility
V 50 T 33 R 41 Q 62
From Table 8 the unpromising items are T and R because their utilities are less than 50.
After dropping the unpromising items the reorganized transactions and their reorganized path utilities are shown in Table 9.
Data set
Select Transactional
Database
DGU
DGN
DNU DNN
TABLE 9
Reorganized Paths Utilities of {P}-CPB Local Paths to {P}-CPB Path’s Utility
<Q(3)> 6 <Q(3),V(6)> 27 <Q(3),V(3)> 17
<Q(3)> 4
DNN:Decreasing local node utilities for the nodes of local UP-Tree by estimated utilities of descendant nodes. It is similar to DGN step but it uses minimum node utilities of descendant nodes instead of actual utilities of descendent nodes.
TABLE 10
Node Utilities of every item in {P}-CPB Node Utilities of {P}-CPB
GQ.nu=6
GQ.nu=21 GV.nu=27
GQ.nu=14 GV.nu=17
GQ.nu=4
In our example PHUIs that are obtained with {P}-CPB when min_util=50 are obtained, i.e., {P}: 62.By applying the four strategies, the generation of PHUIs can be more efficient since the fewer PHUIs are generated, the less time is spent.
4 EXPERIMENTAL EVALUATIONS:
The implementation of the proposed system is evaluated and shows that the proposed system better the existing systems. The algorithm is implemented in Java language. Both real and synthetic data sets are used in the experiments. The synthetic data set was generated by writing a program in Java language while the real data sets were taken from Internet sources the features of real datasets are as presented in Table 11.
TABLE 11 Features of Real Data Sets
Dataset │D│ T │I│ Type
Accidents 340183 33.8 468 Dense
Chain-store 112949 7.2 46086 Sparse
Chess 3196 37.0 75 Dense
Foodmart 4141 4.4 1559 Sparse
To show the performance of the proposed algorithm, we compared several compared methods and give them new notations as follows: IHUPTWU algorithm, which is
proposed in [5] and composed of IHUPTWU-Tree and
FP-Growth, is denoted as IHUPT&FPG. Similarly UPT&FPG, UPT&UPG Tree and UP-Growth), UPT&UPG+ (UP-Tree and UP-Growth+).The methods implemented in this paper are compared with previous methods. The results existing in the following figures expose that the performance of the methods of this paper show better performance when compared to that of previous ones.
Fig. 3. Performance comparison with respect to dense data set (Chess)
As can be seen in Figure 3, it is clear that the horizontal axis represents minimum utility (%) while the vertical axis represents the runtime. Out of all the methods the UPT & UPG+ method has higher performance.
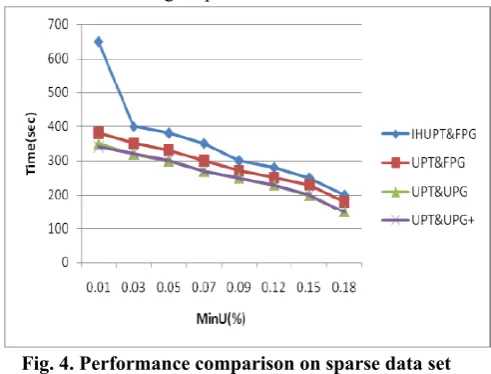
Fig. 4. Performance comparison on sparse data set (Foodmart)
As can be seen in Figure 4, it is clear that the horizontal axis represents minimum utility (%) while the vertical axis represents the runtime. Out of all the methods the UPT & UPG+ method has higher performance.
As can be seen in Figure 5, it is clear that the horizontal axis represents average transaction length while the vertical axis represents the runtime. Out of all the methods the UPT & UPG+ method has higher performance.
Fig.6. Maximum number of purchases items (Accidents dataset)
As can be seen in Figure 6, it is clear that the horizontal axis represents maximum number of purchases items while the vertical axis represents the runtime. Out of all the methods the UPT & UPG+ method has higher performance.
Finally, high utility itemsets are efficiently identified from the set of PHUIs which is much smaller than HTWUIs generated by IHUP. By the reasons mentioned above, the proposed algorithms UP-Growth and UP-Growth+ achieve better performance than IHUP algorithm.
5 CONCLUSIONS
Efficient discovery of high utility itemsets from transactional databases refers to finding the itemsets with high utility like profits. High utility itemsets mining extends frequent pattern mining and weighted frequent mining to discover itemsets in transactional databases with utility values above a given threshold. In this paper, we have proposed UP-Growth+ for mining high utility itemsets from transactional databases. For maintaining the information of high utility itemsets a data structure named UP-Tree was proposed. With only two database scans, from UP-Tree Potential high utility itemsets can be efficiently generated and also their utilities are calculated. To perform a thorough performance evaluation both real and synthetic datasets were used in the experiments. Results show that the strategies considerably improved performance by reducing both the search space and the execution time.
REFERENCES
[1] R. Agrawal and R. Srikant, “Fast Algorithms for Mining Association Rules,” Proc. 20th Int’l Conf. Very Large Data Bases (VLDB), pp. 487-499, 1994.
[2] R. Agrawal and R. Srikant, “Mining Sequential Patterns,” Proc. 11th Int’l Conf. Data Eng., pp. 3-14, Mar. 1995.
[3] Jiawei. Han, Jian. Pei, and Y. Yin.: Mining frequent patterns without candidate generation. In Proc. of the ACM-SIGMOD Int'l Conf. on Management of Data, pp. 1-12, 2000.
[4] F.Tao, F.Murtagh, and M. Farid, “Weighted Association Rule Mining Using Weighted Support and Significance Framework,” Proc. ACM SIGKDD Conf. Knowledge Discovery and Data Mining (KDD ’03), pp. 661-666, 2003.
[5] C.F. Ahmed, S.K. Tanbeer, B.-S. Jeong and Y.-K. Lee, “Efficient Tree Structures for High Utility Pattern Mining in Incremental Databases,” IEEE Trans. Knowledge and Data Eng., vol. 21, no. 12, pp. 1708-1721, Dec. 2009.
[6] Y. C. Li, J. S. Yeh, and C. C. Chang.: Isolated items discarding strategy for discovering high utility itemsets. In Data & Knowledge Engineering, Vol. 64, Issue 1, pp. 198-217, Jan., 2008.
[7] Y. Liu, W. Liao, and A. Choudhary.: A fast high utility itemsets mining algorithm. In Proc. of the Utility-Based Data Mining Workshop, 2005.
[8] H. Yao, H. J. Hamilton, and L. Geng.: A unified framework for utility-based measures for mining itemsets. In Proc. of ACM SIGKDD 2nd Workshop on Utility-Based Data Mining, pp. 28-37, USA, Aug., 2006.
[9] R. Chan, Q. Yang, and Y. Shen, “Mining High Utility Itemsets,”Proc. IEEE Third Int’l Conf. Data Mining, pp. 19-26, Nov. 2003.
[10] Vincent. S. Tseng, C. W. Wu, B. E. Shie, and P. S. Yu.: UP-Growth: An Efficient Algorithm for High Utility Itemset Mining. In Proc. of ACM-KDD, Washington, DC, USA, pp. 253-262, July 25–28, 2010. [11] A. Erwin, R.P. Gopalan, and N.R. Achuthan, “Efficient Mining of
High Utility Itemsets from Large Data Sets,” Proc. 12th Pacific-Asia Conf. Advances in Knowledge Discovery and Data Mining (PAKDD), pp.554-561,2008
[12] Efficient Algorithms for Mining High Utility Itemsets from Transactional Databases by Vincent S. Tseng, Bai-En Shie, Cheng-Wei Wu, and Philip S. Yu, Fellow, IEEE
[13] S.J. Yen and Y.S. Lee, “Mining High Utility Quantitative Association Rules.” Proc. Ninth Int‟l Conf. Data Warehousing and Knowledge Discovery (DWK), pp. 283-292, Sept. 2007.