HIGHLIGHTED ARTICLE
| INVESTIGATION
Determinants of Base-Pair Substitution Patterns
Revealed by Whole-Genome Sequencing of DNA
Mismatch Repair Defective
Escherichia coli
Patricia L. Foster,*,1Brittany A. Niccum,* Ellen Popodi,* Jesse P. Townes,* Heewook Lee,†,2 Wazim MohammedIsmail,†and Haixu Tang† *Department of Biology, and†School of Informatics, Computing, and Engineering, Indiana University, Bloomington, Indiana 47405 ORCID IDs: 0000-0002-7236-4378 (P.L.F.); 0000-0002-3528-6833 (H.L.); 0000-0001-8963-8155 (H.T.)
ABSTRACTMismatch repair (MMR) is a major contributor to replicationfidelity, but its impact varies with sequence context and the nature of the mismatch. Mutation accumulation experiments followed by whole-genome sequencing of MMR-defectiveEscherichia coli strains yielded 30,000 base-pair substitutions (BPSs), revealing mutational patterns across the entire chromosome. The BPS spectrum was dominated by A:T to G:C transitions, which occurred predominantly at the center base of 59NAC39+59GTN39triplets. Surprisingly, growth on minimal medium or at low temperature attenuated these mutations. Mononucleotide runs were also hotspots for BPSs, and the rate at which these occurred increased with run length. Comparison with 2000 BPSs accumulated in MMR-proficient strains revealed that both kinds of hotspots appeared in the wild-type spectrum and so are likely to be sites of frequent replication errors. In MMR-defective strains transitions were strand biased, occurring twice as often when A and C rather than T and G were on the lagging-strand template. Loss of nucleotide diphosphate kinase increases the cellular concentration of dCTP, which resulted in increased rates of mutations due to misinsertion of C opposite A and T. In an mmr ndk double mutant strain, these mutations were more frequent when the template A and T were on the leading strand, suggesting that lagging-strand synthesis was more error-prone, or less well corrected by proofreading, than was leading strand synthesis.
KEYWORDSmismatch repair; mutation accumulation; mutation hotspots; DNA replication accuracy; DNA polymerasefidelity
I
N 1961, Seymour Benzer published a paper entitled“On the topography of the geneticfine structure”(Benzer 1961). Using recombinational mapping of 1612 independent spon-taneous mutations in the rII gene of bacteriophage T4, Benzer revealed that not all sites in the gene were equally mutable; over 500 frameshift mutations were recovered at one site, whereas200 sites had only one or two frameshift mutations. Subsequent sequencing showed that Benzer’s hot-spot was a run of six As, as were two other hothot-spots in the gene (Pribnowet al.1981), and such iterated sequences werereadily found to be hotspots for small insertions and deletions (indels) in other model systems (Streisinger et al. 1966; Farabaughet al.1978). The most likely reason for this phe-nomenon is that iterated sequences are “slippery,” i.e., are places where DNA strands can misalign, causing small indels during replication (Kunkel 2004).
The occurrence of hotspots is not restricted to indels, nor to spontaneous mutations. Studies of mutagenesis over the years have revealed that, at both small and large scale, different segments of DNA vary widely in mutability. Yet the under-standing of what determines these differences, particularly in the case of point mutations, is limited to a few special cases, such as methylated bases (Coulondre et al.1978; Leeet al. 2012), quasipalindromic sequences (de Boer and Ripley 1984; Viswanathan et al.2000), and the repeat sequences mentioned above. Even among sites within the same gene with the same local sequence context, base-pair substitution (BPS) rates can vary by more than an order of magnitude (Garibyan et al. 2003). And, at least in mismatch repair
Copyright © 2018 by the Genetics Society of America doi:https://doi.org/10.1534/genetics.118.301237
Manuscript received November 16, 2017; accepted for publication June 14, 2018; published Early Online June 15, 2018.
Supplemental material available at Figshare: https://doi.org/10.25386/genetics. 6512966.
1Corresponding author: Department of Biology, Indiana University, 1001 E. Third St.,
Bloomington, IN 47405. E-mail: [email protected]
2Present address: Computational Biology Department, School of Computer Science,
(MMR)-defective lines, BPS rates vary two to threefold across bacterial genomes in wave-like patterns symmetrical about the origin (Fosteret al.2013; Dettmanet al.2016; Dillon et al.2017). Thus, there is much yet to learn about what determines the mutability of any given DNA site.
Another lesson learned from Benzer’s classic paper is the importance of large numbers when studying rare events such as mutations. Investigating mutational processes with mutation accumulation (MA) protocols that exert minimal selective pressure has the advantage of allowing mutations to accumulate in an unbiased manner. Coupling the MA protocol to whole-genome sequencing (WGS) eliminates the possibility that peculiarities of particular DNA seg-ments can bias the overall results, and also allows mutation rates across the genome to be evaluated. However, the la-boriousness of the MA procedure limits the numbers of mutations that can be analyzed. To overcome this limita-tion, we and others have used mutator strains of model microorganisms.
DNA replication inEscherichia coliis performed by DNA polymerase III (Pol III) holoenzyme—a multisubunit ma-chine with high processivity and accuracy. Thefidelity of replication, which, inE. coli, is1 mistake in 1000 gener-ations (Leeet al.2012), is mainly due to three factors: the intrinsic base-pairingfidelity of the DNA polymerase, error-correction by the exonuclease activity of the proof-reader, and correction of mismatches by the mismatch-repair (MMR) system. InE. coli, MMR is accomplished by four major enzymes. MutS surveys the DNA after replica-tion, finds mismatches and binds to them. MutS then re-cruits MutL, and together they find a nearby GATC site, which, inE. coli, is methylated at the A on the template,
“old,”DNA strand. MutS and MutL then recruit MutH and activate it to nick the DNA on the unmethylated, “new,” DNA strand. The UvrD helicase, together with one of four exonucleases, removes the nicked strand past the mis-match. Pol III holoenzyme then assembles and synthesizes a new strand that, most likely, has the correct sequence. MMR is highly conserved between bacteria and eukaryotes, and, in general, improves replicationfidelity by 100-fold or more (reviewed in Marinus 2012; Ganai and Johansson 2016). In the studies reported here, we have combined the results of 10 separate MA/WGS experiments with MMR-defective E. colistrains to obtain a collection of 30,061 BPSs, giving a database with strong statistical power. In addition,
combin-ing eight MA/WGS experiments with MMR-proficient
strains yielded 1933 BPSs with which to make some statis-tically significant comparisons. We focused on BPS because, in our MA experiments, they are the most prominent class of spontaneous mutations, occurring at 10-times the rate of indels in wild-type cells, and five-times the rate of indels in MMR defective cells (Lee et al. 2012; Foster et al. 2015). The results give insights into the determinants of spontaneous rates of BPSs in different genetic backgrounds, under different growth conditions, and at different DNA sites.
Materials and Methods
Bacterial strains and media
The bacterial strains used and the methods of their con-struction are given in Supplemental Material, Table S1. The oligonucleotides used to perform and confirm genetic manipulations are given in Table S2. Further details are given in Supplemental Materials and Methods. For analysis of wild-type mutation rates and spectra, the results from MA exper-iments with the following strains were combined: PFM2, wild type, 3K and 6K (Leeet al.2012); PFM35,uvrA; PFM40,alkA tagA; PFM88,ada ogt; PFM91,nfi; PFM101, umuDC dinB; and, PFM133,umuDC dinB polB; the mutation rates and spec-tra of all of these sspec-trains were equivalent (Fosteret al.2015).
Mutation accumulation procedure
The MA procedure was as described (Leeet al.2012; Foster et al.2015). The MA lines originated from two or more foun-der colonies, and were propagated through single-colony bottlenecks as described (Lee et al. 2012). Further details are given in Supplemental Materials and Methods.
Estimation of generations
The number of generations that each MA line experienced was estimated from colony size as previous described (Lee et al. 2012). Further details are given in Supplemental Mate-rials and Methods.
Estimation of mutation rates
For each MA experiment the mutation rate was estimated by dividing the total number of mutations accumulated by all the MA lines by the total number of generations that were un-dergone. This value for mutations per generation was then divided by the appropriate number of sites (A:T sites, G:C sites, etc.) to give the conditional mutation rate. The individual mutation rates for each line were used in statistical analyses (see below). Estimation of mutation rates from fluctuation tests is described in Supplemental Materials and Methods.
Determination of DNA strand bias
right replichore are both instances of that triplet with the target purine on the LDST and the target pyrimidine on the LGST. To calculate the strand biases of BPSs, the number of BPSs at each LGST and LDST triplet was divided by the num-ber these triplets in the genome.
Genomic DNA preparation, library construction, sequencing, and SNP calling
Genomic DNA was purified using the PureLink Genomic DNA purification kit (Invitrogen). Libraries were con-structed by the Indiana University Center for Genomics and Bioinformatics (IUCGB). Sequencing of most experi-ments was performed by University of New Hampshire Hubbard Center for Genome Studies using the Illumina HiSeq 2500 platform. For the experiment at low tempera-ture (see below), sequencing was performed by the IUCGB using the Illumina NextSeq platform. Procedures for SNP and indel calling were as described (Leeet al.2012). NCBI Reference Sequence, NC_000913.2 (E. coli K12 strain MG1655) was used as the reference genome sequence. Further details are given in Supplemental Materials and Methods.
Mutation annotation
Variants were annotated using custom scripts. Protein coding gene coordinates were obtained from the GenBank page of reference sequence, NC_000913.2. BPSs in coding sequences were determined to be synonymous or nonsynonymous based on the genetic code. Nonsynonymous BPSs were designated conservative or nonconservative based on the Blosum62 ma-trix (Henikoff and Henikoff 1994) with a value$0 consid-ered conservative.
Statistical analyses
Values and 95% confidence limits (CLs) for ratios between variables were calculated as in Rice (1995). Other statis-tical tests were performed as in Zar (1984). To compare results among MA lines and among experiments, the numbers of mutations had to be normalized by the num-ber of generations. To do these comparisons, we treated the mutations per generation as weighted variables and used the following formulae, adapted from Mandansky (2010), to calculate the variance (Var). For each experi-ment, m = mutations per MA line; g = generations per MA line; mutation rate of a MA line = r = m/g, and mean overall mutation rate = R = M/G, where M =Sm and G =Sg over all MA lines.
VarR¼
P
ðR2rÞ2
N21
! P
g2 G2
!
whereN = number of MA lines being considered. Then SD =pffiffiffiffiV; 95% CL =pffiffiffiffiV3t0.05,S(N21)
To combine the results from multiple experiments, the same calculations were used except (N21) was replaced with S(N21),i.e., (N21) summed over all experiments.
Data availability
Strains are available upon request. Files S1, S2, and S3 have been deposited at Figshare. File S1 contains supplemental Materials and Methods. File S2 contains supplemental Tables, which include strain genotypes and methods of construction, oligonucleotide sequences, and detailed data from each ex-periment. File S3 contains supplemental figures that are referenced in the text. The sequences and SNPs reported in this paper have been deposited with the National Center for Biotechnology Information Sequence Read Archivehttps:// trace.ncbi.nlm.nih.gov/Traces/sra/(accession no. SRP013707) and in the IUScholarWorks Repository (hdl.handle.net/ 2022/20340). Supplemental material available at Figshare:
https://doi.org/10.25386/genetics.6512966.
Results
Transitions at A:T basepairs dominate the BPS spectrum in MMR-defective strains
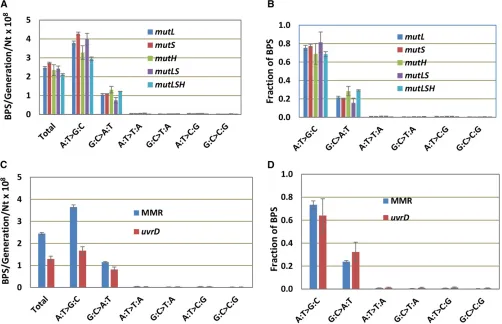
In a previous paper, we reported that, in a mutLdefective E. coli strain, the BPS spectrum is dominated by A:T to G:C transitions (Leeet al.2012). Because this result was contrary to some previous studies reporting that loss of MMR increases the rates of A:T and G:C transitions equally (Choy and Fowler 1985; Cupples and Miller 1988), we repeated MA experi-ments with additional strains deleted for each of the genes that encode the proteins of the MMR system. As shown in Figure 1, A and B, both the mutation rates and the mutational spectra of strains deleted for one, two, or all of the genes that encode the MutSLH complex were nearly the same. In con-trast, although the mutational spectrum was the same, the mutation rate of a strain missing UvrD, the helicase that works with the MMR system, was about half that of the strains defective for MutSLH (Figure 1, C and D). This result implies that another helicase, possibly Rep, an UvrD homo-log, can perform this function.
Because of the uniformity of results with the MutSLH-defective strains, the data from the 10 independent experi-ments, consisting of 334 MA lines, have been combined in Figure 1, C and D and the analyses to follow, and appear labeled as“MMR”(see Tables S3, S4, and S5 for the results of each experiment). In all, these strains underwent almost 250,000 generations, accumulating 30,061 BPSs, resulting in a data set with great statistical power.
2003); this second activity of MutY could explain the domi-nance of A:T transitions in the spectrum of the MMR-defective strains. However, the only major effect of loss of MutY in themutLdeletion strain was an increase in the rate of G:C to T:A mutations, as expected. Mfd is the factor that initiates transcription-coupled repair (TCR)—a pathway that preferen-tially repairs damage to the transcribed DNA strand during active transcription (reviewed in Ganesanet al.2012). While TCR is performed by the proteins that participate in nucleotide excision repair (Selby and Sancar 1993), some reports have also implicated MutS and/or MutL in TCR (Li and Bockrath 1995; Mellon and Champe 1996). We hypothesized that in absence of MMR, TCR was repairing G:C to A:T mutations, or (less likely), creating A:T to G:C mutations, resulting in the observed mutational bias. But, deleting Mfd had little effect on the BPS rate or spectrum of the MMR-defective strain.
Different growth media and temperatures produce different BPS spectra
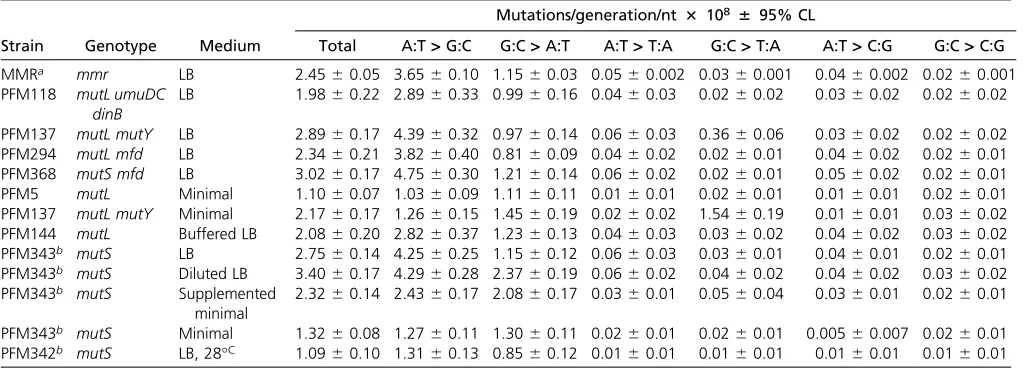
Surprisingly, growing MMR-defective strains on glucose minimal medium completely eliminated the excess A:T tran-sitions, resulting in nearly equal rates for both transitions
(Tables 1 and 2). One important difference between LB and minimal medium is that the latter is buffered at pH 7, whereas the pH of LB, although initially adjusted to 7,first falls and then rises as the cells grow (Luli and Strohl 1990; McFall and Newman 1996). To test whether these pH changes were responsible for the excess A:T to G:C mutations in LB, we repeated the MA experiment with the LB buffered to pH 7. However, the results were the same as when the cells were grown on unbuffered LB (Tables 1 and 2).
Two additional interconnected factors could affect the mutational results obtained on the two media. First, the growth rate of cells on minimal medium, as measured by colony size, is about half of that on LB. A slower growth rate, reflecting slower replication, would give DNA polymerase more time to insert the correct base, and proofreader more time to remove an incorrect base. Second, the physiological state of the cells is greatly different in the two media: cells in LB are mainly metabolizing peptides and amino acids, whereas cells in our minimal medium are utilizing glucose and must synthesize all their amino acids. To evaluate these factors we
first performed MA experiments using two additional media: LB medium diluted 1:5, which slowed the growth rate of the
cells to about that on minimal medium, and minimal glucose medium supplemented with LB at a ratio of 10:1, which increased the growth rate of the cells to about that on LB. As shown in Tables 1 and 2, the results were ambiguous. The almost fourfold ratio of A:T to G:C transitions observed in cells grown on LB was reduced to twofold when the LB was diluted, whereas the 1:1 ratio of A:T to G:C transitions ob-served in cells grown on minimal medium became a 1.2-fold excess of AT transitions when the minimal medium was sup-plemented with LB.
To further distinguish between the effects of growth rate and medium, we performed a MA experiment using LB, but incubating the plates at 28°, which resulted in the cells grow-ing at about the same rate as they did on minimal glucose medium (Table S6). The resulting mutation rate was 40% that of the rate at 37°on LB, which was close to the rate of cells on minimal glucose medium. There were 70% fewer A:T transitions at low temperature than at 37°on LB, but G:C transitions also dropped by 30%, so the ratio of A:T to G:C transitions, 1.5, was again an intermediate number. But since the decline in A:T transitions was more than twice the decline in G:C transitions, it would appear that the growth rate is the dominant factor determining the rate of A:T transitions.
Unexpectedly, when the LB was diluted, the mutation rate increased by25% relative to the rate on undiluted LB. This increase was due entirely to a twofold increase in the rate of G:C transitions, which could indicate that LB also has a sup-pressive effect on these mutations. Thus the domination of A:T transitions when cells grow on LB at 37°may be due, in part, to suppression of transitions at G:C base pairs.
BPS rates are dramatically influenced by the local sequence context
The large number of BPSs accumulated over the entire chro-mosome in the MMR defective strains allows us to analyze the
local sequence context of the BPSs with great statistical power. To evaluate the sequence context of the BPSs we recorded the 19 bases 39and 59to each mutated base. These base se-quences or their reverse complements were oriented so to
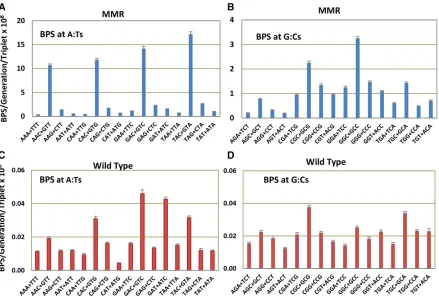
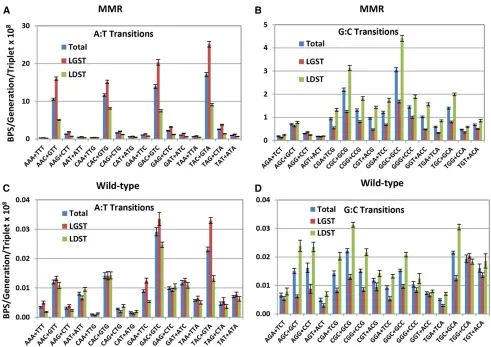
flank the purine member of the mutated base pair. The rate at which each base appeared in each of the 38flanking posi-tions was calculated from all the experiments with MMR de-fective strains, normalized to the number of that base in the genome, and then divided by the overall sum of the bases. The resulting fraction of each base in each position is given in Figure S1, A and B, which reveals that at least two bases on each side of a base can influence its mutation rate. However, the immediately adjacent bases are most important, so our analysis considers only triplets with the target base in the center. While there are 64 possible triplets, in double-stranded DNA a triplet and its reverse complement (each read 59to 39) are equivalent since each pairs with the other on the opposite DNA strand. As shown in Figure 2, A and B, the presence of a C 39to the purine (= a G 59to the pyrim-idine on the other strand) strongly influences the mutation rate. 59NAC39+59GTN39triplets are hotspots for A:T muta-tions (throughout this report the mutational target base is shown in bold); the average mutation rate at these triplets was 12-fold higher than that of the other A:T-containing trip-lets. The mutation rate of A:T base pairs in the most highly mutated triplet, 59TAC39+59GTA39, was 51 times greater than that of the A:T base pairs in the least mutated triplet, 59AAA39+59TTT39. 59NGC39+59GCN39 triplets are also minor hotspots for G:C mutations; the mutation rate at these triplets was 2.4-fold higher than that at the other G:C containing triplets. As we previously reported from a smaller dataset (Sung et al. 2015), the G:C base pairs in the triplets 59CGC39+59GCG39and 59GGC39+59GCC39had the highest mu-tation rates. The mumu-tation rate of G:C base pairs in the most highly mutated triplet, 59GGC39+59GCC39, was 17 times
Table 1 Conditional BPS rates in strains grown on different media and at different temperatures
Strain Genotype Medium
Mutations/generation/nt3 108 6 95% CL
Total A:T>G:C G:C>A:T A:T>T:A G:C>T:A A:T>C:G G:C>C:G
MMRa mmr LB 2.4560.05 3.6560.10 1.1560.03 0.0560.002 0.0360.001 0.0460.002 0.0260.001 PFM118 mutL umuDC
dinB
LB 1.9860.22 2.8960.33 0.9960.16 0.0460.03 0.0260.02 0.0360.02 0.0260.02
PFM137 mutL mutY LB 2.8960.17 4.3960.32 0.9760.14 0.0660.03 0.3660.06 0.0360.02 0.0260.02 PFM294 mutL mfd LB 2.3460.21 3.8260.40 0.8160.09 0.0460.02 0.0260.01 0.0460.02 0.0260.01 PFM368 mutS mfd LB 3.0260.17 4.7560.30 1.2160.14 0.0660.02 0.0260.01 0.0560.02 0.0260.01 PFM5 mutL Minimal 1.1060.07 1.0360.09 1.1160.11 0.0160.01 0.0260.01 0.0160.01 0.0260.01 PFM137 mutL mutY Minimal 2.1760.17 1.2660.15 1.4560.19 0.0260.02 1.5460.19 0.0160.01 0.0360.02 PFM144 mutL Buffered LB 2.0860.20 2.8260.37 1.2360.13 0.0460.03 0.0360.02 0.0460.02 0.0360.02 PFM343b mutS LB 2.7560.14 4.2560.25 1.1560.12 0.0660.03 0.0360.01 0.0460.01 0.0260.01 PFM343b mutS Diluted LB 3.4060.17 4.2960.28 2.3760.19 0.0660.02 0.0460.02 0.0460.02 0.0360.02 PFM343b mutS Supplemented
minimal
2.3260.14 2.4360.17 2.0860.17 0.0360.01 0.0560.04 0.0360.01 0.0260.01
PFM343b mutS Minimal 1.3260.08 1.2760.11 1.3060.11 0.0260.01 0.0260.01 0.00560.007 0.0260.01 PFM342b mutS LB, 28°C 1.0960.10 1.3160.13 0.8560.12 0.0160.01 0.0160.01 0.0160.01 0.0160.01
greater than that of the G:C base pairs in least mutated triplet, 59AGT39+59ACT39.
Of all the mutations at the 59NAC39+5 GTN39hotspots, 97% were transitions. So significant were A:T transitions at these triplets that they alone accounted for the threefold differ-ence between transition rates at A:T and G:C base pairs in the MMR spectrum (Figure 1). Transitions at 59NAC39+59GTN39 triplets also accounted for most of the difference in A:T tran-sition rates when the MMR defective strains were grown on LBvs. minimal medium (Tables 1 and 2). On minimal me-dium, the average A:T transition rate at most triplets was re-duced twofold, but at 59NAC39+59GTN39triplets the rate was reduced fourfold. However, these triplets were nonetheless hotspots; A:T transitions occurred at twice the rate at 59NAC39+59GTN39triplets than at other triplets even when the MMR defective strains were grown on minimal medium (Figure S2).
Mononucleotide runs are hotspots for BPSs
The distribution of the 30,061 BPSs over the 4,639,675 bp in the genome does notfit a Poisson distribution. With a mean of 0.00648 BPSs/bp, there should be only 97 bp mutated twice, and essentially none mutated more than twice. Instead, in the MMR-defective strains, independently-arising BPSs occurred twice at 721 bp, three times at 30 bp, four times at 3 bp, andfive times at 3 bp. To investigate this anomaly, we examined the local sequence of all the base pairs that were mutated more than once. As shown in Table S7, there was a strong bias for repeat mutations to be located at the ends of mononucleotide runs. Indeed, the base pairs mutated four andfive times each were at the ends of runs$5 nucleotides (nt). Strikingly, at two of the base pairs mutatedfive times, there were nine instances of the G:C to C:G transversion—a very rare mutation.
These results prompted us to evaluate BPSs associated with mononucleotide runs throughout the genome. If runs are not hotspots, the expected mutation rate per base pair is simply the
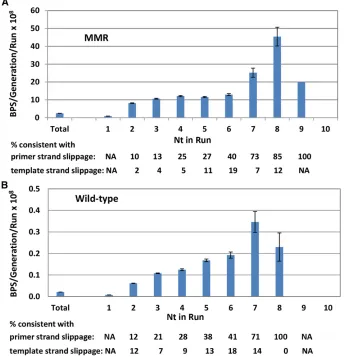
average number of BPSs per base pair. However, as shown in Figure 3A, the rate of BPSs associated with runs increased with the length of the run, especially at runs.6 nt, reaching a max-imum of 18.5-fold greater than expected at base pairs associated with runs of length 8 (there was only one mutation at a run 9 nt, of which there are 19 times in the genome, and no mutations at the single run of 10 nt in the genome). The majority of these BPSs occurred adjacent to runs: of the 2040 BPSs associated with runs$4 nt, 1280 (63%) occurred at the nucleotide next to the run whereas the rest occurred at the last base of the run. BPSs associated with runs could occur by a mechanism known as transient misalignment or dislocation mutagenesis (Fresco and Alberts 1960; Fowleret al.1974; Kunkel and Soni 1988). During DNA replication, either the template or the primer strand loops out but DNA polymerase continues repli-cating. When the strand realigns, it creates a mispair if the 39 base of the primer does not match the 59base of the template. This mechanism is similar to that proposed for frameshift mu-tations (Streisingeret al.1966) and is presumably enhanced at mononucleotide runs where DNA polymerases tend to slip.
By examining the nature of the mispairs, we tested whether this mechanism could explain the BPSs associated with runs. If the primer strand slips out and realigns, it creates a BPS 59 to the run that is templated by the run (Figure S3A). Exam-ination of the sequences showed that 585 (46%) of the 1280 BPSs that occurred adjacent to runs$4 nt were con-sistent with this mechanism. If, instead, the template strand loops out and realigns, it creates a BPS at the last base of the run that is templated by the base 59to the run (Figure S3B). However, only at runs$6 nt was the number of BPSs con-sistent with this mechanism higher than the expected 33%. Of the 48 BPS that occurred at the last base of a run$6 nt, 35 (73%) were consistent with being created by this mecha-nism. This analysis also revealed that the fraction of BPSs associated with runs that could be explained by transient misalignment increased with the length of the run.
Table 2 Fractions of BPSs strains grown on different media and at different temperatures
Strain Genotype Medium
BPS rate/total rate6 95% CL
A:T>G:C G:C>A:T A:T>T:A G:C>T:A A:T>C:G G:C>C:G
MMRa MMRa LB 0.7360.23 0.2460.08 0.0160.005 0.00560.003 0.00860.004 0.00460.002 PFM118 mutL umuDC
dinB
LB 0.7260.16 0.2660.07 0.0160.01 0.0160.01 0.0160.01 0.0160.01
PFM137 mutL mutY LB 0.7560.09 0.1760.04 0.0160.01 0.0660.02 0.00560.005 0.00360.005 PFM294 mutL mfd LB 0.8060.14 0.1860.03 0.0160.01 0.00460.004 0.0160.01 0.00360.004 PFM368 mutS mfd LB 0.7760.08 0.2060.03 0.0160.004 0.00460.003 0.0160.004 0.00360.002 PFM5 mutL Minimal 0.4660.11 0.5260.13 0.00460.007 0.0160.01 0.00360.006 0.0160.01 PFM137 mutL mutY Minimal 0.2960.01 0.3560.02 0.0160.002 0.3760.02 0.00160.001 0.0160.002 PFM144 mutL Buffered LB 0.6760.16 0.3060.06 0.0160.01 0.0160.01 0.0160.01 0.0160.01 PFM343b mutS LB 0.7660.06 0.2160.02 0.0160.005 0.0160.002 0.0160.003 0.00460.002 PFM343b mutS Diluted LB 0.6260.08 0.3560.05 0.0160.004 0.0160.003 0.0160.003 0.00460.003
PFM343b mutS Supplemented
minimal
0.5260.09 0.4660.09 0.0160.01 0.0160.02 0.0260.02 0.00460.005
PFM343b mutS Minimal 0.4860.10 0.5060.11 0.0160.01 0.0160.01 0.00260.006 0.0160.01 PFM342b mutS LB, 28°C 0.5960.08 0.3960.06 0.00260.003 0.00560.003 0.00360.003 0.00660.004
However, it is clear from Figure 3A that not all of the BPSs associated with runs can be explained by transient misalign-ment. Also, of the cases of multiple mutations at a given base pair, in two cases, one each of three andfive occurrences, one mutation of each set was different (specifically, GC to AT in-stead of GC to CG; Table S7). In addition, 78% of the dupli-cate BPSs and 53% of the triplidupli-cate BPSs were at base pairs not associated with runs. Thus, other mechanisms must be responsible for many of these“super hotspots.”
BPSs are DNA-strand biased
In a previous paper (Leeet al.2012), we reported that in a strain deleted for mutL, A:T transitions were twice as fre-quent when A was on the lagging strand template (LGST) and T on the leading strand template (LDST) than when the mutated A:T was in the opposite orientation. In contrast, G:C transitions were twice as frequent when the C was on the LGST and G on the LDST than when the mutated G:C was in the opposite orientation. Similar results were obtained
in MA experiments with a MMR-defective Pseudomonas
aeruginosa strain (Dettman et al. 2016). The data pre-sented here confirm and extend thesefindings. From the 10 experiments with MMR-defective strains reported here (29,234 transitions recovered), the bias for A vs.T on the LGST was 2.44 6 0.09, whereas the expected bias is 0.99
(x2= 2068,P 0); the bias for Cvs.G on the LGST was
2.34 6 0.09, whereas the expected bias is 0.94 (x2 = 696,
P 0) (ratios are means6 95% CLs).
The strand bias in the MMR-defective strains varied with local sequence context (Figure 4, A and B): among A:T tran-sitions, the bias for Avs.T on the LGST varied threefold, with the highest ratio (3.1760.13) at 59AAC39+59GTT39sites, and the lowest (1.2460.12) at 59CAA39+59TTG39sites. Among G:C transitions, the bias for Cvs.G on the LGST variedfi ve-fold, with the highest (3.3060.19) at 59GGT39+59ACC39sites and the lowest (0.65 60.08) at 59AGG39+59CCT39sites (ratios are means695%CLs).
In contrast to transitions, both A:T and G:C transversions in the MMR-defective strains were more likely to occur with the pyrimidine on the LGST and the purine on the LDST (Figure S4). For A:T transversions the ratio was 1.6860.13 instead of the expected 1.01 (x2= 17,P= 331025); for G:C
trans-versions the ratio was 1.1560.11, but this ratio is not sig-nificantly different from expected 0.94 (x2= 1.5,P= 0.22)
(ratios are means695%CLs). There were too few transver-sions to make meaningful conclutransver-sions about the influence of the local sequence on strand bias.
We previously speculated that the strand bias observed for A:T transitions was due to a greater tendency for DNA polymerase to insert a C opposite A when the A templates lagging- rather
than leading-strand synthesis (Leeet al.2012). To test this hypothesis we performed a MA experiment with amutL ndk double mutant strain. Thendkgene encodes nucleoside di-phosphate kinase, and, in its absence, the cellular concen-tration of dCTP increases at least twofold (Schaaper and Mathews 2013) and as much as 12-fold (Maslowska et al. 2015). Relative to the MMR defective strains, loss of Ndk in-creased the BPS rate 5.4 60.1-fold overall, with the largest increases in A:T to G:C transitions (6.760.09-fold), and A:T to C:G transversions (25.6 60.6-fold) (values are means 6 95%CLs).
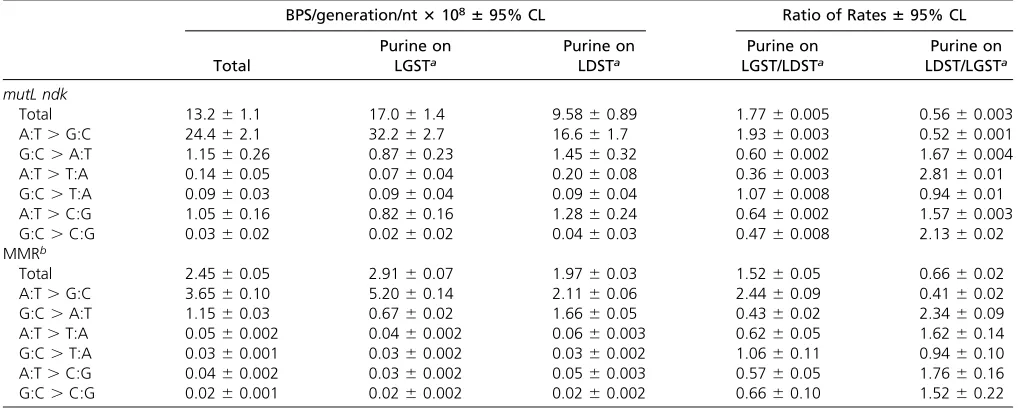
As expected, these enhanced BPS rates can be explained by an increase in the frequency at which Cs are inserted opposite template As and Ts. As shown in Table 3, in the mutL ndk double mutant strain, there was atwofold bias for the tem-plate A and T to be on the LGST (actual biases695%CLs are 1.9360.003 for A and 1.5760.003 for T;x2for the
differ-ences from the 0.99 and 1.01 expected biases are 640, P0, and 13, P, 0.001, respectively). This result supports the hypothesis that C is misinserted about twice as often during lagging-strand synthesis as during leading-strand synthesis. However, the same ratio would result if the proofreader removes the misinserted C twice as frequently when it is on the leading rather than the lagging strand.
In themutL ndkmutant strain the rate of A:T to G:C transi-tions, presumably resulting from C inserted opposite template A, was25-fold greater at 59NAC39triplets than at the other A containing triplets (Figure S5). Interestingly, these same trip-lets were hotspots for A:T to C:G mutations. Assuming these transversions occurred because C was inserted opposite tem-plate T in the complementary 59NTG 39triplet, the misinsertion occurred during leading strand replication. In this orientation, the excess of dCTP in thendk mutLstrain would strongly pro-mote the formation of the G:C basepair 39to the T:C mispair, which would tend to protect the mispair from editing by proof-reader. This“next nucleotide”effect is a well-known property of proofreading DNA polymerases (Fersht 1979; Bloom et al. 1997). Thus, the favorable orientation for the mispair may overcome the normalfidelity of leading strand synthesis.
Alternative explanations for the BPS spectrum and strand bias
It is possible that some of our results could be due to the appearance in the DNA of base analogs with alternative base-pairing properties. For example, deoxyinosine triphosphate (dITP) is produced by deamination of dATP, and, if incorpo-rated into the DNA, will basepair with dTTP and, more stably, dCTP (Alseth et al. 2014). Thus, if incorporated opposite
template T, dITP can cause A:T to G:C transitions if it sub-sequently pairs with C. Deamination of adenine in the DNA produces hypoxanthine, which preferentially pairs with cyto-sine, also causing A:T to G:C transitions. dITP is cleared from the nucleotide pool by the RdgB protein (Chunget al.2002), and hypoxanthine is excised from DNA by a pathway initiated by endonuclease V (Nfi) (Cao 2013). Previous studies have shown that neither the loss of Nfinor of RdgB has a signifi -cant mutagenic consequence, suggesting that these base an-alogs do not contribute to spontaneous mutations (Budke and Kuzminov 2006; Fosteret al.2015). To test if these base analogs are important in the MA experiments reported here, we used fluctuation tests to compare the mutation rates of DrdgBDmutLandDnfiDmutLmutant strains to that of the DmutLparental strain. Loss of neither enzyme had a muta-genic effect (Table S8).
DNA polymerase I (Pol I) is responsible for maturation of the Okasaki fragments produced during lagging strand DNA synthesis. Thus, the bias for A:T transitions to occur when A is on the LGST could be due to Pol I inserting Cs opposite As
during this process or, possibly, during repair synthesis if Pol III disassociates. However, this hypothesis seems unlikely since a Pol I mutant lacking its proofreading function, which has at least a sevenfold greater error frequency than the wild-type Pol I (Bebeneket al.1990), had only a modest effect on spontaneous mutation rates (Makiela-Dzbenska et al.2009, 2011). These authors concluded that the only role of Pol I in replication is to accurately fill in the gaps left by Okasaki fragment maturation (Fijalkowskaet al.2012).
Mutational features found in MMR-defective strains are also evident in wild-type strains
The low BPS rate of wild-type strains (120-fold lower than that of MMR-defective strains) makes it difficult to accumu-late sufficient numbers of mutations to allow as detailed anal-ysis of mutational features as presented above. However, by combining the results obtained for the wild-type strain (Lee et al.2012) with those obtained from MA experiments per-formed with strains carrying DNA repair defects that did not affect the mutational rate or spectrum (Fosteret al.2015), we
were able to achieve 1933 BPSs from eight independent ex-periments for analyses (seeMaterials and Methods).
The strong sequence context biases seen in the spec-trum from the MMR-defective strains are also evident in the wild-type spectrum (Figure 2, C and D). In particular, 59NAC39+59GTN39triplets are hotspots for A:T mutations, particularly transitions. 59GAT39+59ATC39triplets are also hotspots, but these are entirely due to transversion muta-tions occurring at GATC sequences.E. coli’s Dam methylase methylates the six-position of adenines in GATC sequences, making the adenine prone to depurination, which results in transversion mutations (Leeet al.2012). These sites are also hotspots for transversions in the MMR-defective strains, but the dominance of transition mutations obscures this result (Figure 2A). In fact, in the MMR-defective strains the rate of A:T transversions at GATC sites was eightfold higher than at all other A:T base pairs, but in the wild-type strains it was only fourfold higher, meaning that MMR prevents many mutations at these sites.
Also, as in the MMR-defective strains, in the wild-type strains BPSs associated with mononucleotide runs occurred at rates far greater than expected (Figure 3B). The rate of BPSs increased with the length of the run, reaching a max-imum of 17.5-fold greater than expected at nucleotides associated with runs of length 7 (in the wild-type strains there was only one mutation at runs of 8 nt, which occur 216 times in the genome, and no mutations at longer runs). Of the 179 BPS associated with runs $4 nt, 81 (45%) were consistent with being due to transient misalignment.
The DNA strand bias of transitions accumulated in the wild-type strains was not as strong as the strand bias in the MMR-defective stains. From the eight experiments with MMR proficient strains (1052 transitions recovered), the bias for Cvs.
G on the LGST was 1.91 6 0.05, which is significantly greater than the expected 0.94 (x2 = 39, P 0). However, the bias
for Avs.T on the LGST was 1.23 6 0.05, which is not signif-icantly different from the 0.99 expected (x2 = 2,P = 0.12)
(ratios are means6 95%CLs). Although the biases among A:T transitions varied with sequence context (Figure 4, C and D), only at 59TAC39+59GTA39sites, where the ratio of Avs.T on the LGST was 2.5 6 0.2, were enough mutations recovered so that the bias was significantly greater than expected (x2 = 4, P = 0.03) (ratios are means6 95%CLs). A similar reduction of strand bias when MMR was active was also seen in MA experiments with aP. aeruginosastrain (Dettmanet al.2016).
The efficiency of MMR is influenced by the local sequence context
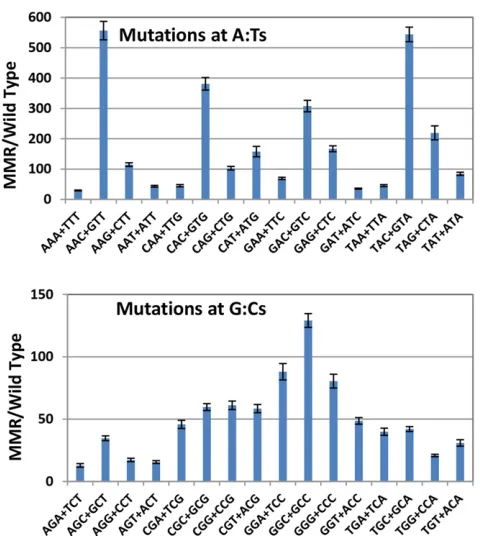
One explanation for the sequence bias of BPS rates is that the efficiency of MMR is low in certain sequence contexts,e.g., 59GAC39+59GTC39triplets, and thus mutation rates are high at those sites in wild-type strains. However, this is not the case. MMR efficiency can be estimated by dividing the muta-tion rate at a given sequence context determined in MMR defective strains by that determined in MMR-proficient strains. As shown in Figure 5, when this is done, the efficiency of MMR varies 43-fold with sequence context. Importantly, the 59NAC39+59GTN39 hotspots are among the most effi -ciently repaired by MMR; thus, the fact that these sites are hotspots in the wild-type strains is not because they are poor substrates for MMR. In contrast, mismatches associated with mononucleotide runs are not particularly good substrates for MMR. MMR efficiency does not depend on run length and the MMR/WT ratio for BPSs associated with runs $4 nts was 87 6 3 (mean6 95%CL), somewhat less than the 120-fold ratio calculated for all BPSs.
Table 3 Rate and strand bias of themutL ndkmutant strain compared to MMR-defective strains
BPS/generation/nt3108695% CL Ratio of Rates695% CL
Total
Purine on LGSTa
Purine on LDSTa
Purine on LGST/LDSTa
Purine on LDST/LGSTa
mutL ndk
Total 13.261.1 17.061.4 9.5860.89 1.7760.005 0.5660.003
A:T.G:C 24.462.1 32.262.7 16.661.7 1.9360.003 0.5260.001
G:C.A:T 1.1560.26 0.8760.23 1.4560.32 0.6060.002 1.6760.004
A:T.T:A 0.1460.05 0.0760.04 0.2060.08 0.3660.003 2.8160.01
G:C.T:A 0.0960.03 0.0960.04 0.0960.04 1.0760.008 0.9460.01
A:T.C:G 1.0560.16 0.8260.16 1.2860.24 0.6460.002 1.5760.003
G:C.C:G 0.0360.02 0.0260.02 0.0460.03 0.4760.008 2.1360.02
MMRb
Total 2.4560.05 2.9160.07 1.9760.03 1.5260.05 0.6660.02
A:T.G:C 3.6560.10 5.2060.14 2.1160.06 2.4460.09 0.4160.02
G:C.A:T 1.1560.03 0.6760.02 1.6660.05 0.4360.02 2.3460.09
A:T.T:A 0.0560.002 0.0460.002 0.0660.003 0.6260.05 1.6260.14
G:C.T:A 0.0360.001 0.0360.002 0.0360.002 1.0660.11 0.9460.10
A:T.C:G 0.0460.002 0.0360.002 0.0560.003 0.5760.05 1.7660.16
G:C.C:G 0.0260.001 0.0260.002 0.0260.002 0.6660.10 1.5260.22
aLGST, lagging strand template; LDST, leading strand template.
Discussion
The observations presented here can be summarized as follows:
1. In MMR-defective strains, the spectrum of BPSs is domi-nated by A:T transitions, which occur at a rate threefold greater than the rate of G:C transitions, and 75- to nearly 200-fold greater than the rates of all other BPSs. The preponderance of A:T transitions over G:C transitions is almost entirely due to mutations at 59NAC39+59GTN39 sites.
2. The overall rate of BPSs in MMR-defective strains is 120-fold greater than in MMR-proficient strains. At A:T sites the increase is nearly 200-fold, whereas at G:C sites it averages only 50-fold.
3. The increase in BPS rate with the loss of MMR varies with local sequence context. Among A:T sites, the mutation rates at 59NAC39+59GTN39sites are increased 300–500 fold, whereas the mutation rates at 59NAA39+59TTN39 sites are increased only 30–70 fold. Among G:C sites, the variation in mutation rate increase is smaller, but, nonetheless, the range is 10-fold, with a maximum of 130-fold at 59GGC39+59GCC39 sites and a minimum of 13-fold at 59AGA39+59TCT39sites.
4. When MMR-defective strains are grown on minimal me-dium, the BPS rate is reduced twofold and the rates of G:C
and A:T transitions are equalized. Slowing the growth rate of the cells by incubating them on LB medium at low temperature reduces the overall BPS rate by 60% but has a twofold greater effect on A:T than on G:C transi-tions. Thus, growth rate appears to be an important factor in the production of A:T transitions, but LB also may also promote A:T and suppress G:C transitions.
5. Base-pairs adjacent to or within mononucleotide runs are particularly vulnerable to mutation in both MMR-defective and MMR-proficient strains. Many, but not all, of these BPS appear to be due to transient misalignment of either the primer or the template DNA strand during replication.
6. In MMR-defective strains there is a twofold bias for A:T transitions to occur when the A is on the lagging strand template (LGST) and a twofold bias for G:C transitions to occur when the C is on the LGST. Only the G:C bias is significant in wild-type strains. Increasing the cellular con-centration of dCTP by deleting thendkgene resulted in an increase in BPSs consistent with misinsertion of C opposite template As and Ts. These occurred about twofold more frequently when the A or T was on the LGST rather than the LDST.
7. Over all BPSs, the efficiency of MMR correction varies 43-fold with sequence context. The mismatches leading to the high rate of transitions at 59NAC39+59GTN39sites are corrected by MMR ninefold more efficiently than the mismatches leading to the low rate of transitions at 59NGA/T39+59T/ACN39sites.
That MMR correction is influenced by both the nature of the mismatch and its sequence context has long been appreciated (Cox et al.1972; Modrich 1991). Thus, it is not surprising that previous studies of the mutational consequences of loss of MMR, which have used a variety of mutational targets, have produced some divergent results. However, all previous reports have identified transitions as the major BPS enhanced by the loss of MMR. By using an unbiased protocol with the entire genome as the mutation target, we have confirmed these previous results and extended them with statistical power hitherto not possible.
Ourfinding that 59NAC39+59GTN39sites are hotspots for transitions could not have been seen in studies using rever-sion assays because such assays are limited to one, or a few, mutational targets. But our results were presaged by studies that employed mutational targets that, while still limited to a single gene, were broad enough to reveal the influence of local sequence context. Using mutation of the lacI gene to give the LacI2d phenotype, Schaaper and Dunn (1987),
found that A:T transitions were twofold more frequent than G:C transitions in MMR-defective strains, and 88% of the A:T transitions occurred at seven 59NAC39+59GTN39sites (Schaaper and Dunn 1987). Likewise, using knockout muta-tions of the bacteriophage P22mntgene, Wuet al.(1990) found that A:T transitions were nearly fourfold more fre-quent than G:C transitions in MMR-defective strains; two
Figure 5 The efficiency of MMR is influenced by the local sequence con-text. Bars represent the mean ratio of mutation rates at each triplet in MMR defectivevs.MMR proficient strains. Error bars are 95%CL calculated for the ratio. TheX-axis labels are the 32 sets of nonredundant triplets read 59
59NAC39+59GTN39 triplets accounted for 36% of the A:T transitions, although one 59GAG39+59CTC39site was equally mutated (Wu et al. 1990). Finally, using mutation to RifR,
which occurs by BPSs at 80 sites in therpoBgene, Garibyan et al. (2003), found that 56% of the A:T transitions in a mutSmutant strain occurred at one 59GAC39+59GTC39triplet (Garibyan et al.2003). However, in all of these studies, not every 59NAC39+59GTN39triplet that could be mutated was mutated. In addition, among the seven 59NAC39+59GTN39 sites at which AT transitions were recorded in the lacI2d data, there was an eightfold difference in mutation fre-quency (Schaaper and Dunn 1987). From our results, of the 512,268 59NAC39+59GTN39 triplets in the genome, 3% were mutated once and 0.1% were mutated more than once. Even disregarding the BPSs associated with mono-nucleotide runs, twice as many 59NAC39+59GTN39 sites than expected were mutated more than once. Thus, even within a mutation-prone sequence context, features in ad-dition to the adjacent bases must influence the mutation rate of a given base pair. However, analysis of 19 bases on each side of each BPS did not reveal any additional sequence contexts influencing the probability of a given base being re-peatedly mutated (Figure S6)
The influences of local sequence context observed in our MA experiments have similarities and differences with the results of MA experiments with other bacteria. Mutations at 59NAC39+59GTN39triplets dominated the BPSs in MA exper-iments with a MMR-defectiveP. aeruginosastrain (Dettman et al.2016), but in MA experiments withBacillus subtilis, both Sunget al.(2015) and Schroederet al.(2016) found that the most highly mutated triplets in both MMR-defective and wild-type strains were 59CAC39+59GTG39, 59CGC39+59GCG39, and 59CGG39+59GCC39. While 59CAC39+59GTG39 and 59CGC39+59GCG39 (but not 59CGG39+59GCC39) were frequently mutated in the experiments withE. colireported here, A:T transitions at all 59NAC39+59GTN39sites domi-nated the sequence context spectrum in both wild-type and, particularly, MMR-defective strains (Figure 2). But it is clear from these comparisons that G:C base pairs adjacent to the target base increase the probability of its mutation. In-deed, long ago the triplet 59GGC39+59GCC39was identified as a transition hotspot in therIIgene of bacteriophage T4 (Singer 1984). G:C basepairs surrounding a base could potentiate misinsertion by DNA polymerase through base-stacking inter-actions (Kool 2001), and/or, because of their strong base-pairing, could prevent removal of the mismatch by inhibiting dissociation and transfer of the primer strand to the active site of the 39exonuclease (Petruska and Goodman 1985; Bloom et al.1994). Lowering the temperature and, thus, slowing down polymerization, would tend to counter these effects by giving proofreader more time to compete with the forward synthesis by polymerase, as has been observed when polymerization is slowed by lowering dNTP levels (Clayton et al. 1979). However, 59NAC39+59GTN39 sites are also hotspots in strains defective for proofreading, which suggests that polymerase has an intrinsic propensity for
making errors at these sites (see Niccum et al., 2018, ac-companying paper). A slower growth rate could counter this tendency by allowing polymerase more time to cor-rectly discriminate between correct and incorrect incoming nucleotide.
Mononucleotide runs are hotspots for frameshift muta-tions (Streisinger et al.1966; Kunkel 1986), and we pre-viously reported that in our MA experiments the indel rate increases exponentially with the length of the run (Leeet al. 2012). The majority of such mutations can be attributed to polymerase slippage,i.e., during replication DNA polymer-ase allows either the template or the nascent (primer) strand to loop out and then continues synthesis, producing either an insertion or a deletion. Our data show that mono-nucleotide runs are also hotspots for BPSs—in both MMR-proficient and MMR-deficient strains base pairs adjacent to runs $4 nt long were two- to eightfold more likely to be mutated than expected and, in general, the mutation rate increased with run length (Figure 3). About half of these mutations could have been due to transient misalignment (Fresco and Alberts 1960; Fowler et al.1974; Kunkel and Soni 1988),i.e., slippage of the primer or template strand at the repeat followed by insertion of a base and realignment, placing the incorrect base opposite the template base adja-cent to the run, in the case of primer loop-out, or at the end of the run, in the case of template loop-out. Replication would then continue, preserving the mismatch, which, if uncorrected by proofreading, would become a mutation in the next round of replication (Figure S3). However, the mechanism producing BPSs at the other half of the hotspots remains a mystery. Possibly replicating the “slippery”DNA affects the polymerasefidelity or the efficiency of proofread-ing at adjacent bases.
Acknowledgments
We thank the following past members of the P.L.F. labora-tory for technical assistance: H. Bedwell-Ivers, C. Coplen, M. Durham, J. Eagan, J. Ferlmann, N. Gruenhagen, T. Gruenhagen, J. Healy, N. Ivers, C. Klineman, R. Meyer, R. Newlon, D. Osiecki, S. Patel, I. Rameses, L. Rich, S. Riffert, H. Rivera, D. Simon, K. Smith, B. Souders, K. Storvik, L. Tran, L. Whitson, B. Wojcik, N. Yahaya, and A. Ying Yi Tan. We also thank the anonymous reviewers of this manuscript for suggestions. The National BioResource Project at the (Jap-anese) National Institute of Genetics provided bacterial strains and plasmids. This research was supported by a United States (US) Army Research Office Multidisciplinary University Research Initiative (MURI) Award [W911NF-09-1-0444] to P.L.F. and H.T. and a National Institutes of Health award [T32 GM007757] to B.A.N.
Note added in proof:See Niccumet al. 2018 (pp. 1043– 1054) in this issue for a related work.
Literature Cited
Alseth, I., B. Dalhus, and M. Bjoras, 2014 Inosine in DNA and RNA. Curr. Opin. Genet. Dev. 26: 116–123. https://doi.org/ 10.1016/j.gde.2014.07.008
Bebenek, K., C. M. Joyce, M. P. Fitzgerald, and T. A. Kunkel, 1990 The fidelity of DNA synthesis catalyzed by derivatives ofEscherichia coliDNA polymerase I. J. Biol. Chem. 265: 13878–13887. Benzer, S., 1961 On the topography of the geneticfine structure.
Proc. Natl. Acad. Sci. USA 47: 403–415.
Bhagwat, A. S., W. Hao, J. P. Townes, H. Lee, H. Tang et al., 2016 Strand-biased cytosine deamination at the replication fork causes cytosine to thymine mutations in Escherichia coli. Proc. Natl. Acad. Sci. USA 113: 2176–2181. https://doi.org/ 10.1073/pnas.1522325113
Bloom, L. B., M. R. Otto, R. Eritja, L. J. Reha-Krantz, M. F. Goodman
et al., 1994 Pre-steady-state kinetic analysis of sequence-dependent nucleotide excision by the 39-exonuclease activity of bacteriophage T4 DNA polymerase. Biochemistry 33: 7576–7586. Bloom, L. B., X. Chen, D. K. Fygenson, J. Turner, M. O’Donnellet al., 1997 Fidelity of Escherichia coliDNA polymerase III holoen-zyme. The effects of beta, gamma complex processivity proteins and epsilon proofreading exonuclease on nucleotide misincor-poration efficiencies. J. Biol. Chem. 272: 27919–27930. Budke, B., and A. Kuzminov, 2006 Hypoxanthine incorporation is
nonmutagenic inEscherichia coli. J. Bacteriol. 188: 6553–6560. Cao, W., 2013 Endonuclease V: an unusual enzyme for repair of DNA deamination. Cell. Mol. Life Sci. 70: 3145–3156.https:// doi.org/10.1007/s00018-012-1222-z
Choy, H. E., and R. G. Fowler, 1985 The specificity of base pair substitutions induced by themutLandmutSmutators inE. coli. Mutat. Res. 142: 93–97.
Chung, J. H., H. Y. Park, J. H. Lee, and Y. Jang, 2002 Identification of the dITP- and XTP-hydrolyzing protein fromEscherichia coli. J. Biochem. Mol. Biol. 35: 403–408.
Clayton, L. K., M. F. Goodman, E. W. Branscomb, and D. J. Galas, 1979 Error induction and correction by mutant and wild type T4 DNA polymerases. Kinetic error discrimination mechanisms. J. Biol. Chem. 254: 1902–1912.
Coulondre, C., J. H. Miller, P. J. Farabaugh, and W. Gilbert, 1978 Molecular basis of base substitution hotspots in Escheri-chia coli. Nature 274: 775–780.
Cox, E. C., G. E. Degnen, and M. L. Scheppe, 1972 Mutator gene studies inEscherichia coli: themutSgene. Genetics 72: 551–567. Cupples, C. G., and J. H. Miller, 1988 Effects of amino acid sub-stitutions at the active site in Escherichia colib-galactosidase. Genetics 120: 637–644.
de Boer, J. G., and L. S. Ripley, 1984 Demonstration of the pro-duction of frameshift and base-substitution mutations by quasi-palindromic DNA sequences. Proc. Natl. Acad. Sci. USA 81: 5528–5531.
Dettman, J. R., J. L. Sztepanacz, and R. Kassen, 2016 The prop-erties of spontaneous mutations in the opportunistic pathogen
Pseudomonas aeruginosa. BMC Genomics 17: 27.
Dillon, M. M., W. Sung, R. Sebra, M. Lynch, and V. S. Cooper, 2017 Genome-wide biases in the rate and molecular spectrum of spontaneous mutations inVibrio choleraeandVibriofischeri. Mol. Biol. Evol. 34: 93–109. https://doi.org/10.1093/molbev/ msw224
Farabaugh, P. J., U. Schmeissner, M. Hofer, and J. H. Miller, 1978 Genetic studies of thelacrepressor VII. On the molecular nature of spontaneous hotspots in thelacIgene ofEscherichia coli. J. Mol. Biol. 126: 847–863.
Fersht, A. R., 1979 Fidelity of replication of phage phi X174 DNA by DNA polymerase III holoenzyme: spontaneous mutation by misincorporation. Proc. Natl. Acad. Sci. USA 76: 4946–4950. Fijalkowska, I. J., R. M. Schaaper, and P. Jonczyk, 2012 DNA
replication fidelity inEscherichia coli: a multi-DNA polymerase affair. FEMS Microbiol. Rev. 36: 1105–1121. https://doi.org/ 10.1111/j.1574-6976.2012.00338.x
Foster, P. L., A. J. Hanson, H. Lee, E. M. Popodi, and H. Tang, 2013 On the mutational topology of the bacterial genome. G3 (Bethesda) 3: 399–407.https://doi.org/10.1534/g3.112. 005355
Foster, P. L., H. Lee, E. Popodi, J. P. Townes, and H. Tang, 2015 Determinants of spontaneous mutation in the bacterium
Escherichia colias revealed by whole-genome sequencing. Proc. Natl. Acad. Sci. USA 112: E5990–E5999. https://doi.org/ 10.1073/pnas.1512136112
Fowler, R. G., G. E. Degnen, and E. C. Cox, 1974 Mutational specificity of a conditional Escherichia coli mutator, mutD5. Mol. Gen. Genet. 133: 179–191.
Fresco, J. R., and B. M. Alberts, 1960 The accommodation of non-complementary bases in helical polyribonucleotides and deoxy-ribonucleic acids. Proc. Natl. Acad. Sci. USA 46: 311–321. Ganai, R. A., and E. Johansson, 2016 DNA replication-a matter
offidelity. Mol. Cell 62: 745–755.https://doi.org/10.1016/ j.molcel.2016.05.003
Ganesan, A., G. Spivak, and P. C. Hanawalt, 2012 Transcription-coupled DNA repair in prokaryotes. Prog. Mol. Biol. Transl. Sci. 110: 25–40. https://doi.org/10.1016/B978-0-12-387665-2.00002-X
Garibyan, L., T. Huang, M. Kim, E. Wolff, A. Nguyen et al., 2003 Use of therpoBgene to determine the specificity of base substitution mutations on theEscherichia colichromosome. DNA Repair (Amst.) 2: 593–608.
Gawel, D., I. J. Fijalkowska, P. Jonczyk, and R. M. Schaaper, 2014 Effect of dNTP pool alterations on fidelity of leading and lagging strand DNA replication inE. coli. Mutat. Res. 759: 22–28.https://doi.org/10.1016/j.mrfmmm.2013.11.003
Henikoff, S., and J. G. Henikoff, 1994 Protein family classification based on searching a database of blocks. Genomics 19: 97–107. Kim, M., T. Huang, and J. H. Miller, 2003 Competition between MutY and mismatch repair at A x C mispairsin vivo. J. Bacteriol. 185: 4626–4629.
Kool, E. T., 2001 Hydrogen bonding, base stacking, and steric effects in DNA replication. Annu. Rev. Biophys. Biomol. Struct. 30: 1–22. Kunkel, T. A., 1986 Frameshift mutagenesis by eucaryotic DNA
Kunkel, T. A., 2004 DNA replicationfidelity. J. Biol. Chem. 279: 16895–16898.
Kunkel, T. A., and A. Soni, 1988 Mutagenesis by transient mis-alignment. J. Biol. Chem. 263: 14784–14789.
Lee, H., E. Popodi, H. Tang, and P. L. Foster, 2012 Rate and molecular spectrum of spontaneous mutations in the bacterium
Escherichia coli as determined by whole-genome sequencing. Proc. Natl. Acad. Sci. USA 109: E2774–E2783. https://doi. org/10.1073/pnas.1210309109
Li, B. H., and R. Bockrath, 1995 Mutation frequency decline in Escherichia coli. I. Effects of defects in mismatch repair. Mol. Gen. Genet. 249: 585–590.
Luli, G. W., and W. R. Strohl, 1990 Comparison of growth, acetate production, and acetate inhibition ofEscherichia coli strains in batch and fed-batch fermentations. Appl. Environ. Microbiol. 56: 1004–1011.
Makiela-Dzbenska, K., M. Jaszczur, M. Banach-Orlowska, P. Jonczyk, R. M. Schaaperet al., 2009 Role ofEscherichia coli
DNA polymerase I in chromosomal DNA replicationfidelity. Mol. Microbiol. 74: 1114–1127. https://doi.org/10.1111/j.1365-2958.2009.06921.x
Makiela-Dzbenska, K., P. Jonczyk, R. M. Schaaper, and I. J. Fijalkowska, 2011 Proofreading deficiency of Pol I increases the levels of spontaneousrpoBmutations inE. coli. Mutat. Res. 712: 28–32.https://doi.org/10.1016/j.mrfmmm.2011.03.011
Mandansky, A., 2010 Weighted standard error and its impact on significance testing. Available at: www.analyticalgroup.com/ download/WEIGHTED_MEAN.pdf. Accessed: March 16, 2017. Marinus, M. G., 2012 DNA mismatch repair. Ecosal Plus.https://
doi.org/10.1128/ecosalplus.7.2.5
Maslowska, K. H., K. Makiela-Dzbenska, I. J. Fijalkowska, and R. M. Schaaper, 2015 Suppression of the E. coliSOS response by dNTP pool changes. Nucleic Acids Res. 43: 4109–4120. McFall, E., and E. R. Newman, 1996 Amino acids as carbon
sour-ces, pp. 358–379 inEscherichia coli and Salmonella Cellular and Molecular Biology, edited by F. C. Neidhardt, R. Curtiss III, J. L. Ingraham, E. C. C. Lin, and K. B. Low et al., American Society of Microbiology, Washington, DC.
Mellon, I., and G. N. Champe, 1996 Products of DNA mismatch repair genes mutS and mutL are required for transcription-coupled nucleotide-excision repair of the lactose operon in
Escherichia coli. Proc. Natl. Acad. Sci. USA 93: 1292–1297. Modrich, P., 1991 Mechanisms and biological effects of mismatch
repair. Annu. Rev. Genet. 25: 229–253.
Niccum, B. A., H. Lee, W. MohammedIsmail, H. Tang, and P. L. Foster, 2018 The spectrum of replication errors in the absence of error correction assayed across the whole genome of Escher-ichia coli. Genetics 209: 1043–1054
Petruska, J., and M. F. Goodman, 1985 Influence of neighboring bases on DNA polymerase insertion and proofreading fidelity. J. Biol. Chem. 260: 7533–7539.
Pribnow, D., D. C. Sigurdson, L. Gold, B. S. Singer, C. Napoliet al., 1981 rII cistrons of bacteriophage T4. DNA sequence around the intercistronic divide and positions of genetic landmarks. J. Mol. Biol. 149: 337–376.
Rice, J. A., 1995 Mathematical Statistics and Data Analysis. Wadsworth Publishing Company, Belmont, CA.
Schaaper, R. M., and R. L. Dunn, 1987 Spectra of spontaneous mutations inEscherichia colistrains defective in mismatch cor-rection: the nature ofin vivoDNA replication errors. Proc. Natl. Acad. Sci. USA 84: 6220–6224.
Schaaper, R. M., and C. K. Mathews, 2013 Mutational conse-quences of dNTP pool imbalances inE. coli. DNA Repair (Amst.) 12: 73–79.https://doi.org/10.1016/j.dnarep.2012.10.011
Schroeder, J. W., W. G. Hirst, G. A. Szewczyk, and L. A. Simmons, 2016 The effect of local sequence context on mutational bias of genes encoded on the leading and lagging strands. Curr. Biol. 26: 692–697.https://doi.org/10.1016/j.cub.2016.01.016
Selby, C. P., and A. Sancar, 1993 Transcription-repair coupling and mutation frequency decline. J. Bacteriol. 175: 7509–7514. Singer, B. S., 1984 A hotspot for transition mutations in the rIIB gene of bacteriophage T4. I. The extent of the hotspot. Mol. Gen. Genet. 193: 104–109.
Streisinger, G., Y. Okada, J. Emrich, J. Newton, A. Tsugita et al., 1966 Frameshift mutations and the genetic code. Cold Spring Harb. Symp. Quant. Biol. 31: 77–84.
Sung, W., M. S. Ackerman, J. F. Gout, S. F. Miller, E. Williamset al., 2015 Asymmetric context-dependent mutation patterns re-vealed through mutation-accumulation experiments. Mol. Biol. Evol. 32: 1672–1683.https://doi.org/10.1093/molbev/msv055
Viswanathan, M., J. J. Lacirignola, R. L. Hurley, and S. T. Lovett, 2000 A novel mutational hotspot in a natural quasipalindrome inEscherichia coli. J. Mol. Biol. 302: 553–564.
Wu, T. H., C. H. Clarke, and M. G. Marinus, 1990 Specificity of
Escherichia coli mutDandmutLmutator strains. Gene 87: 1–5. Zar, J. H., 1984 Biostatistical Analysis. Prentice Hall, Englewood Cliffs, NJ.