ISSN(Online): 2320-9801
ISSN (Print): 2320-9798
I
nternational
J
ournal of
I
nnovative
R
esearch in
C
omputer
and
C
ommunication
E
ngineering
(An ISO 3297: 2007 Certified Organization)
Vol. 3, Issue 7, July 2015
Performance Evaluation of Radar Systems
Akash Kumar Shrivas, Anirudh Mudaliar
Assistant Professor, Dept. of ETC, SSEC, (SSTC), Bhilai, Chattisgarh , India
Assistant Professor, Dept. of ETC, SSGI, (SSTC), Bhilai, Chattisgarh , India
ABSTRACT: After warfare II radio detection has been more and more used as an integral a part of complicated
applications like air-traffic management, reconnaissance mission and police investigation, navigation and weather, and missile targeting and defence. Analysis of measuring systems for such applications needs representing the radar operation and performance within the context of the system and also the external setting. The measuring system performance should be evaluated, and also the impact of measuring system operation on system performance should be quantified. fashionable measuring system systems area unit procured with tight specifications on an outsized range of various parameters. This paper describes analysis of SNR versus detection vary for various values of RCS conjointly evaluating the performance of various modes of recent measuring systems and discusses the accuracy of that they're capable. it's within the interests each of the client and of the provider that the procedures used appraise measuring system performance area unit mathematically rigorous, precise and as efficient as attainable.
KEYWORDS: Modern radar systems, SNR, RCS.
I. INTRODUCTION
Radar is An instrument that radiates non particulate radiation within the area, that detects and locates of objects. Today, it's wide used for speed estimation, imaging, and plenty of different functions. The principle of measuring device operates likes to undulation reflection. If any wave sound incident on the thing (target) (like rocky ravine and cave), it'll be mirrored and detected, this undulation reflective is termed echo. If sound speed is thought, we will estimate the gap and direction of the objects. measuring device systems area unit composed of a transmitter that radiates magnetic attraction waves of a selected wave shape and a receiver that detects the echo came back from the target. solely a little portion of the transmitted energy is re-radiated back to the measuring device. These echoes can processed by the measuring device receiver to extract target info like (range, speed, direction, position and others).
The vary to the target is evaluated from the travelling time of the wave. The direction of the target is set by the arrival angle of the echoed wave. The relative speed of the target is set from the propagation of the came back signal. measuring device may be classified in terms of ground based mostly, air borne and ship based mostly measuring device systems can also be classified into varied classes supported the particular measuring device characteristics, like the band, antenna sort, and waveforms used, conjointly classified by the categories of waveforms or in operation frequency.
ISSN(Online): 2320-9801
ISSN (Print): 2320-9798
I
nternational
J
ournal of
I
nnovative
R
esearch in
C
omputer
and
C
ommunication
E
ngineering
(An ISO 3297: 2007 Certified Organization)
Vol. 3, Issue 7, July 2015
II. RELATED WORK
In the signal-processing environment, computer simulation is used extensively in developing complex systems, including radar performance systems [1]. Second paper deals with the minimum detection range versus maximum signal to noise ratio (SNR) for several choices parameters like (peak power percent, radar cross section (RCS), antenna gain, coherently pulses, and duty cycle) by using MATALAB simulation program, these programs have been developed to make them easy for any user of evaluating the radar range and SNR equations and make them so faster and more convenient [2]. This paper has presented a modeling scenario which includes multiple-input multiple-output (MIMO radar in a cooperative high altitude aeronautical platforms (HAAPs) relay with conventional radar system . Radar detection range and probability of detection simulation based on cooperative diversity in presence of a fluctuation target model is performed for the cases of single ground radar, with one cooperative HAAP relay and with two cooperative HAAP relays[3]. The RPAS software package developed in MATLAB can be fully integrated into any course with little effort and can provide a viable method for solving problems in engineering and technology curriculum. To analyze the performance of these radars at a system level, it is practical to rely on basic radar principles to model their performance, using the top-level parameters to characterize the radar design. Computer simulation is the most practical method of supporting system analysis due to the complex system interactions between radars and parameters relating to the environment [4]. The transmitted signal for pulse radars are divided into pulse modulated with the fixed carrier frequency signal that is used to measure the range and radial velocity and pulse modulated with compression carrier such as linear frequency modulation (LFM) that is used to improve the range resolution of the radar[5].
III.RADAR RANGE EQUATION
The distance of the target (object) is determined by traveling of magnetism waves at speed of light-weight,
8
3 10
/ sec
C
m
. The target‘s vary (R), is computed by measure the time delay Dt , it takes a pulse to travel two means path between the radio detection and ranging and therefore the target, as following :.
2
t C
R
(1)
The factor of (1/2) is needed for two way time delay. If the respective travel time Dt is known, the distance between a target and the radar can be calculated by using this equation. In general, most functions of radar are time dependent. The time synchronization between the transmitter and receiver of a radar is required for range measurment. Radar radiate each pulse during transmit time or pulse width t , and wait for returning echoes during listening or rest time, and then radiate the next pulse, as illustrated in figure (1). The time between the beginning of one pulse and the start of next pulse is called pulse repetition time (PRT), and is equal to inverse of pulse repetition frequency (PRF) as follows:
PRF
1
PRT
(2)The radar transmitting duty cycle
( )
d
t is defined as a ratio( )
d
tT
. The radar average transmitted power is:
P
ave
P
td
t(3)
Where (Pt) indicate to the radar peak transmitted power. The pulse energy is:
ave p t ave
r
P
E
P
P T
f
ISSN(Online): 2320-9801
ISSN (Print): 2320-9798
I
nternational
J
ournal of
I
nnovative
R
esearch in
C
omputer
and
C
ommunication
E
ngineering
(An ISO 3297: 2007 Certified Organization)
Vol. 3, Issue 7, July 2015
Fig1.- Transmitted and received pulse
IV.THEORETICAL MINIMUM DETECTION RANGE AND MAXIMUM SNREQUATION
The radar range equation is not derived from first princple, but it has been developed from several steps. The total
peak power (watts) developed by the Radar Transmitter
( )
P
t , is applied to the antenna system Consider the antenna had an isotropic or omnidirectional radiation pattern (one that radiates energy equally in directions), the power density(
P
D)
at a distance( )
R
from the radiating antenna would be the total power divided by the surface area of a sphere ofradius
( )
R
.(
P
D)
=𝑃𝑒𝑎𝑘 𝑡𝑟𝑎𝑛𝑠𝑚𝑖𝑡𝑡𝑒𝑑
power
(𝑤𝑎𝑡𝑡 )
𝑆𝑝ℎ𝑒𝑟𝑒 𝑎𝑟𝑒𝑎 (𝑚
2)
The power density at range
( )
R
away from the radar:
2
4
t D
P
P
R
(5)Where (
P
t) = The peak transmitted power
2
4
R
= The area of sphere of radius( )
R
Radar systems use a directional antenna pattern in order to concentrate the power density in a certain direction, which is usually characterized by the gain
( )
G
and the antenna effective aperture(
A
e)
they are related by:2
4
e
G
A
(6)
The antenna gain
( )
G
is directly proportional to aperture, and the dimensions of an antenna depend on the gain( )
G
and wavelength( )
.The higher the frequency, the smaller the antenna, or the higher is its gain by equal
dimensions. The relationship between the effective of antenna aperture(
A
e)
and aperture( )
A
is,A
e
A
where
0
1
ISSN(Online): 2320-9801
ISSN (Print): 2320-9798
I
nternational
J
ournal of
I
nnovative
R
esearch in
C
omputer
and
C
ommunication
E
ngineering
(An ISO 3297: 2007 Certified Organization)
Vol. 3, Issue 7, July 2015
2
4
t DPG
P
R
(7)When the incident transmitted signal collide on the target, the signal will induce time varying currents on the target so that the target now becomes a source of radio waves, part of which will propagate return at the radar, the power reflected by the target toward the radar
(
P
r)
is defined as the product of the incident power density and the Radar
cross section (RCS), which is symbolized( )
of the target, and is given by:
P
r
P
D
(8) By substituting equation (7) in equation (8), we get:2
4
t DPG
P
R
(9)When the signal reflected from the target toward the radar systems over a distance
( )
R
,
the power density (P
Dr)
return at the radar is:2
4
r DrP
P
R
(10)By substituting equation (9) in equation (10) we get:
2 4
(4 )
t DrPG
P
R
(11)
The total power received
( )
S
by antenna receiving of effective area of(
A
e)
from a target at range
( )
R
S
P
Dr
A
e (12)From equations (6, 11, 12) we get:
2 2 3 4
(4 )
tPG
S
R
(13)
The received power
( )
S
can be written in terms of signal-to-noise ratio (SNR), and thermal noise power
0
(
kT BF
)
,where
( )
k
is Boltzmann‘s constant and is equal to 231.38 10
,
( )
T
0is the noise temperature of the radar,
( )
B
is the noise bandwidth of the radar receiver and noise figure
( )
F
,Substituting in to equation (13),
we get:
min
min 0
(
)
0S
kT BF SNR
(14)
From equations (13) and (14) we get:
min
1 2 2 4 max 3
0 0
(4 )
(
)
t
PG
R
kT BF SNR
ISSN(Online): 2320-9801
ISSN (Print): 2320-9798
I
nternational
J
ournal of
I
nnovative
R
esearch in
C
omputer
and
C
ommunication
E
ngineering
(An ISO 3297: 2007 Certified Organization)
Vol. 3, Issue 7, July 2015
Or equivalently:
2 2 min 3 4
0
(4 )
tPG
SNR
kT BFR
(16)
SNR is signal to noise ratio units in decibel
(
dB
)
,when transform the units from system international of units
(
SIU
)
todB
we use the relationship:dB
10 log (
10SIU
)
And inversion, when transform from(
dB
)
to(
SIU
)
we use:
10
10 dBSIU
V. SIMULATION RESULTS
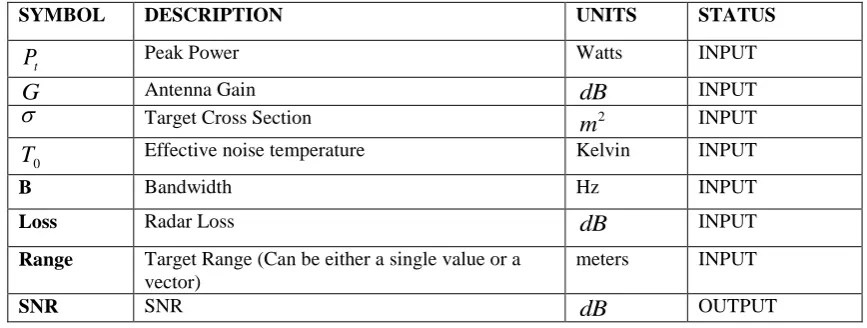
There are the various input and output parameters are required to obtaining the plot which is show in Table 1.
SYMBOL DESCRIPTION UNITS STATUS
t
P
Peak Power Watts INPUTG
Antenna GaindB
INPUT
Target Cross Section 2m
INPUT0
T
Effective noise temperature Kelvin INPUTB Bandwidth Hz INPUT
Loss Radar Loss
dB
INPUTRange Target Range (Can be either a single value or a
vector)
meters INPUT
SNR SNR
dB
OUTPUTTable 1. Various Input and Output Parameters
Here various parameters like peak power, antenna gain, target cross section, effective cross section , band width, different types of radar loss are takes as a input & SNR (Single value or a vector, depending on the input range) are the output. Figure (2) and (3) represents the equations (15 and 16), which are programmed by MATLAB simulation, observation of these plots shows the detection range versus SNR or (SNR versus detection range) for several choices like peak transmit power, antenna gain, and RCS. Can be seen that the detection range increases exponentially with SNR decreases.
ISSN(Online): 2320-9801
ISSN (Print): 2320-9798
I
nternational
J
ournal of
I
nnovative
R
esearch in
C
omputer
and
C
ommunication
E
ngineering
(An ISO 3297: 2007 Certified Organization)
Vol. 3, Issue 7, July 2015
Fig2. SNR versus Detection range for three different values of Radar peak power
Also we found that the peak power has a little effect on improving the detection range or SNR when compared with other radar parameters such as RCS and antenna gain, because the transmitted and received signal power is
proportional to the fourth power of the range while in communication systems is proportional to square power of the range, that means the radar‘s received energy drops with the fourth power of the distance. In this case, the radar needs high power often in MWatt to be effective at long range.
ISSN(Online): 2320-9801
ISSN (Print): 2320-9798
I
nternational
J
ournal of
I
nnovative
R
esearch in
C
omputer
and
C
ommunication
E
ngineering
(An ISO 3297: 2007 Certified Organization)
Vol. 3, Issue 7, July 2015
Fig4. Pulse width versus required SNR for three different detection range values
Figure (4) represents analysis of Pulse width versus required SNR for three different detection range values.
VI.CONCLUSION AND FUTURE WORK
These programs have been developed to make them so easy and faster for all users to determine the detection range and signal to noise ratio – SNR for several choices parameters as a function of the radar range equations. They used to
plot curves of detection range versus SNR for several choices parameters.
SNR
minis the minimum detectable SNR of
the system. It is an important relationship for radar designers. If greater detection range is desired, then significant improvements to antenna gain or transmitted power must be realized, and the other parameters are often fixed.REFERENCES
[1] G. Desodt, D. Muller, D. Puzenat, ―OSCAR, a simulation environment dedicated to the design and performance assessment of RADAR system, ―International Conference on Radar, Paris, 1994.
[2] Sulaiman H. M. Al Sadoon1, Badal H. Elias2 ―Radar theoretical study: minimum detection range and maximum signal to noise ratio (SNR) equation by using MATLAB simulation program‖ 2013; 2(4): 234-241 Published online July 20, 2013 doi: 10.11648/j.ajmp.20130204.20
[3] Ashagrie Getnet Flattie,‖ Performance Evaluation of MIMO Cooperative Radar by Considering High Altitude Aeronautical Platforms‖ International Conference on challenges in IT, Engineering and Technology (ICCIET‘2014) July 17-18, 2014 Phuket (Thailand).
[4] Ying Roger Lee and Asad Yousuf,‖ Radar performance analysis system: A software package of learning simulations for electronic laboratories‖ journal of applied science and enginee ring tec hnology 2007.
[5] Andreas Arnold-Bos, Student Member, IEEE, Ali Khenchaf, Associate Member, IEEE, and Arnaud Martin, Member, IEEE ―Bistatic Radar Imaging of the Marine Environment—Part II: Simulation and Results Analysis‖ IEEE TRANSACTIONS ON GEOSCIENCE AND REMOTE SENSING, VOL. 45, NO. 11, NOVEMBER 2007.
[6] Mahmod A. Al-Zubaidy, Samaa K. Al-Saffar ― Targets Signals Simulation in Radar System‖ International Journal of Emerging Science and Engineering (IJESE) ISSN: 2319–6378, Volume-2, Issue-1, November 2013‖