Estimation of olfactory sensitivity using a Bayesian
adaptive method
Richard Höchenberger1,2 and Kathrin Ohla1,2,*
1
2
3
4
5
6
7
8
9
10
11
12
13
14
1 InstituteofNeuroscienceandMedicineINM-3,ResearchCenterJülich,Jülich,Germany
2 PsychophysiologyofFoodPerception,GermanInstituteofHumanNutritionPotsdam-Rehbrücke,Nuthetal,
Germany
* Correspondence:[email protected]
Abstract:Theabilitytosmelliscrucialformostspeciesasitenablesthedetectionofenvironmental threatslikesmoke,fosterssocialinteractions, andcontributesto thesensoryevaluation offood and eatingbehavior. Thehigh prevalence of smell disturbancesthroughout the life spancalls for acontinuous effortto improvetoolsfor quick andreliableassessmentof olfactoryfunction. Odor-dispensingpens,calledSniffin’Sticks,areanestablishedmethodtodeliverolfactorystimuli duringdiagnosticevaluation.WetestedthesuitabilityofaBayesianadaptivealgorithm(QUEST)to estimateolfactorysensitivityusingSniffin’SticksbycomparingQUESTsensitivitythresholdswith thoseobtainedusingaprocedurebasedonanestablishedstandardstaircaseprotocol.Thresholds weremeasuredtwicewithbothproceduresintwosessions(TestandRetest).Overall,bothprocedures exhibitedconsiderableoverlapwithQUESTdisplayingslightlyhighertest-retestcorrelations,less variabilitybetweenmeasurements,andreducedtestingduration.Notably,participantsweremore frequentlypresentedwiththehighestconcentrationduringtheQUESTwhichmayfosteradaptation andhabituationeffects. Weconcludethatfurther researchisrequiredtobetterunderstandand optimizetheprocedureforassessmentofolfactoryperformance.
Keywords:smellsensitivity;olfaction;threshold;staircase;QUEST 15
1. Introduction 16
The appreciation of food involves all senses: sight, smell, taste, touch, and also hearing. While 17
the sight of a cup of coffee may indicate its availability, it is typically its smell that makes it appealing 18
and that triggers an appetite for most people. During consumption, the smell or aroma is perceived 19
again retronasally and supported by its pleasant temperature and a bitter taste. These largely parallel 20
sensations occur automatically and only raise awareness when one or more senses are disturbed. 21
That said, the sense of smell has been shown to influence food choice and eating behavior [1], and its 22
impairment has even been associated with a higher risk for diet-related diseases like diabetes [2]. Even 23
more, olfactory stimuli can invoke emotional states, are linked to memory storage and retrieval, and as 24
such also serve as important cues to rapid detection of potentially dangerous situations and threats 25
(see e.g. [3,4]. Given that the estimated prevalence of smell impairment is 3.5 % in the United States [5], 26
continuous efforts are made toward an efficient and precise assessment of olfactory function. 27
The Sniffin’ Sticks test suite (Burghart, Wedel, Germany; [6]), is an established tool in the 28
assessment of olfactory function. It consists of three tests involving sets of impregnated felt-tip pens: 29
odor detection threshold (T), odor discrimination (D), and odor identification (I). Each test produces a 30
number in the range from 1 to 16 as a performance measure. Overall olfactory function is assessed 31
by summing all three test results, resulting in theTDI score. Comparison of individual TDI scores 32
to the comprehensive set of available normative data (e.g. [7,8]) facilitates the interpretation of test 33
scores and allows to reliably diagnose olfactory impairment. Notably, threshold, discrimination, and 34
identification measure different facets of olfactory function [9]. The threshold, however, has been found 35
to explain a larger portion of variability in TDI scores than the two other measures [10]. Moreover, the 36
discrimination and identification tests follow relatively simple test protocols in which all stimuli are 37
presented only once and in a pre-defined order. The threshold, in comparison, is of a more complex 38
nature, and the method, therefore provides the largest potential for possible improvements. It follows 39
a so-called adaptive method, specifically, a "transformed" 1-up / 2-down staircase procedure [11]. The 40
procedure first assesses a starting concentration and then moves on to the "actual" threshold estimation, 41
during which fixed step widths are used: for each incorrect answer the stimulus concentration is 42
increased by one step, and for two consecutive correct answers the stimulus concentration is decreased 43
by one step [6]. 44
Since the 1-up / 2-down staircase was first conceived, several new approaches to threshold 45
estimation, including Bayesian methods, have been published. Bayesian methods estimate parameters 46
of the psychometric function (e.g., threshold or slope) using Bayesian inference: based on prior 47
assumptions about the true parameter value, the stimulus concentration to be presented next is 48
selected such that the expected information gain (about the parameter) is maximized. The first 49
published Bayesian adaptive psychometric method is the QUEST procedure [12], which is still popular 50
today. QUEST has two distinct properties that set it apart from the staircase described above. First, it 51
always considers the entire response history and is not solely based on the past one or two trials to 52
select the optimal stimulus concentration to be presented next. Second, QUEST is not tied to a fixed 53
step width, allowing it to traverse through a large range of concentrations more quickly. 54
In a clinical setting, at the ENT practice or at the bedside in the hospital, shorter testing times are 55
always beneficial, as they reduce strain on patients and free up time for other parts of diagnostics and 56
treatment. But also when working with healthy participants, e.g. in a psychophysical lab or in large 57
cohort studies, reduced testing time spares resources and allows for a larger number of measurements 58
in a given time. 59
QUEST has been shown to converge reliably and quickly in gustatory threshold estimations 60
[13,14]. Inspired by these results we set out to design and test a QUEST-based procedure for olfactory 61
threshold estimation and to compare its performance with that of the established staircase method. 62
2. Materials and Methods 63
2.1. Participants 64
36 participants (32 women; median age: 29.5 years, age range: 19–61 years) completed the study. 65
The influence of gender on olfactory performance has been investigated in previous studies. The 66
results typically showed no (e.g. [15], several hundred participants; [7],>3000 participants, no main 67
effect) or only rather small gender differences with negligible diagnostic and real-world relevance 68
(e.g. [8],> 9, 000 participants). We therefore did not enforce gender balance in our sample. Due 69
a technical error, the identification test data was not recorded for one participant (female, 26 years 70
old). All participants were non-smokers and reported being healthy and not having suffered from an 71
infectious rhinitis for at least two weeks before testing. The study conformed to the revised Declaration 72
of Helsinki and was approved by the ethical board of the German Society of Psychology (DGPs). 73
2.2. Stimuli 74
Stimuli were so-calledSniffin’ Sticks(Burghart, Wedel, Germany; [6]), felt-tip pens filled with 75
an odorant. The Sniffin’ Sticks test battery consists of three subtests: an odor threshold test, an odor 76
detection test, and an odor identification test. The threshold test comprises 48 pens. 16 pens are 77
filled with different concentrations of 2-phenylethanol (rose-like smell) ranging from 4 % to approx. 78
1.22 ×10⁻⁴% (a geometric sequence with the common ratio of 2, so the first pen contained a 4 % 79
dilution, the second4⁄2% = 2 %; the third2⁄2% = 1 %, and so on), dissolved in 4 % propylene glycol, an
80
odorless solvent. Note that in this test, the 1stpen contains the highest, the 16thpen the lowest odorant 81
concentration. The remaining 32 pens contain 4 % propylene glycol and serve as blanks. The pens are 82
test comprises 48 pens that are filled with 16 different odorants at supra-threshold concentrations. The 84
pens are arranged in triplets such that two pens contain the same and one pen a different odorant. The 85
identification test comprises 16 pens filled with different odorants at supra-threshold concentrations. 86
2.3. Procedure 87
2.3.1. Experimental sessions 88
Participants were invited for two experimental sessions – the Test and Retest session for the 89
odor threshold. To ensure similar testing conditions across sessions, participants were instructed to 90
refrain from eating and drinking anything but water 30 min before visiting the laboratory. Further, 91
both sessions were scheduled at approximately the same time of day, and took place with a median 92
inter-session interval of 3.0 days (SD = 2.6, range: 0.9–8.9 days); only 4 participants had an inter-session 93
interval of more than 7.0 days. In each session, olfactory detection thresholds were determined using 94
two distinct algorithms, staircase and QUEST, described below. The order of algorithms was balanced 95
across participants and kept constant for Test and Retest within each participant. Additionally, odor 96
discrimination and odor identification ability were measured at the end of one session following the 97
standardSniffin’ Sticksprotocol (Burghart, Wedel, Germany). 98
2.3.2. Stimulus presentation 99
Testing took place in a well-ventilated testing room and was performed by the same experimenter, 100
who refrained from using any fragrant products (e.g. soap, lotion, perfume, etc.) and wore odorless 101
cotton gloves when presenting the stimuli. At the beginning of each test session, participants were 102
blindfolded. To present a stimulus, the experimenter removed the cap from the pen, held the tip of 103
the pen in front of the participant’s nose, approx. 2 cm from the nostrils, and asked the participant to 104
take a sniff. For the threshold test, participants were blindfolded and informed that the odorant may 105
be presented in very low concentrations, and that only one of the three pens presented in each trial 106
contained the odorant, while the others contained the solvent exclusively. The task was to “indicate 107
which of the three pens smells different from the others”, and participants had to provide a response 108
even when unsure. Participants were familiarized with the odorant by presenting pen no. 1 (highest 109
concentration) before testing commenced. A similar procedure was used for the discrimination test, 110
participants were blindfolded and presented with a triplet of pens containing clearly perceivable 111
odorants. Each triplet consisted of two pens with the same and one pen with a different odorant. 112
Participants were to “indicate which of the three pens smells different from the others”. During 113
threshold and discrimination testing, stimulus triplets were presented during each trial, which lasted 114
approx. 30 s and included the presentation of three pens (approx. 3 s each) and a pause of 20 s. 115
These triangle tests yield a probability of1⁄3of guessing correctly. For the identification task, the
116
blindfold was removed and participants smelled one pen at a time. They were to identify the odor by 117
pointing to the matching word on a response sheet with four written response options. The interval 118
between pens was approx. 30 s. The probability of guessing correctly in this task was1⁄4.
119
Staircase 120
Following the standard protocol as detailed in the test manual; see also [16]), the order of 121
presentation within the triplets varied from trial to trial. In the first trial, the odor pen was presented 122
first, in the second trial, it was presented between two blanks, and in the third, after two blanks. After 123
the third trial, this sequence was repeated. 124
We first determined the starting concentration. Beginning with the presentation of triplet no. 16 125
or 15 (balanced across participants), participants had to indicate which of the pens smelled different. 126
Concentration was increased in steps of two (e.g., from pen 16 to 14) for each incorrect response. Once 127
incorrect, the concentration was increased again by two steps as before. However, if the triplet was 129
correctly identified a second time, that dilution step served as the starting concentration. 130
Contrary to the standard protocol, where testing would then continue without interruption, 131
our participants were granted a short break of approx. 1 min before the actual threshold estimation 132
started with the presentation of the triplet containing the starting concentration. The threshold was 133
determined in a 1-up / 2-down staircase procedure: odor concentration was increased by one step after 134
each incorrect response (1-up), and decreased by one step after two consecutive correct responses at 135
the same concentration (2-down). This kind of staircase targets a threshold of 70.71 % correct responses 136
([11]; but cf. [17], who found small deviations from this value). That is, if presented repeatedly with a 137
stimulus at threshold intensity, participants would be able to correctly identify it in about 71 out of 100 138
cases. The probability of providingtwo consecutivecorrect responses purely by guessing is1⁄3×1⁄3=1⁄9.
139
The procedure finishes after 7 reversal points were reached. The final threshold estimate is the mean of 140
the last 4 reversal concentrations. This procedure is referred to simply asstaircasethroughout the this 141
manuscript. 142
QUEST 143
QUEST requires to set parameters that describe the assumed psychometric function linking stimulus intensity and expected response behavior. We assumed a sigmoid psychometric function of the Weibull family, as proposed by [12] (albeit in a slightly different parametrization) and used for gustatory testing [13], with a slopeβ=3.5, a lower asymptoteγ=1/3(chance of a correct response
just by guessing), and a parameterλ=0.01 to account for lapses (response errors due to momentary
fluctuation of attention):
Ψ(x) =λγ+ (1−λ)[1−(1−γ)exp(−10β(x+T))]
Here, the presented concentration is denoted asx, and the assumed threshold asT. This yielded a 144
function extending from 0.33 to 0.99 in units of "proportion of correct responses". The granularity of 145
the concentration grid was set to 0.01. All parameters of this function were constant, except for the 146
threshold, which was the parameter of interest that was going to be estimated in the course of the 147
procedure. The prior estimate of the threshold was a normal distribution with a standard deviation of 148
20, which was centered on the concentration of pen no. 7, which was used as the starting concentration. 149
The algorithm was set to target the threshold at 80 % correct responses, which is slightly higher than 150
the threshold target in the staircase procedure, but had proven to produce good results both in pilot 151
testing as well as in gustatory threshold estimation [13,14]. Unlike in the staircase procedure, where 152
the order of pen presentation varied systematically from triplet to triplet, triplets were presented in 153
random order during the QUEST procedure. 154
Notably, QUEST updates its knowledge on the expected threshold after each response and 155
proposes the concentration to present in the next trial such that it maximizes the expected information 156
gain about the “true” threshold. As the set of concentrations was discrete and limited to 16, QUEST 157
might propose concentrations other than those contained in the test set. In this case, the software 158
selects the triplet with the concentration closest to the one proposed. In contrast to the staircase, where 159
the concentration was always decreased or increased by a single step after the starting concentration 160
had been determined, the step width was not fixed in QUEST. For example, QUEST might step up 3 161
concentrations in one trial, step down 2 in the next, and present the exact same concentration again in 162
the following trial. Whenever the same concentration had been presented on two consecutive trials, 163
the concentration for the next trial was decreased if both responses were correct, and increased if both 164
responses were incorrect. QUEST might suggest to present concentrations outside of the range of 165
available dilution steps. Therefore we set up the algorithm such that, whenever the presentation of 166
a pen<1 or>16 was suggested, we would instead present pen no. 1 and 16, respectively. QUEST 167
into the threshold estimate. Note, however, that final threshold estimates outside the concentration 169
range could still occur occasionally, and needed to be dealt with accordingly; see theData cleaning 170
paragraph in the next section for details. 171
The procedure ended after 20 trials. The final threshold estimate is the mean of the posterior 172
probability density function of the threshold parameter. We will refer to this procedure as "QUEST". 173
2.3.3. Analysis 174
Odor discrimination and identification 175
The discrimination and identification tests comprise 16 trials. For each test, the number of correct 176
responses are summed up, resulting in a test score which can range from 0 to 16. Together with the 177
staircase threshold, which yields values from 1 to 16, the sum of all three test results forms a cumulative 178
score: the TDI score. 179
Data cleaning 180
When a participant reaches one of the most extreme concentrations (i.e., pens no. 1 or 16) and 181
provides a response that would, theoretically, require to present a concentration outside the stimulus of 182
set, the staircase procedure cannot be safely assumed to yield a reliable threshold estimate anymore. For 183
example, if a participant fails to identify the highest concentration (pen no. 1), the staircase procedure 184
would then demand to present a hypothetical pen no. 0, which obviously does not exist. Since our 185
sole termination criterion was "7 reversals", we would repeatedly present pen no. 1 until a correct 186
identification allows the procedure to move up to pen no. 2 again. The resulting threshold estimate 187
would systematically overestimate the participant’s sensitivity. Therefore we set the threshold values 188
of staircase runs where participants could not identify pen no. 1 at least once toT=1 after the run 189
was completed, following [7] (but cf. [16], who suggest to set the value toT=0 instead). This was the 190
case in 5 out of the 72 staircase threshold measurements (2 during Test, 3 during Retest; 5 participants 191
affected). Conversely, when a participant were to correctly identify the lowest concentration (pen no. 192
16), the staircase procedure would require the presentation of a hypothetical pen no. 17, in which case 193
we would have assigned a threshold value ofT = 16; however, this situation did not occur in the 194
present study after the starting concentration had been determined. 195
For QUEST, pen no. 1 was not correctly identified at least once in 12 of the 72 measurements, 196
concerning 11 participants; no participant reached and correctly identified pen no. 16. QUEST yielded 197
final threshold estimatesT<1 in 11 measurements (8 during Test, 3 during Retest; 10 participants 198
affected). Similarly to the data cleaning procedure for the staircase, we assigned thresholdT=1 in 199
these cases. Notably, this again concerned 3 of the 5 participants for whom we had assignedT=1 in a 200
staircase experiment. 201
Test-Restest Reliability 202
To establish test-retest reliability, we first compared the means of Test and Retest thresholds 203
for each procedure. Q-Q plots and Shapiro-Wilk tests revealed that thresholds were not normally 204
distributed for the QUEST Test session (W = 0.90, p < 0.01); we, therefore, compared the means 205
using non-parametric Wilcoxon signed-rank tests. We then correlated Test and Retest threshold 206
estimates via Spearman’s rank correlation (Spearman’s rho, denoted asρ) to estimate the degree of 207
monotonic relationship between measurements. Ordinary least squares (OLS) models were used to 208
fit regression lines to provide a better understanding of the nature of the relationship between the 209
threshold estimates (i.e., whether Test thresholds could predict Retest thresholds). Q-Q plots and 210
Shapiro-Wilk tests showed that the regression residuals were normally distributed (allp>0.05) and 211
thus satisfied an important requirement for OLS regression. 212
Although correlation and regression analyses are widely used to assess test-retest reliability and 213
[18–20]). Instead, analyses that focus on thedifferencesbetween, not agreement of, measurements 215
should be preferred. [18] proposed to calculate the mean difference ¯dand standard deviation of the 216
differences between two measurements to derivelimits of agreementat ¯d±1.96×SD. These limits 217
correspond to the 95 % confidence interval. This means that in 95 out of 100 comparisons, the difference 218
between two measurements can be expected to fall into this range. Narrower limits of agreement 219
indicate a better agreement between two measurements. The relatedrepeatability coefficient, RC, is 220
simply 1.96×SD, and its interpretation is very similar to the limits of agreement: only 5 % of absolute 221
measurement differences will exceed this value, and a smaller RC indicates better agreement.1 222
If the differences between two measurements are plotted over the mean of the measurements, and 223
¯
dand the limits of agreement are added as horizontal lines, the resulting plot is called aBland-Altman 224
plot(sometimes also referred to asTukey mean difference plot). It can be used to quickly visually inspect 225
how well measurements can be reproduced, specifically which systematic bias ( ¯d 6= 0) and which 226
variability or "spread" of measurement differences to expect. Accordingly, we assessed the RC, limits 227
of agreement, and produced Bland-Altman plots for both methods, staircase and QUEST, to gain 228
more insight into the repeatability (or lack thereof) of measurements for each method. The use of 229
these analyses requires the measurement differences to be normally distributed, which we confirmed 230
using Q-Q plots, and Shapiro-Wilk tests failed to reject the null hypothesis of normal distributions (all 231
p>0.05). Confidence intervals for the limits of agreement were calculated using the "exact paired" 232
method described by [21]. 233
Lastly, to test whether the duration of the inter-session interval might be a confounding factor in 234
the threshold estimates, we also calculated the Spearman correlation between inter-session intervals 235
and differences between Test and Retest thresholds. 236
Comparison between procedures 237
To compare the threshold estimates across procedures, we averaged Test and Retest threshold 238
estimates for each participant within a procedure, and, similar to the analysis of reliability, compared 239
the means with a Wilcoxon signed-rank test, followed by the calculation of Spearman’sρand the fit of 240
a regression line using an OLS model. The regression residuals were normally distributed, according 241
to a Q-Q plot and a Shapiro-Wilk test (W =0.96,p =0.26), satisfying the normality assumption of 242
errors on which OLS regression crtitically relies. 243
Additionally, we estimated the 95 % limits of agreement from the differences between the 244
within-participant session means for the two procedures, and generated Bland-Altman plots. The 245
measurement differences were normally distributed, according to a Q-Q plot and a Shapiro-Wilk test 246
(W=0.96,p=0.30). Like in the investigation of test-retest reliability, we assessed confidence intervals 247
of the limits of agreement via the "exact paired" method described by [21]. 248
Because the limits of agreement derived from session means might actually be too narrow, 249
as within-participant variability is removed by averaging measurements across sessions [20], we 250
calculated adjusted limits of agreement from the variance of the between-subject differences,σd2, which 251
in turn can be calculated asσd2 = s2d¯+0.5s2xw+0.5s2yw. Here,s2d¯is the variance of the differences 252
between the session means; ands2xwands2yware the within-participant variances of methodsxand
253
y, respectively (staircase and QUEST in our case). The limits of agreement can then be calculated as 254
¯
d±1.96×σd, with ¯dbeing the mean difference between the session means of both procedures. Again,
255
the interpretation of these limits is straightforward: 95 % of the differences between staircase and 256
QUEST measurements can be expected to fall into this interval, and narrower limits indicate a better 257
1 It should be noted that [20] suggested an alternative method for calculating the repeatability coefficient, based on the
within-participant standard deviation,sw. The results we obtained from these calculations were similar to those based on
the standard deviation of the measurement differences. Because the latter are directly visualized in the Bland-Altman plot
agreement across the measurement results produced by both procedures. Finally, we derived 95 % 258
confidence intervals for these limits, as suggested in [20] (section 5.1, equation 5.10). 259
Software 260
The experiments were run via PsychoPy 1.85.4 [22,23] running on Python 2.7.14 (https://www. 261
python.org) installed via the Miniconda distribution (https://conda.io/miniconda.html) on Windows 262
7 (Microsoft Corp., Redmond, WA/USA). All analyses were carried out with Python 3.7.1, running on 263
macOS 10.14.2 (Apple Inc., Cupertino, CA/USA). We used the following Python packages: correlation 264
coefficients, Bland-Altman and Q-Q plots were derived via pingouin 0.2.2 [24]; confidence intervals 265
for the Bland-Altman plots were calculated with pyCompare 1.2.3 (https://github.com/jaketmp/ 266
pyCompare); Shapiro-Wilk statistics were calculated with SciPy 1.2.1 [25,26]; linear regression models 267
were estimated using statsmodels 0.9.0 [27]; and box plots and correlation plots were created with 268
seaborn 0.9.0 (https://seaborn.pydata.org) and matplotlib 3.0.2 [28]. 269
3. Results 270
3.1. Odor discrimination and identification 271
The average test score for odor discrimination was 13.3 (SD = 1.5, range: 11–16;N =35), and 272
for odor identification 13.0 (SD = 1.6, range: 11–16;N=36). When accumulated with the staircase 273
threshold estimates from the Test and Retest sessions, we observed TDI scores of 33.34 (SD = 3.8; range: 274
26.5–43) and 33.64 (SD = 3.8; range: 26.75–41.75), respectively. Individual as well as cumulative scores 275
indicate a below average ability to smell (roughly around the 25thpercentile) in our sample compared 276
to recent normative data from over 9,000 subjects [8]. 277
3.2. Starting concentrations 278
The average starting concentration was pen no. 9.9 (SD = 4.2, range: 1–16) for the Test and 279
9.6 (SD = 4.1, range: 1–16) for the Retest session of the staircase. The average difference in starting 280
concentrations between sessions was 4.9 (SD = 4.0, range: 0–15). In comparison, we used a slightly 281
higher, fixed starting concentration of pen no. 7 for QUEST. 282
3.3. Test duration 283
The average number of trials needed to complete the staircase measurements was 23.6 (SD = 4.8, 284
range: 13–41), which translates to approx. 11.5 min and which is 2 minutes longer than for QUEST, 285
which per our parameters always lasted 9.5 minutes (20 trials). Test duration varied slightly between 286
staircase sessions and was 24.4 trials (SD = 4.2, range: 16–34) for the Test and 22.9 trials (SD = 5.4, range: 287
13–41) for the Retest session. Please note that the number of trials and the testing duration for the 288
staircase are based on the time required to reach seven reversal pointsafterthe starting concentration 289
had been determined, thereby deviating from the "standard" procedure, which treats the starting 290
3.4. Test-Retest Reliability 292
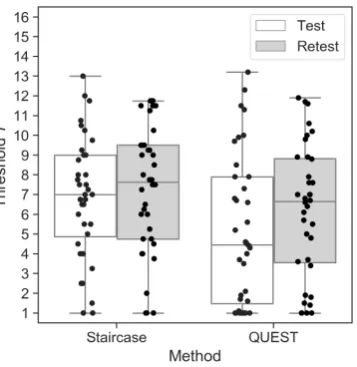
Figure 1.Threshold estimates for the staircase and QUEST procedures during Test and Retest sessions.
Each dot represents one participant. Horizontal lines show the median values, and whisker lengths represent 1.5×inter-quartile range.
The mean Test thresholds did not differ from the mean Retest thresholds for the staircase (MTest= 293
6.9, SDTest=3.1;MRetest=7.2, SDRetest=3.2;W =268.0,p=0.19). For QUEST, on the other hand, 294
mean Test and Retest thresholds differed significantly, with slightly higher sensitivity (higherTunit) 295
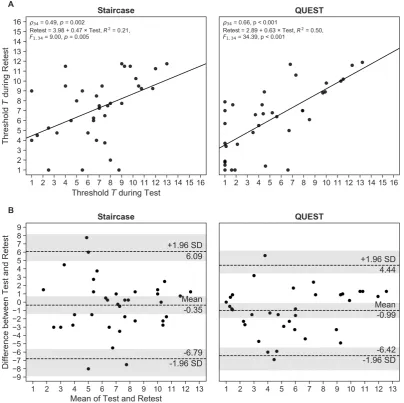
Figure 2. (A) Correlation between Test and Retest threshold estimates for the staircase and QUEST procedures. (B) Bland-Altman plots showing mean differences between Test and Retest and limits of agreement corresponding to 95 % confidence intervals (CIs) as mean±1.96×SD. The shaded areas represent the 95 % CIs of the mean and the limits of agreement. Each dot represents one participant.
The Test and Retest thresholds correlated significantly for both procedures, with QUEST 297
demonstrating a stronger relationship between measurements than the staircase (staircase:ρ34=0.49, 298
p<0.01; QUEST:ρ34=0.66,p<0.001; Fig.2A). 299
As already pointed out, correlation gives an indication of the strength of themonotonic relationship 300
between values, but only provides limited information on theiragreement. We therefore calculated 301
the repeatability coefficient RC and created Bland-Altman plots to generate a better understanding of 302
the measurement differences. The prediction of the RC is that two measurements (Test and Retest) 303
will differ by the value of RC or less for 95 % of participants. We found that RC was about 16 % 304
smaller for QUEST than for the staircase (RCStaircase =6.44, RCQUEST=5.43), suggesting a slightly 305
better agreement between Test and Retest measurements for the QUEST procedure. Accordingly, 306
the Bland-Altman plot (Fig2B) showed narrower limits of agreement for QUEST (staircase: −6.79 307
[−8.89,−5.63] and 6.09 [4.93, 8.18]; QUEST: −6.42[−8.18,−5.44] and 4.44[3.46, 6.29]; 95 % CIs in 308
brackets). The mean of the differences between measurements was relatively small and deviated less 309
M∆T,QUEST = −0.99[−1.89,−0.08]). This systematic negative shift indicates that participants, on 311
average, reached higherT units in the second session than in the first. The differences between 312
Test and Retest measurements for 3 (staircase) and 2 participants (QUEST), respectively, fell outside 313
their respective limits of agreement, which corresponds to the expected proportion of 5 % of outliers 314
(3/36=8.3 %;2/36=5.6 %), demonstrating the appropriateness of the estimated limits. Considering 315
the confidence intervals of the limits of agreement, an equal number of measurement differences (4) 316
fell outside the predicted range for both procedures. 317
To test whether the time between Test and Retest sessions might be linked to the observed 318
differences between Test and Retest threshold estimates, we computed correlations between those 319
measures. We found no relationship for either method (staircase: ρ34 = −0.12, p = 0.50; QUEST: 320
ρ34=0.03,p=0.85). 321
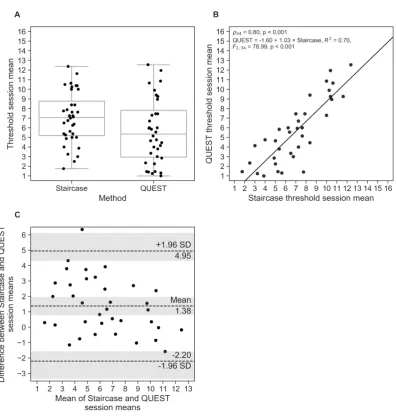
3.5. Comparison between procedures 322
Although the threshold estimates, averaged across sessions, for the staircase were significantly 323
higher than those for QUEST (staircase: M=7.0, SD=2.7; QUEST:M=5.7, SD=3.3;W =101.0, 324
p < 0.001; Fig.3A), we found a strong correlation between the procedures (ρ34 = 0.80,p < 0.001; 325
Fig.3B). The regression slope was close to 1, providing an indication of agreement across procedures. 326
The Bland-Altman plot based on the session means (Fig.3C) shows a systematic difference between 327
both procedures; specifically, QUEST thresholds were, on average, 1.38[0.78, 1.97]Tunits smaller 328
than the staircase estimates (95 % CIs in brackets). The limits of agreement reached from−2.20 329
[−3.37,−1.56]to 4.95[4.31, 6.12], meaning the difference between the two methods will fall into this 330
range for 95 % of measurements. Only for 1 participant the observed differences between staircase 331
and QUEST fell outside the limits of agreement (1/36=2.8 %; when considering the CIs of the limits, 3 332
participants fell outside the expected range (3/36=8.3 %) 333
The corrected limits of agreement, taking into account individual measurements (as opposed to 334
session means only), were−4.20[−23.6, 15.3]and 6.96[−12.5, 26.4], which is substantially larger than 335
the uncorrected limits. The large confidence intervals that expand even beyond the concentration range 336
Figure 3. (A) Mean threshold estimates, averaged across Test and Retest sessions for the staircase and QUEST procedures. Horizontal lines show the median values and Whisker lengths represent 1.5×inter-quartile range. (B) Correlation between mean staircase and QUEST threshold estimates. (C) Bland-Altman plot showing mean differences between session means in both procedures, and limits of agreement corresponding to 95 % confidence intervals (CIs) as mean±1.96×SD. The shaded areas represent the 95 % CIs of the mean and the limits of agreement. Each dot represents one participant.
4. Discussion 338
In the presented study we used a QUEST-based algorithm to estimate olfactory detection 339
thresholds for 2-phenylethanol with the aim to provide a reliable test result as it had recently been 340
demonstrated for taste thresholds [13] with reduced testing time. The results were compared to a 341
slightly modified version of the widely-used testing protocol based on a 1-up / 2-down staircase 342
procedure [6,7,9,15,16]. 343
Test-retest reliability was assessed using multiple approaches. Comparison of Test and Retest 344
thresholds revealed a small yet significant mean difference for QUEST: threshold estimates during 345
Retest were higher than in the Test, indicating an increase in participants’ sensitivity. [6] reported 346
a similar effect. However, with a mean difference of approx. 1 T unit or pen number, the 347
practical relevance of this effect is debatable, even more so when considering the large variability of 348
Following common practice of establishing test-retest reliability of olfactory thresholds (see e.g. 350
[6,9,29]), we calculated correlations between Test and Retest sessions. The correlation coefficient for 351
QUEST (ρ=0.66) indicated solid, but not exceptionally great test-retest reliability. Reliability of the 352
staircase procedure was only moderate (ρ =0.49) and lower than reported in previous studies for 353
n-butanol (r=0.61; [6]) and 2-phenylethanol (r=0.92; [9]) thresholds. 354
To acknowledge previous criticism of correlation analysis which focuses on the agreement but not 355
the differences between measurements, [18–20] we calculated repeatability coefficients and generated 356
Bland-Altman plots for the analysis of session differences. Repeatability was higher for QUEST than for 357
the staircase; however, measurement results of both procedures varied considerably across sessions for 358
many participants. This inter-session variability is further substantiated by the differences in starting 359
concentrations assessed for the staircase, which varied up 15 pen numbers in the most extreme case. 360
The effect was not universal: some participants performed better in the Test than in the Retest session, 361
whereas for others performance dropped across sessions, and remained almost unchanged in others. 362
Since both sessions had been scheduled within a relatively short time period and all measurements 363
have been performed by the same experimenter, measurement variability can be mostly attributed to 364
variability within participants themselves. 365
The comparison of the staircase and QUEST procedures via the session means of each participant 366
showed that the staircase yielded slightly higher pen numbers (i.e., lower thresholds) than QUEST. This 367
was expected as the procedures were assumed to converge at approx. 71 % and 80 % correct responses, 368
respectively. We found a strong correlation between the session means of the procedures (ρ=0.80), 369
and regression analysis showed an almost perfect linear relationship, which some would interpret as 370
a good agreement between QUEST and staircase results. The 95 % limits of agreement, taking into 371
account the within-participant variability, showed a large expected deviation between both procedures 372
(range: QUEST thresholds almost 7T units smaller or more than 4T units greater than staircase 373
results), with the corresponding CIs of those boundaries even exceeding the concentration range. This 374
result is indicative of the large variability we found within participants in both procedure. The limits 375
of agreement based on the within-participant session means were much narrower, as variability is 376
greatly reduced through averaging. 377
A potential source of variability might beguessing. In fact, the probability of responding correctly 378
merely by guessing is1⁄3. [30] showed in a series of simulations that, with increasing number of trials,
379
the frequency of correct guesses might get unacceptably high, potentially leading increased variability 380
in the threshold estimates. Running determined that, for a staircase procedure like the one in our 381
study, the expected proportion of such false-positive responses exceeds 5 % with the 23rd trial. For 382
our staircase experiments, the average number of trials was 23.6; and the procedure finished after 23 383
or more trials for 24 of the 36 participants in the Test, and for 20 participants in the Retest session. 384
Therefore, the large variability between Test and Retest threshold estimates in the staircase could, 385
at least partially, be ascribed to correct guesses "contaminating" the procedure. However, QUEST – 386
which always finished after 20 trials – only had slightly better test-retest reliability according the the 387
repeatability coefficient, suggesting that the largest portion of test-retest variability in our investigations 388
was probably not caused by (too) long trial sequences and related false-positive responses alone. 389
Surprisingly, a number of participants were unable to correctly identify pen no. 1 at least on one 390
occasion, and this effect was more pronounced during QUEST compared to the staircase. It seems 391
plausible that the variable step size used by QUEST made it possible to approach even the extreme 392
concentration ranges quickly, whereas the staircase requires a longer sequence of incorrect responses 393
to reach pen no. 1. 394
Despite careful selection of healthy participants who reported no smell impairment, olfactory 395
performance was lower than recently reported in a sample comprising over 9,000 participants [8]. 396
This coincidental finding highlights the need for a comprehensive smell screening before enrollment. 397
To what extend olfactory function contributed to the present results and limits their generalizability 398
All QUEST runs completed after 20 trials for all participants. The procedure could be further 400
optimized by introducing a dynamic stopping rule. For example, [13] set the algorithm to terminate 401
once the threshold estimate had reached a certain degree of confidence. Such a rule can reduce 402
testing time, as the run may finish in fewer than 20 trials, and should be considered in future studies. 403
Although the reduction or omission of a minimum trial number bears potential to reduce the testing 404
time further, it needs to be shown first that the algorithm performs well under these conditions 405
and, most importantly, large-scale studies need to show whether such a reduced or faster protocol is 406
appropriate to assess odor sensitivity in participants with odor abilities at the extremes (particularly 407
insensitive/sensitive). 408
Inspection of the data showed that some staircase runs had not fully converged although 7 409
reversal points were reached. In these cases, participants exhibited a somewhat "fluctuating" response 410
behavior (or threshold) that caused the procedure to move in the direction of higher concentrations 411
throughout the experiment (see FigureA1in the appendix and supplementary data for an example). 412
QUEST proved to behave more consistently, at least in some cases, by either converging to a threshold 413
or by reaching pen no. 1, which would then sometimes not be identified correctly. These interesting 414
differences between methods require further investigation to fully understand their cause and influence 415
on threshold estimates and, ultimately, diagnostics. 416
5. Conclusions 417
The present study compared the reliability of olfactory threshold estimates using two different 418
algorithms: a 1-up / 2-down staircase and a QUEST-based procedure. The measurement results of both 419
procedures showed considerable overlap. QUEST thresholds were more stable across sessions than the 420
staircase, as indicated by a smaller variability of test-retest differences and a higher correlation between 421
session estimates. QUEST offered a slightly reduced testing time, which may be further minimized 422
through a variable stopping criterion. Yet, QUEST also tended to present the highest concentration, 423
pen no. 1, more quickly than the staircase, which may induce more rapid adaptation and habituation 424
during the procedure and, eventually, produce biased results. Further research is needed to better 425
understand possible advantages and drawbacks of the QUEST procedure compared to the staircase 426
testing protocol. 427
6. Data and software availability 428
The data analyzed in this paper along with graphical representations of each individual threshold 429
run are available fromhttps://doi.org/10.5281/zenodo.2548620. The authors provide a hosted service 430
for running the presented experiments online athttps://sensory-testing.org; the sources of this online 431
implementation can be retrieved fromhttps://github.com/hoechenberger/webtaste. 432
Author Contributions: conceptualization, R.H. and K.O.; programming, analysis, and visualization, R.H.;
433
interpretation and writing, R.H. and K.O.; supervision and project administration, K.O. 434
Funding:The implementation of the online interface was supported by Wikimedia Deutschland, Stifterverband,
435
and Volkswagen Foundation through an Open Science Fellowship granted to R.H. 436
Acknowledgments:The authors would like to thank Andrea Katschak for data collection.
437
Conflicts of Interest:The authors declare no conflict of interest. The funding agents had no role in the design of
438
the study; in the collection, analyses, or interpretation of data; in the writing of the manuscript, or in the decision 439
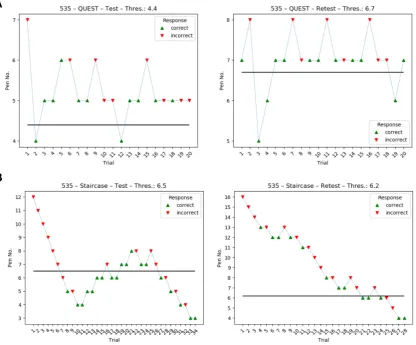
Appendix 441
Example threshold runs of the same participant: while the QUEST runsdidconverge, the staircase 442
runs obviously did not fully converge although 7 reversal points were reached. Intriguingly, the 443
staircase provided more consistent results (more similar thresholds across runs) than QUEST. We 444
speculate that this participant exhibited a fluctuating response behavior during the staircase procedure. 445
Figure A1.Comparison of threshold estimation runs of the same participant during Test and Retest
References 446
447
1. Boesveldt, S.; Bobowski, N.; McCrickerd, K.; Maître, I.; Sulmont-Rossé, C.; Forde, C.G. The changing role 448
of the senses in food choice and food intake across the lifespan. Food Quality and Preference2018,68, 80–89. 449
doi:10.1016/j.foodqual.2018.02.004. 450
2. Rasmussen, V.F.; Vestergaard, E.T.; Hejlesen, O.; Andersson, C.U.N.; Cichosz, S.L. Prevalence of 451
taste and smell impairment in adults with diabetes: A cross-sectional analysis of data from the 452
National Health and Nutrition Examination Survey (NHANES).Primary Care Diabetes2018,12, 453–459. 453
doi:10.1016/j.pcd.2018.05.006. 454
3. Sullivan, R.M.; Wilson, D.A.; Ravel, N.; Mouly, A.M. Olfactory memory networks: from emotional learning 455
to social behaviors.Frontiers in Behavioral Neuroscience2015,9. doi:10.3389/fnbeh.2015.00036. 456
4. Li, W. Learning to smell danger: acquired associative representation of threat in the olfactory cortex. 457
Frontiers in Behavioral Neuroscience2014,8. doi:10.3389/fnbeh.2014.00098. 458
5. Liu, G.; Zong, G.; Doty, R.L.; Sun, Q. Prevalence and risk factors of taste and smell impairment in a 459
nationwide representative sample of the US population: a cross-sectional study.BMJ Open2016,6, e013246. 460
doi:10.1136/bmjopen-2016-013246. 461
6. Hummel, T.; Sekinger, B.; Wolf, S.; Pauli, E.; Kobal, G. ‘Sniffin’ Sticks': Olfactory Performance Assessed by 462
the Combined Testing of Odour Identification, Odor Discrimination and Olfactory Threshold. Chemical 463
Senses1997,22, 39–52. doi:10.1093/chemse/22.1.39. 464
7. Hummel, T.; Kobal, G.; Gudziol, H.; Mackay-Sim, A. Normative data for the “Sniffin’ Sticks” including 465
tests of odor identification, odor discrimination, and olfactory thresholds: an upgrade based on a 466
group of more than 3,000 subjects. European Archives of Oto-Rhino-Laryngology 2007, 264, 237–243. 467
doi:10.1007/s00405-006-0173-0. 468
8. Oleszkiewicz, A.; Schriever, V.A.; Croy, I.; Hähner, A.; Hummel, T. Updated Sniffin’ Sticks normative 469
data based on an extended sample of 9139 subjects. European Archives of Oto-Rhino-Laryngology2019, 470
276, 719–728. doi:10.1007/s00405-018-5248-1. 471
9. Haehner, A.; Mayer, A.M.; Landis, B.N.; Pournaras, I.; Lill, K.; Gudziol, V.; Hummel, T. High Test-Retest 472
Reliability of the Extended Version of the "Sniffin’ Sticks" Test. Chemical Senses 2009, 34, 705–711. 473
doi:10.1093/chemse/bjp057. 474
10. Lötsch, J.; Reichmann, H.; Hummel, T. Different Odor Tests Contribute Differently to the Evaluation of 475
Olfactory Loss. Chemical Senses2008,33, 17–21. doi:10.1093/chemse/bjm058. 476
11. Wetherill, G.B.; Levitt, H. Sequential Estimation of Points on a Psychometric Function.British Journal of 477
Mathematical and Statistical Psychology1965,18, 1–10. doi:10.1111/j.2044-8317.1965.tb00689.x. 478
12. Watson, A.B.; Pelli, D.G. Quest: A Bayesian adaptive psychometric method. Perception & Psychophysics 479
1983,33, 113–120. doi:10.3758/bf03202828.
480
13. Höchenberger, R.; Ohla, K. Rapid Estimation of Gustatory Sensitivity Thresholds with SIAM and QUEST. 481
Frontiers in Psychology2017,8. doi:10.3389/fpsyg.2017.00981. 482
14. Hardikar, S.; Höchenberger, R.; Villringer, A.; Ohla, K. Higher sensitivity to sweet and salty taste in obese 483
compared to lean individuals. Appetite2017,111, 158–165. doi:10.1016/j.appet.2016.12.017. 484
15. Kobal, G.; Klimek, L.; Wolfensberger, M.; Gudziol, H.; Temmel, A.; Owen, C.M.; Seeber, H.; Pauli, E.; 485
Hummel, T. Multicenter investigation of 1,036 subjects using a standardized method for the assessment of 486
olfactory function combining tests of odor identification, odor discrimination, and olfactory thresholds. 487
European Archives of Oto-Rhino-Laryngology2000,257, 205–211. doi:10.1007/s004050050223. 488
16. Rumeau, C.; Nguyen, D.T.; Jankowski, R. How to assess olfactory performance with the Sniffin’ 489
Sticks test ®. European Annals of Otorhinolaryngology, Head and Neck Diseases 2016, 133, 203–206. 490
doi:10.1016/j.anorl.2015.08.004. 491
17. García-Pérez, M.A. Forced-choice staircases with fixed step sizes: asymptotic and small-sample properties. 492
Vision Research1998,38, 1861–1881. doi:10.1016/s0042-6989(97)00340-4. 493
18. Altman, D.G.; Bland, J.M. Measurement in Medicine: The Analysis of Method Comparison Studies. The 494
19. Bland, J.M.; Altman, D. Statistical methods for assessing agreement between two methods of clinical 496
measurement. The Lancet1986,327, 307–310. doi:10.1016/s0140-6736(86)90837-8. 497
20. Bland, J.M.; Altman, D.G. Measuring agreement in method comparison studies. Statistical Methods in 498
Medical Research1999,8, 135–160. doi:10.1191/096228099673819272. 499
21. Carkeet, A. Exact Parametric Confidence Intervals for Bland-Altman Limits of Agreement. Optometry and 500
Vision Science2015,92, e71–e80. doi:10.1097/opx.0000000000000513. 501
22. Peirce, J.W. PsychoPy—Psychophysics software in Python. Journal of Neuroscience Methods2007,162, 8–13. 502
doi:10.1016/j.jneumeth.2006.11.017. 503
23. Peirce, J.W. Generating stimuli for neuroscience using PsychoPy. Frontiers in Neuroinformatics2008,2. 504
doi:10.3389/neuro.11.010.2008. 505
24. Vallat, R. Pingouin: statistics in Python. Journal of Open Source Software 2018, 3, 1026. 506
doi:10.21105/joss.01026. 507
25. Oliphant, T.E. Python for Scientific Computing. Computing in Science & Engineering2007,9, 10–20. 508
doi:10.1109/mcse.2007.58. 509
26. Millman, K.J.; Aivazis, M. Python for Scientists and Engineers.Computing in Science & Engineering2011, 510
13, 9–12. doi:10.1109/mcse.2011.36. 511
27. Seabold, S.; Perktold, J. Statsmodels: Econometric and statistical modeling with Python. Proceedings of 512
the 9th Python in Science Conference. SciPy society Austin, 2010, Vol. 57, p. 61. 513
28. Hunter, J.D. Matplotlib: A 2D Graphics Environment.Computing in Science & Engineering2007,9, 90–95. 514
doi:10.1109/mcse.2007.55. 515
29. Croy, I.; Lange, K.; Krone, F.; Negoias, S.; Seo, H.S.; Hummel, T. Comparison between Odor Thresholds for 516
Phenyl Ethyl Alcohol and Butanol. Chemical Senses2009,34, 523–527. doi:10.1093/chemse/bjp029. 517
30. Running, C.A. High false positive rates in common sensory threshold tests. Attention, Perception, & 518