Initial state radiation experiment at MAMI
M. Mihoviloviˇc1,a, H. Merkel1, A. Weber1, P. Achenbach1, C. Ayerbe Gayoso1, T. Beranek1, J. Beriˇciˇc4,
J. C. Bernauer1, D. Bosnar2, R. Böhm1, L. Correa3, L. Debenjak1, A. Denig1, M. O. Distler1, A. Esser1, H. Fonvieille3,
I. Frišˇci´c2, M. Gómez1, S. Kegel1, Y. Kohl1, D. G. Middleton1, U. Müller1, L. Nungesser1, J. Pochodzalla1,
M. Rohrbeck1, S. Sánchez Majos1, B. S. Schlimme1, M. Schoth1, F. Schulz1, C. Sfienti1, S. Širca5,4, S. Štajner4,
M. Thiel1, M. Weinriefer1
(A1-Collaboration)
1Institut für Kernphysik, Johannes Gutenberg-Universität Mainz, DE-55128 Mainz, Germany
2Department of Physics, University of Zagreb, HR-10002 Zagreb, Croatia
3Clermont Université, CNRS/IN2P3, LPC, BP 10448, F-63000 Clermont-Ferrand, France
4Jožef Stefan Institute, SI-1000 Ljubljana, Slovenia
5Department of Physics, University of Ljubljana, SI-1000 Ljubljana, Slovenia
Abstract.In an attempt to contribute further insight into the discrepancy between the Lamb shift and elastic scattering determinations of the proton charge radius, a new experiment at MAMI is underway, aimed at mea-suring proton form-factors at very low momentum transfers by using a new technique based on initial state radiation. This paper reports on the conclusions of the pilot measurement performed in 2010, whose main goal was to check the feasibility of the proposed experiment and to recognize and overcome any obstacles before running the full experiment. The modifications to the experimental apparatus are then explained which signif-icantly improved the quality of data collected in the full scale experiment, which was successfully executed in August 2013. At the end first findings of the new experiment are discussed.
1 Introduction
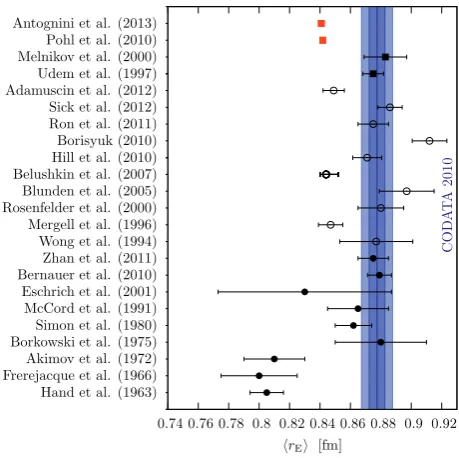
The proton has been scrutinized since the early days of experimental hadronic physics [1]. Its radius has been de-termined by various electron scattering experiments and many atomic Lamb shift measurements (see Figure 1). Both approaches gave consistent results. Unfortunately their average does not agree with the findings of re-cent very precise Lamb shift measurements in muonic-hydrogen [2, 3], which report a new value for the proton charge radius which is 7σaway from the previously ac-cepted value. This discrepancy, known as the proton radius puzzle, is controversial and demands further investigation. An ongoing electron scattering experiment at MAMI aims to offer new insight into this matter.
In a typical scattering experiment the radius of a proton is determined indirectly by measuring the cross-section for elastic scattering of electrons on hydrogen [5]. The mea-sured cross-section depends on the electric and magnetic form-factorsGpE andGMp, which carry information about the charge and magnetization distribution in the proton and are extracted from the measured data via Rosenbluth sep-aration. The charge radius is extracted from the slope of the electric form-factor atQ2=0:
rE2=−62 d dQ2GE(Q
2) Q2=0 , ae-mail: [email protected]
C
OD
A
T
A
2010
rE [fm]
0.92 0.9 0.88 0.86 0.84 0.82 0.8 0.78 0.76 0.74 Antognini et al. (2013)
Pohl et al. (2010) Melnikov et al. (2000) Udem et al. (1997) Adamuscin et al. (2012) Sick et al. (2012) Ron et al. (2011) Borisyuk (2010) Hill et al. (2010) Belushkin et al. (2007) Blunden et al. (2005) Rosenfelder et al. (2000) Mergell et al. (1996) Wong et al. (1994) Zhan et al. (2011) Bernauer et al. (2010) Eschrich et al. (2001) McCord et al. (1991) Simon et al. (1980) Borkowski et al. (1975) Akimov et al. (1972) Frerejacque et al. (1966) Hand et al. (1963)
Figure 1. An overview of the existing proton charge radius results. Results of the scattering experiments are shown with full circles. Empty circles correspond to values determined by reanalysis of the existing data. Full squares represent values obtained from the Lamb shift measurements. The values de-termined from the muonic hydrogen measurements are colored red [4].
DOI: 10.1051/
C
Owned by the authors, published by EDP Sciences, 2014
/2 01
epjconf 4 7200017
This is an Open Access article distributed under the terms of the Creative Commons Attribution License .0, which permits unrestricted use, distribution, and reproduction in any medium, provided the original work is properly cited.
whereQ2 represents the square of the momentum trans-fer four-vector. Unfortunately, the data for Q2 < 0.005 (GeV/c)2 that would allow for a reliable and pre-cise determination of this slope do not yet exist (See Fig-ure 2). Therefore, an extrapolation of availableGEp points toQ2→0 is used to estimater2
E. The extracted value of
r2
Eis extremely sensitive to the details of this extrapola-tion, which in turn strongly depends on the precision and accuracy of the values ofGpEthemselves.
Belushkin (Dispersion Analysis 2007) Price (CEA 1971)
Murphy (Saskatoon 1974) Borkowski (MAMI 1975) Simon (MAMI 1980) Bernauer (MAMI 2010)
Q2range of the MAMI experiment
G
p E/G
Di
po
le
Q2/(GeV2/c2)
0.1 0.01
0.001 0.0001
1.02
1.01
1
0.99
0.98
0.97
0.96
Figure 2. The proton charge form factorGpE normalized to the standard dipole form factor GD =
1−0.71 (GeVQ2 /c)2
−1
as a function ofQ2. The existing data [7–11] are available only for Q2 >0.005 (GeV/c)2. Full black line shows results of the
Dis-persion analysis [12]. For a reliable determination of proton charge radius, data atQ2 ≤0.005 (GeV/
c)2are needed. Yellow
band shows the achievableQ2 range of the new MAMI
experi-ment.
To avoid such uncertainties, measurements of GEp at Q2 < 0.005 (GeV/c)2 are needed. Efforts to do this are limited by the minimal accessibleQ2, which is determined by the utilized experimental apparatus. In particular, the three-spectrometer facility at MAMI [6] is on one hand bounded by the minimal scattering angle to which spec-trometers can be positioned, while on the other hand it is constrained by the minimal applicable beam energy. To evade these limitations, the presented MAMI experiment tries to exploit information stored inside the radiative tail of the elastic peak in order to reach the form-factors at smallerQ2.
2 Initial state radiation
The radiative tail of an elastic peak is dominated by contri-butions of two Bethe-Heitler diagrams [13] shown in Fig-ure 3. The initial state radiation diagram (BH i) describes the process where the incident electron emits a real photon before interacting with the proton. Since the emitted pho-ton carries away part of the incident energy, the momen-tum transferred to the proton (Q2
Vertex) is decreased. Hence, this process opens the possibility to probe the proton struc-ture atQ2
Det =Q2Vertexthat are smaller than the value fixed
by the experimental kinematics. On the other hand, the final state radiation diagram (BH f) corresponds to the re-action where the real photon is emitted only after the in-teraction with the nucleon. Consequently, Q2
Vertex at the vertex remains constant, while the detectedQ2
Det≤Q 2 Vertex changes. Figure 4 shows the results of a full Monte-Carlo simulation that properly considers inelastic Feynman di-agrams. For each of the kinematics the elastic peak and its two radiative tails are clearly visible. The diagonal tail corresponds to initial state radiation, while the hori-zontal one belongs to final state radiation. In an
experi-Q2Vertex Q2Det
(BH f)
(Born i) (Born f) (BH i)
Figure 3.First order Feynman diagrams for inelastic scattering. In the Bethe-Heitler process (BH i, BH f) the photon is emitted by the electron; in Born processes (Born i, Born f) it is emitted by the proton.
ment onlyQ2
Detcan be measured, which means that look-ing only at data, initial state radiation processes can not be distinguished from the final state radiation. To reach in-formation corresponding only to the initial state radiation, measurements need to be studied together with results of a Monte-Carlo simulation. This is the basic idea of the discussed MAMI experiment, which aims to extractGEpin the range 10−4≤Q2≤0.005 (GeV/c)2.
3 Monte-Carlo simulation
In a detailed analysis, Feynman diagrams corresponding to Born terms (see Figure 3), where initial and final proton emit real photons, and various vertex corrections should also be considered [14–16]. These additional diagrams camouflage the form factors and make their direct extrac-tion from cross-secextrac-tion measurements impossible. There-fore, an alternative approach is being employed in which data are directly compared to the simulation.
10−4
10−3
10−2
10−1
50 100 150 200 250 300 350 400 450 500
10−4 10−3 10−2
Energy of scattered ElectronE[MeV] Q2at Detector[GeV2/c2]
Q
2at
V
ertex
[
Ge
V
2/
c
2]
100
101
102
103
104
105
106
107
108
109
Ev
en
ts
Figure 4. Results of Monte-Carlo simulation for experimental settings with beam energies 195 MeV, 330 MeV and 495 MeV. The plot shows the detected rates as a function ofQ2
Vertexat the
vertex andQ2
Detor energy of scattered electron which are directly
measured by the spectrometer. Diagonal and horizontal tails in each settings are caused by initial state and final state radiation, respectively.
In the analysis the simulation will be run for different parameterizations of form-factors. The best value forGpE at eachQ2will then be determined viaχ2-minimization of difference between the data and the simulation. The con-tribution ofGpMwill be considered only in the estimation of the systematic uncertainty.
4 Pilot measurement
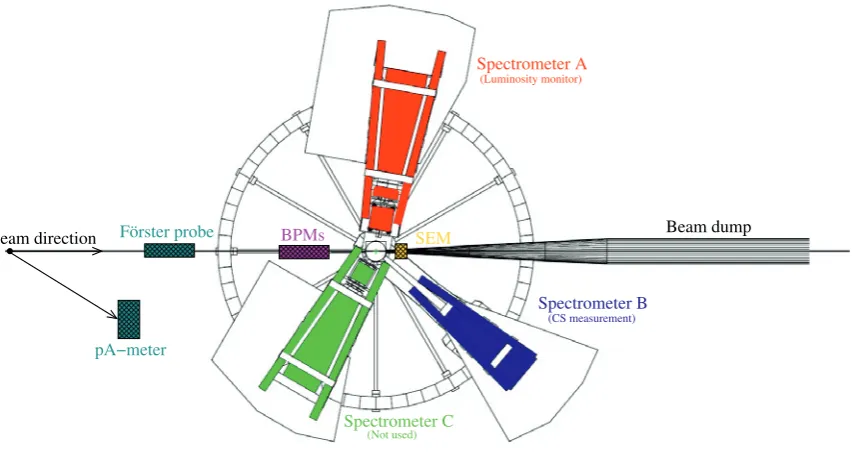
First measurements have been performed in 2010 using the three spectrometer setup [6] of A1 Collaboration (see Fig-ure 5). Rastered electron beam with energies of 195 MeV, 330 MeV and 495 MeV was used in combination with a liquid Hydrogen target. For cross-section measurements spectrometer B was employed. It was positioned at a fixed angle of 15.25◦, while its momentum settings were being adjusted to scan the complete radiative tail for each energy setting. Kinematic settings were chosen such that the ra-diative tails of all three setting overlap (see Figure 4). This enables us to test our experimental technique in the region where form-factors are well known, i.e.GpEextracted from the radiative tail can be compared to the value obtained from the elastic peak at the coinciding Q2. In total, 60 different setups were devised, resulting in three weeks of data taking: two weeks for production measurements and one week for empty-cell measurements, needed for proper background subtraction.
Beam currents were between 10 nA and 1μA, depend-ing on the setup and were measured by two probes: the non-invasive Förster probe and the invasive pA-meter. Un-fortunately at low beam currents and low beam energies neither of the probes is accurate enough. Hence,
spec-trometer A, positioned at a fixed setting, was employed for precise monitoring of beam luminosity.
The purpose of these measurements was to test the fea-sibility of the proposed experiment planned for late 2013. The analysis of the data revealed that optical matrices needed for the reconstruction of the particle coordinates at the target from the directly measured detector variables were not optimal and need to be improved. The deter-mined widths of the momentum distributions were much broader then the idealδp/p=10−4[6].
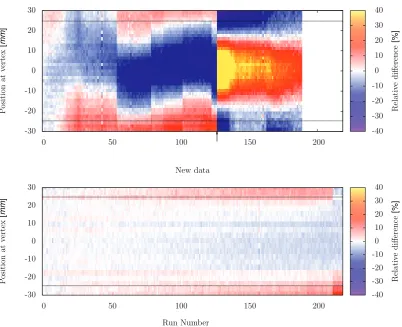
The most critical problem exposed by the data analy-sis is related to the cryogenic deposition on the target cell. It consists of residual nitrogen, oxygen and water present in the scattering chamber due to insufficient vacuum con-ditions (≈10−4mbar). Furthermore, it was observed that the thickness of the deposited layer changes with time (see Figure 6 (top)). The accumulated layer does not affect only particle energy losses, but changes also the detection rates and skews the luminosity measurements.
5 Improvements to the experimental
apparatus
To overcome the problem with cryogenic depositions, a higher vacuum inside the scattering chamber had to be en-sured. This was achieved by replacing gaskets and Kapton foils in the target windows. Additionally, the foils were enforced with an additional layer of Aramid foil, which allowed us to establish two order of magnitude better vac-uum (≈ 10−6mbar) inside the scattering chamber. This has significantly improved the measured spectra. See Fig-ure 6 (bottom) for details. The effects of cryogens accu-mulating on the target walls are still visible, but effects are on the order of few percent.
The residual cryogenic depositions were monitored with spectrometer A, which was configured such that both elastic data from hydrogen needed for luminosity deter-mination as well as elastic data from walls and cryogens were within spectrometer’s acceptance. As demonstrated in Figure 7 the spectrometer has enough resolving power to clearly distinguish contributions of nitrogen and oxygen from contributions of other target elements, which allows us a precise determination of the thickness of the cryo-genic layer and the corresponding particle energy-loss cor-rections.
To optimize optics matrices and improve the spec-trometer performance for low energy running, a two week beam time was held right before the full experiment, which was dedicated to optics calibration of the spectrometers. Using these data, new optics matrices will be generated, which will then endow spectra with best possible resolu-tions.
Beam dump
pA−meter
BPMs SEM
Beam direction Förster probe
Spectrometer A
Spectrometer B
(Luminosity monitor)
(CS measurement)
Spectrometer C (Not used)
Figure 5. Three spectrometer setup at MAMI [6]. Spectrometer A is employed as luminosity monitor, while spectrometer B is used for cross-section measurements. Beam current is measured with non-invasive Förster probe and invasive pA-meter, both located inside the MAMI accelerator. Beam position is determined with two beam position monitors (BPMs) mounted right in front of the target. In the 2013 experiment a secondary electron emission monitor (SEM) was mounted in front of the beam dump as a supplementary beam current monitor.
193 193.5 194 194.5 195
42 44 46 48 50 52 54 56
Scattering Angleθe[deg]
Energy
of
sc
attered
electron
E
[MeV
]
100
101
102
103
104
Ev
en
ts
14N 16O 184W
59Co∗
52Cr∗ 56Fe∗
59Co,58Ni, 56Fe,54Mn,
96Mo
52Cr
Figure 7. The distribution of scattered electrons detected by spectrometer A as function of scattering angleθeand energy of the detected particleE. Plot shows upper part of the measured spectrum, where energies of scattered electrons are very close to beam energy of 195 MeV. The almost horizontal bands corre-spond to heavy elements contained inside the Havar target walls. Electrons scattered from these elements have almost no recoil correction. The slanted bands are contributions of cryogenic ni-trogen and oxygen with still observable recoil correction. The
59Co∗, 56Fe∗and52Cr∗denote first excited states of these three elements.
and are drawn by the electric field towards the outer foils. The charge lost by the middle foil is proportional to the beam current and is measured by a high precision charge integrator. Such detector [17] should enable us to precisely measure very low (≤10 nA) beam currents. Furthermore, being installed right next to the target (see Figure 5) it of-fers an opportunity to measure the actual beam current at the target, since the Förster probe and the pA-meter are both located inside the accelerator and their readings may be overestimated due to the losses of the beam transport to the experimental hall.
Unfortunately, in the experiment the SEM monitor did not perform as well as expected, even though both sensor and electronics were carefully built and installed. In spite of the extensive debugging and many calibration measure-ments, the desirable resolution of ≤ 1 % could never be reached. Hence, we could not use it as an alternative to the standard probes but only as a supplementary device to monitor the presence of the beam in the hall.
-30 -20 -10 0 10 20 30
0 50 100 150 200
P
o
si
tion
at
v
ertex
[
mm
]
Old data
-30 -20 -10 0 10 20 30
0 50 100 150 200
P
o
si
tion
at
v
ertex
[
mm
]
Run Number New data
-40 -30 -20 -10 0 10 20 30 40
Relativ
e
difference
[%]
-40 -30 -20 -10 0 10 20 30 40
Relativ
e
difference
[%]
Figure 6. Top: Time evolution of the relative changes in the normalized vertex distribution during the 195 MeV setting of the pilot measurement in 2010. As time progresses (increasing run number), more events (per run) come from target walls and less from the center of the target, which indicates that the thickness of the layer of cryogens around the target cell increases. The arrow indicates a data set taken at a higher beam current, which brought enough power to melt the cryogens. Afterwards more events are again coming from the center and less from the walls. The position of the target walls is indicated by the dashed line. Bottom: Equivalent plot obtained with the 2013 data. Effects of cryogenic depositions are still visible. However, the relative changes inside the target cell are much smaller.
6 Full scale experiment
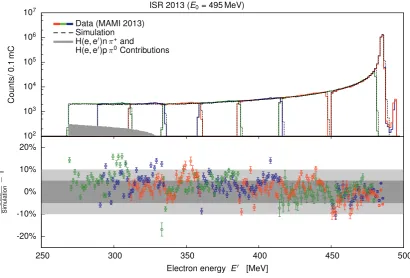
The full experiment of the proton charge form-factor at MAMI was successfully performed in August 2013. The experimental setup was very similar to the one used in the 2010 pilot experiment (see Section 4), with the modifica-tion described in Secmodifica-tion 5. Except for some minor is-sues related to the apparatus at the beginning of the ex-periment, very stable running conditions were established, which provided us with high quality data. Figure 8 shows the results of on-line analysis together with the first com-parison to the simulated spectra.
The measured momentum distributions belonging to different kinematic settings are consistent and together form a continuous radiative tail. A coarse structure ob-served on top of the distributions is related to a changing detection efficiency and can be corrected by using calibra-tion data. The small elastic peak on the right hand side of the main hydrogen peak corresponds to events coming from the target walls after all acceptance cuts were
ap-plied. The presence of such peak indicates the need for better vertex resolution, i.e. improved optics matrices.
In order to obtain a faithful comparison of the data to the simulation, pion production processes were also con-sidered in theSimul++via MAID model [18]. They con-tribute up to 10 % of the statistics in the lowest energy bins. With the inclusion of these corrections a reasonable agree-ment between data and simulation, with a relative differ-ence smaller than 10 % was achieved already by the on-line analysis. This suggests thatSimul++can satisfacto-rily mimic real data and that proposed approach can be successfully utilized to extract proton charged form-factor information atQ2≈10−4(GeV/c)2.
7 Conclusions and Outlook
Electron energy E [MeV]
Da
ta
Si
m
u
la
tion
−
1
500 450
400 350
300 250
20%
10%
0%
-10%
-20%
H(e, e)pπ0Contributions
H(e, e)nπ+and
Simulation Data (MAMI 2013)
Count
s/
0.
1
m
C
107
106
105
104
103
102
ISR 2013 (E0= 495 MeV)
Figure 8. Top: Distributions of events as functions of energy of scattered electrons (E). At the beam energy of 495 MeV data were taken for eight different kinematic points shown on the plot with different colors. The measured spectrum was normalized to 1.0 mC and consists of a hydrogen elastic peak and its radiative tail. A smaller elastic peak on its right corresponds to events coming from the walls and cryogens. The dashed line shows the theoretical predictions obtained bySimul++. The gray band demonstrates the contribution of the pion production processes determined with MAID [18]. Bottom: The relative differences between data and simulation for each kinematic setting. Dark and light gray bands denote 5 % and 10 % difference, respectively.
this matter, by measuringGEp at very lowQ2. For that pur-pose a new technique is being considered, which exploits the information hidden inside the radiative tail, to deter-mineGEp forQ2as low as 10−4(GeV/c)2. For the experi-ment two sets of measureexperi-ments have been made by using the three spectrometer facility of the A1-Collaboration. A pilot measurement was performed in 2010, which revealed problems mostly related to the magnetic optics of the spec-trometers and to the accumulation of residual cryogenic gases around the target walls. All these handicaps were in-vestigated and addressed before the full scale experiment, which ran in August 2013. Since then data analysis is un-derway and it is foreseen that the first preliminary results will be available in late 2015.
Acknowledgements
This work is supported by the Federal State of Rhineland-Palatinate and by the Deutsche Forschungsgemeinschaft with the Collaborative Research Center 1044.
References
[1] R. W. McAllister and R. Hofstadter, Phys. Rev.102, 851 (1956).
[2] R. Pohlet al., Nature466, 213 (2010).
[3] A. Antogniniet al., Science339, 417 (2013).
[4] J. Beringer et al. (Particle Data Group), Phys. Rev. D86, 010001 (2012)
[5] M. N. Rosenbluth, Phys. Rev.79, 615 (1950). [6] K. I. Blomqvistet al., Nucl. Instr. and Meth. A403,
263 (1998).
[7] J. C. Bernauer et al., Phys. Rev. Lett. 105, 242001 (2010).
[8] G. G. Simonet al., Nucl. Phys. A333, 381 (1980). [9] F. Borkowskiet al.., Nucl. Phys. B93, 461 (1975). [10] J. J. Murphyet al., Phys. Rev. C9, 2125 (1974). [11] L. E. Priceet al., Phys. Rev. D4, 45 (1971).
[12] M. A. Belushkin et al., Phys. Rev. C 75, 035202 (2007).
[13] M. Vanderhaeghenet al., Phys. Rev. C62, 025501 (2000).
[14] L. C. Maximon J. A. Tjon, Phys. Rev. C62, 054320 (2000).
[15] Y.-S. Tsai, Phys. Rev.122, 1898 (1960).
[16] L. W. Tsai, Y. S. Tsai, Rev. Mod. Phys. 41, 205 (1969).
[17] S. A. Blankenburget al., Nucl. Instr. and Meth.39, 303 (1965)
![Figure 2.The proton charge form factorfunction ofpersion analysis [12].charge radius, data at GpE normalized tothe standard dipole form factor GD =�1 −Q20.71 (GeV/c)2�−1as a Q2](https://thumb-us.123doks.com/thumbv2/123dok_us/8197638.1369257/2.595.352.495.227.406/figure-proton-charge-factorfunction-ofpersion-analysis-normalized-standard.webp)