Article
Numerical
Analysis
for
A
erodynamic
B
ehaviour
of
Hyperloop
Pods
YadawendrSingh1* 0000-0002-6950-7139,KamyarMehran2
1 SchoolofElectronicEngineeringandComputerScience,QueenMaryUniversityofLondon,MileEndRd, London,UnitedKingdom;[email protected]
2 SchoolofElectronicEngineeringandComputerScience,QueenMaryUniversityofLondon,MileEndRd, London,UnitedKingdom;[email protected]
* Correspondence:[email protected]
Abstract: BasedonK-e StandardWall turbulence model(2-Equation)and Navier-Stokes(N-S) equationsdefinedforincompressiblefluids,fluidflowbehaviouraroundhyperlooppodsinan evacuatedtubewassimulatedusingANSYSfluentsolverassumingsteadystateandtwodimensional conditions.Inthisresearch,todevelopthecasestudies,usingcombinationofdifferentheadand tailshapeprofile,fourkindofhyperlooppodsweredevelopedwiththeaidofSolidWorks.These fourpodshavebeeninvestigatedfortheiraerodynamicbehaviourasfourdifferentcasescenarios. Theresultsofsimulationdepictsthatanatmosphericpressureof100Pawithblockageratioof0.36 intubeprovidesthebestpossibleaerodynamicbehaviourforthedesignedhyperlooppodmodels. Thisresearchfindsthatoverallaerodynamicbehaviourofhyperlooppodscanbevariedbychanging theheadandtailshapeprofileofpodsandaparticularcombinationofheadandtailshapeprofile canprovideoptimallybestaerodynamiccapabilities. Thus,thisresearchpaperprovidesanovel methodofobtainingbestaerodynamiccapabilitiesinhyperlooppodsbydesigningheadprofile optimallyincombinationwithtailprofile.Thisoutcomewillprovidemajorcontributiontowards thedevelopmentofhyperlooppodsinfuturewithbetteraerodynamicbehaviourresultinginlesser electricalenergyrequiredtopropelthehyperlooppodsinevacuatedtube.
Keywords:Hyperloop;CFD;K-e model;Aerodynamics;Energyefficiency
1. Introduction
In contemporary energy sector, there are many challenges being faced by humankind such as depletion of non-renewable energy resources, environmental degradation resulting in climate change across the world, etc. To counter these detrimental challenges, it is demand of time to find novel techniques and methods of energy generation and utilisation in all energy dependent areas. Transportation being one of the key areas where energy source is highly critical and has been a major contributor towards environmental degradation. Although, electrical energy based transportation systems are helping to reduce these challenges but they have their own drawbacks. Considering these challenges and need for humankind to travel faster in 21st century is presenting many difficulties in traditional transportation means [1].
The scientists and researchers around the globe have been working on different methods to devise novel approach to environment friendly and faster transportation systems. Oster [2-3] devised the idea of transportation which involved evacuated tubes. The concept of evacuated tube transportation system offers many advantages such as economical energy consumption, higher speed, reduced noise pollution, reduced aerodynamic resistance etc. [4-6]. Y.P. Zhang et. al. [7] presented some key issues
related with the evacuated tube transportation systems which must be considered during the design stage.
In 2012, American technology entrepreneur Elon Musk pitched the revolutionary idea of hyperloop which works on the evacuated tube technology. This has motivated the various academics and industry sectors to work towards different concepts of hyperloop which could cater an optimal solution in terms of efficiency, energy consumption, cost etc. and various models have been presented in the hyperloop pod competitions sponsored by SpaceX.
Hyperloop is a newly proposed potential mode of high-speed transport in which well aerodynamically designed pods are propelled through partially evacuated tubes where atmospheric pressure is reduced to around 0.1-1% of normal atmospheric pressure[8]. For a constant temperature, air density inside the tube decreases owing to the lower atmospheric pressure. This helps to reduce the aerodynamic drag experienced by hyperloop pods inside tube. In hyperloop, levitation is achieved by using the powerful electromagnets. Alternatively, air bearings can also be used to levitate the tube where compressed air is continuously being supplied to the air bearings. Linear accelerators placed at strategically defined positions are used to propel the hyperloop pods in transonic velocity zone [9]. Thus, hyperloop is analogous to a train which uses aerospace technologies to operate at a much higher speeds than train with negligible emissions. Like an aircraft travels at higher altitudes which provides lower atmospheric pressure resulting in lower aerodynamic drag, in a similar fashion, hyperloop employs partially evacuated tubes to maintain the lower atmoshperic drag on ground level.
To achieve a better performance from hyperloop pods, aerodynamic design is of paramount importance to achieve maximum possible speed with minimal electrical energy required for propulsion [10]. This can be achieved by an optimal shape profile of pod during design stage. However, a hyperloop pod is subjected to following aerodynamic challenges in the transonic range:
1.1. Flow Regime
Hyperloop tube provides a very unconventional flow regime inside of it with high Mach numbers in subsonic velocity zone with Reynold numbers being relatively low. Air density inside of a hyperloop tube is quite less owing to the lower atmospheric pressure. Since the Reynold number is directly proportional to air density, Reynold number of flow inside the hyperloop tube also becomes lower. Typically, inside of an evacuated hyperloop tube, Reynold number is of the order of 105. This entails that, the flow behaviour inside of hyperloop tube will change from laminar to turbulent at a particular point on the surface of hyperloop pod [11]. From the aerodynamics point of view, laminar and turbulant flows will cater differing characteristics in fluid flow performance. Thus, it becomes an important consideration to investigate and determine the diverging points on hyperloop pod’s surface where the diversion of fluid flow behaviour is taking place. Further, due to lower Reynold numbers and higher thickness of boundary layers, it becomes likely for boundary layer separation to happen [12]. In scenarios such as that of a hyperloop tube, where exists a higher boundary layer thickness along with higher pressure gradient, boundary layer separation becomes almost inevitable. This phenomenon causes a significant amount of increase in aerodynamic drag. Thus, it becomes highly critical for hyperloop pods to be well aerodynamically designed to lower the probability of boundary layer separation and achieving lesser aerodynamic drag associated with fluid flow. Based on above discussion, it is apparent that an unusual and distinctive flow conditions exists inside of an evacuated hyperloop tube and hyperloop pod must be designed with an optimal aerodynamic behaviour to compensate for these conditions as much as possible.
1.2. Kantrowitz Limit
of the kantrowitz limit in aerodynamic design may cause three times increase in aerodynamic drag resistance [11,14].
In theory, Kantrowitz limit is a hypothesis which describes choked behaviour of fluid flow in transonic range in gas dynamics. According to this concept, for the fluid flow encountering areal restrictions in flow path, fluid flow velocity is increased to maintain the constant mass-flow rate in line with continuity equation. But, when the fluid flow velocity corresponds to supersonic range, increase in fluid flow velocity will be restricted to the local velocity of sound and fluid flow will get choked upon reaching this velocity. This situation corresponds to sonic conditions because Mach number reaches in the range of 1. In this manner, Kantrowitz limit provides the maximum contraction in fluid flow path which can be allowed for a fluid flow before it gets choked. Regardless of pressure changes in upstream/downstream flow, fluid flow velocity can never increase beyond this value. It has been observed that maximum fluid velocity before it gets chocked is inversely related to internal pressure of tube and blockage ratio. Thus, an evacuated tube with minimal blockage ratio will provide the best aerodynamic efficiency. However, blockage ratio can not be minimised below a certain value as it will cause the tube size to become too big which is not suited from monetory and logistic point of view. Y. Zhang [16] found that blockage ratio in range of 0.25-0.7 is reasonably optimum for a good aerodynamic design.
In hyperloop, tightly sealed pods with passengers in it are propelled with velocity in range of high subsonic speeds inside an evacuated tube. When the fluid flow inside the tube encounters the hyperloop pods, it faces areal contraction in flow path around the pod. Thus, inline with continuity equation, fluid flow velocity around the pod increases and when the pod’s velocity reaches to a limit which imposes sonic conditions on fluid flow around the pod, fluid flow gets choked. This causes a higher aerodynamic resistance on the flow path resulting in need of more electrical energy consumption to keep propelling the pods. Thus, in hyperloop, for a defined tube to pod area, kantrowitz limit provides maximum velocity a hyperloop pod can achieve before fluid flow around it gets choked and aerodynamic resistance rises suddenly.
From aerodynamic design point of view, to reduce the effects of Kantrowitz limit, two methods can be employed:
• First method is to increase the radial size of tube to provide more bypass area for fluid flow around the pod resulting in more buffer velocity for pod before which the fluid flow gets choked. But, the drawback of this method is, hyperloop tube becomes very bulky which is not very feasible from logistic and spatial point of view.
• Second method is to deploy a turbine fan (compressor) in front section of the pod which will pull a major chunk of incoming fluid flow and push it out from the tail section of hyperloop pod resulting in reduced far field impacts [17]. This will significantly reduce the amount of fluid flowing around the pod and virtually providing more cross sectional area for the fluid flowing around the pods. An electric motor powered by solar batteries can be used to run the on-board turbine fans.
The second method is more feasible and turbine fans act in similar fashion as in jet engines to actively draw the incoming fluid flow from head side of pod and bypass it through the tail section. The fraction of this bypassed fluid flow can also be utilised to energise the air bearings in order to provide low friction suspension to hyperloop pods.
Where:
Abypass: Fluid flow bypass area Atube: Overall tube area. M: Mach number
g=cp/cv: Isentropic expansion factor cp: Specific heat of fluid at constant pressure cv: Specific heat of fluid at constant volume
1.3. Aerodynamic Disturbances
In conventional modes of transport where velocity is very much below the sonic velocity, shock waves and their impact on the aerodynamic behavior is negligible and hence they are not considered as a hindrance during design stage. However, in hyperloop, where pods are intended to travel with a velocity in transonic ranges, shock waves and their effect on the aerodynamic performance can be significant and must be considered as an important aspect during the design of hyperloop pods. Shock waves in hyperloop are characterised by an abrupt variation of fluid’s density, temperature and pressure as the local flow velocity around hyperloop pod rises to the level of sonic range velocity.
T. Kim et. al [18] studied the effect of shock waves on maglev trains in an evacuated environment and observed that, in range of velocities equivalent to Mach no. M = 0.57 with blockage ratio = 0.5, weak shock waves were found at the rear of train. In addition to normal shock waves, they found the existence of oblique shock waves and noted that oblique shock waves were caused by the interaction of fluid between the walls of train and tube. However, under similar conditions, when blockage ratio was reduced (<0.25), no shock waves were found and they observed that an operating velocity equivalent to Mach no. M = 2.5 can be achieved. Thus, blockage ratio is an important aspect which should be considered during the design of hyperloop pods to limit the effect of shock waves.
Figure 1.Shock Waves at M=0.57 [18]
The most profound impact of shock waves on aerodynamic performance is net pressure loss which creates another unwanted drag force known as wave drag [19]. Another undesirable effects of shock waves is, they lead to separation of boundary layer near foot of the shock resulting in significant rise in pressure drag. Hence, considering these detrimental impacts on aerodynamic behaviour, a hyperloop should be well designed to avoid the generation of shock waves [20].
in a cylinder. Thus, in hyperloop pod, pressure drag is considered as a significant component of aerodynamic drag.
1.4. Pod Shape
In hyperloop, while designing the pods, the shape of the pod is of utmost importance owing to varying aerodynamic capabilities with variation in pod shapes. A study done by transportation bureau of United States suggests that, when head and tail profile of trains were designed with semi-circular shapes, air drag coefficients were found in range of 0.015 to 0.11 [22]. These outcomes were obtained with consideration of blockage ratio of 0.125 to 0.5 and Reynolds number of the order of 105and these parameters are quite similar for the hyperloop also.
Ma et al. [23] did their investigation on maglev trains with varying shapes. However, they were mainly focused on pressure difference between head and tail of the trains which in essence is the significant reason for aerodynamic pressure drag generation. In their study, it was found that variation in tail shape profile caused significant changes in the aerodynamic behaviour of trains, while the variation in head shape profile did not play considerable role in aerodynamic behaviour.
Thus, it is very significant to consider above mentioned aerodynamic challenges, facts and figures in the analysis of aerodynamic behavior of hyperloop pods. This research paper investigates the four different hyperloop pods, mainly varying in their head and tail shape profile, for their aerodynamic behaviour and optimised results based on the computational fluid dynamics simulation have been presented.
This research paper contributes towards obtaining best aerodynamic capabilities in a hyperloop pod by designing an optimal head and tail shape profile. This reduces the aerodynamic drag experienced by hyperloop pod in transonic velocity range and also illustrates that a much higher velocity is achievable for a well designed pod compared to the conventional designated velocity of approximately 760 mph. As a result of reduction in aerodynamic drag, the electrical energy required by linear accelerators to propel the hyperloop pods inside evacuated tube gets reduced significantly, which is one of the core motives behind this research. It has been found from the case simulation results that aerodynamic drag reduction by a factor of 13 can be achieved by an optimal design of head and tail profile.
The remaining of this paper has been organised in following sections: section 2 describes the numerical model where primary assumptions involved, mathematical model, geometry profiles, computational meshing, boundary conditions considered and case simulations are described. Section 3 presents results and discussions where results of case simulations of all the four hyperloop pods are described. This paper is concluded in section 4 with an insight on how the aerodynamic parameters differ with changes in their head and tail profile and which is the best case hyperloop pod model from aerodynamics point of view.
2. Numerical Model
2.1. Primary assumptions
i. The hypeloop pod is designed to run at 340 m/sec with Mach number of 0.99. At such higher speeds, flow field’s Reynolds number will be higher than 105and flow field is considered to be turbulant.Thus, K-etwo equation turbulance model has been considered for the simulation of flow fields.
ii. Tube is assumed to be partially evacuated to 100 Pa at temperature of 293 K.
iii. Considering the blockage ratio, computer performance, convergence degree and computation time, it has been assumed that fluid s incompressible.
v. Since the hyperloop pods are magnetically levitated, friction is negligible. Thus, Aerodynamic drag is the only resistance faced by the hyperloop pod.
vi. Blockage ratio of 0.36 has been chosen based on the recommendations in hyperloop alpha paper [8]
2.2. Mathematical Model
The standard K-etwo equation turbulance model of steady, incompressible and viscous fluid flow in two dimensions has been employed for the simulation of fluid flow of hyperloop. The controlling equations for the mathematical modelling of fluid flow are as presented below [24]:
• Continuity equation:
r.U=0 (1)
• Conservation of momentum equation:
r.(ruU) =r.(rru) ∂p
∂x (2)
r.(ruU) =r.(rru) ∂p
∂y (3)
• Kinetic energy turbulance equation:
r.(rkU) = ∂ ∂y[(µ1+
µt
sk) ∂k ∂y] +µt(
∂u
∂y+
∂v ∂x)
∂v
∂x re (4)
• Kinetic energy dissipation rate turbulance equation:
r.(reU) =r.(rru) ∂ ∂y[(µ1+
µt
se) ∂e
∂y] +
e kC1µt
∂v ∂x(
∂u
∂y+
∂v
∂x) C2r
r2
k (5)
Where,
U: Flow field velocity vector in m/s u: x component of U
v: y component of U p: flow field pressure in Pa r: air density in Kg/m3
µ1: Viscosity coefficient for laminar flow in N.s/m2 k: Turbulence kinetic energy in J/Kg
e: Turbulence dissipation rate in J/Kg
µt:rCµk2/e
C1: 1.47 C2: 1.92 Cµ: 0.09 sk: 1.0 se: 1.3
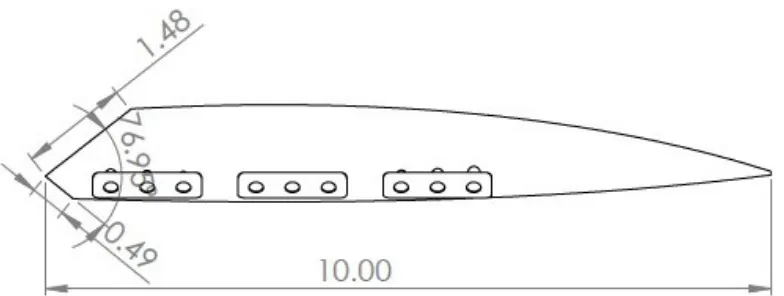
2.3. Geometry profile of hyperloop pod models
been investigated for their aerodynamic behaviour as four different case scenarios. The front view of the four case models with dimensions in metre is provided in fig. 2 to fig. 5 below:
Figure 2.Case-1 Hyperloop Pod Model (Front View)
Figure 3.Case-2 Hyperloop Pod Model (Front View)
Figure 5.Case-4 Hyperloop Pod Model (Front View)
2.4. Computational Meshing
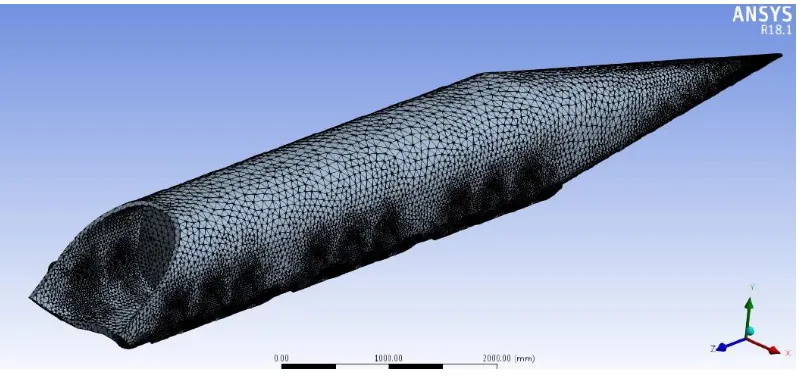
In computational fluid dynamics, to obtain the solution of partial differential equations, the problem geometry is represented in descrete manner. In essence, the problem geometry is divided into nodes and elements over which the governing equations are approximated [24].
For example, in Fig. 6, the entire geometry of length 10 m has been meshed and mesh has been refined.
Figure 6.Mesh Generation
2.5. Boundary Conditions
Following boundary conditions have been selected for the analysis based on the recommendations in hyperloop alpha paper [8]. Hyperloop alpha paper is an open source white paper presented by SpaceX where they have presented the design concepts and considerations which can be used by the researchers for hyperloop design.
i. Inlet velocity of 300 m/s has been selected as the inlet flow boundary condition. ii. Outlet pressure of 0 Pa (G) has been selected as outlet flow boundary condition. iii. Hyperloop wall boundary is selected as ’No slip conditions’.
2.6. Case Simulations
case simulations have been developed for three scenarios namely velocity profile, pressure profile and force results.
i. Velocity profile provides the variation in the field flow velocity along the hyperloop pod and maximum velocity point has been identified in the results.
ii. Pressure profile provides the variation in the field flow pressure along the hyperloop pod and maximum pressure point has been identified in the results.
iii. Force results provide the amount of drag and lift forces generated by the fluid flow on hyperloop pod surface.
3. Results and Discussions
3.1. Case-1
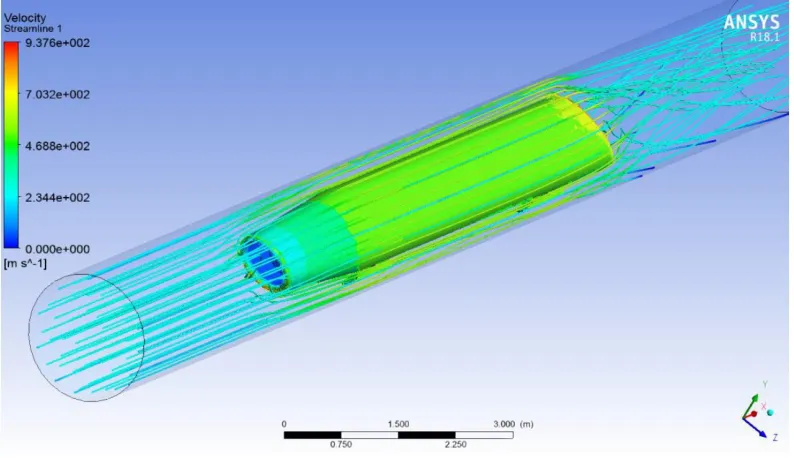
Based on the simulation of case-1 hyperloop pod model, velocity streamline and pressure streamline results have been presented in Fig. 7 and Fig. 8 respectively.
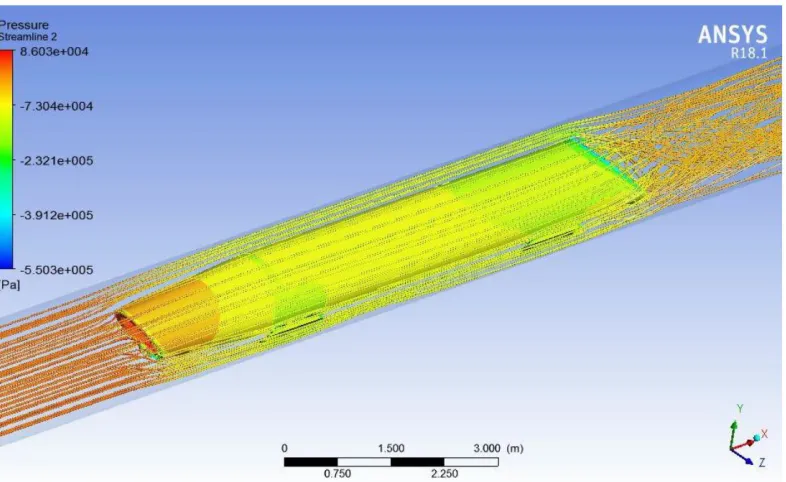
The maximum fluid flow velocity of 937.6 m/s is observed on the top surface of hyperloop pod’s wall towards tail side because of lift forces. The maximum fluid flow pressure of 8.603e4Pa is observed on the front of pod because of straight hitting of air on the hyperloop pod’s head. Force results provide that this pod generates a drag force of 50335.3 N and Lift Force of 91715.7 N.
Figure 7.Case-1: Velocity Streamline (Max. Velocity = 937.6 m/s)
3.2. Case-2
Based on the simulation of case-2 hyperloop pod model, velocity streamline and pressure streamline results have been presented in Fig. 9 and Fig. 10 respectively.
Figure 8.Case-1: Pressure Streamline (Max. Pressure = 8.603e4Pa)
Figure 9.Case-2: Velocity Streamline (Max. Velocity = 918.3 m/s)
3.3. Case-3
Based on the simulation of case-3 hyperloop pod model, velocity streamline and pressure streamline results have been presented in Fig. 11 and Fig. 12 respectively.
Figure 10.Case-2: Pressure Streamline (Max. Pressure = 9.208e4Pa)
pod generates a drag force of 4141.37 N and Lift Force of 307536 N.
Figure 11.Case-3: Velocity Streamline (Max. Velocity = 1107.02 m/s)
3.4. Case-4
Based on the simulation of case-4 hyperloop pod model, velocity streamline and pressure streamline results have been presented in Fig. 13 and Fig. 14 respectively.
Figure 12.Case-3: Pressure Streamline (Max. Pressure = 2.607e5Pa)
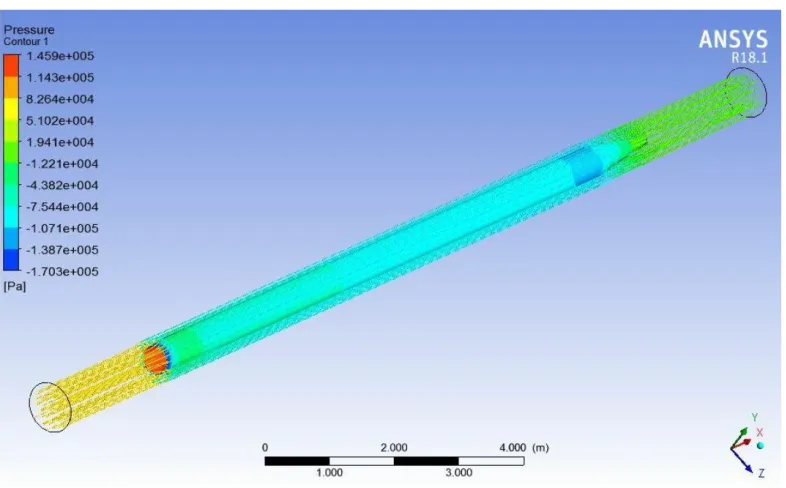
because of straight hitting of air on the hyperloop pod’s head. Force results provided that this pod generates a drag force of 26555.8 N and Lift Force of 2294.34 N.
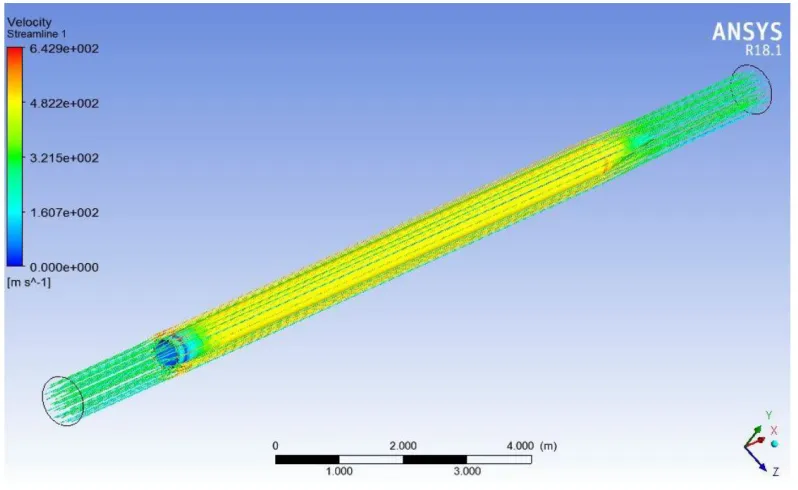
Figure 13.Case-4: Velocity Streamline (Max. Velocity = 642.9 m/s)
Figure 14.Case-4: Pressure Streamline (Max. Pressure = 1.459e5Pa)
those points and vice-versa. This is in accordance with law of conservation of energy in fluid dynamics which infers that flow velocity and flow pressure are inversely related.
Table-1 shows the comparison of simulation results in terms of Drag force, Lift Force, Maximum velocity and Maximum pressure for all the four investigated models of hyperloop pod.
Table 1.Simulation Results of four different hyperloop pod models
Parameter Case-1 Case-2 Case-3 Case-4 Drag Force (N) 50335.3 54094.3 4141.37 26555.8 Lift Force (N) 91715.7 98218.3 307536 2294.34 Maximum Pressure (Pa) 8.603e4 9.208e4 2.607e5 1.459e5 Maximum Velocity (m/s) 937.6 918.3 1107.2 642.9
4. Conclusion
Four different models of hyperloop pod were designed for analysis as part of this research work. These four models were analysed using ANSYS fluent solver and simulation results are presented in table-1.
• Case-1 and 2 pods have same tail shape profile but head shape profile of pod-1 is 10 slant
in comparison to that of pod-2. It can be observed from the results that there is considerable difference between the drag and lift forces of case-1 and 2 pods.
• Case-2 and 4 pods have same head shape profile but case-4 pod has altogether different tail shape profile in comparison to case-2 pod. From the results in table-1, it can be observed that aerodynamic parameters of case-2 and 4 pods differ significantly from each other.
• Case-3 and 4 pods have similar tail shape profile but altogether different head shape profile. It is
• Also, it is evident from the simulation results in table-1 that case-3 hyperloop pod model provides
the optimal aerodynamic behaviour with significantly lesser drag force and maximum velocity is achievable for this pod.
Based on these observations, it can be concluded that aerodynamic behaviour of the hyperloop pods differ with variation in head and tail shape profiles and an optimal aerodynamic behaviour can be obtained by suitable design of the hyperloop pod. This aerodynamic behaviour in hyperloop pods is different from the aerodynamic behaviour of maglev trains investigated by Ma et al. [23] where it was observed that aerodynamic capabilities are mainly dependent on tail shape profile and variation in head shape profile do not provide considerable variation in aerodynamic behaviour.
The above outcomes of this research work will provide major contribution towards the development of hypeloop pods in future. It gives researchers the flexibility of obtaining best aerodynamic capabilities in pods by designing the head and tail shape profiles suitably. Based on this novel idea, It is recommended to carry out the analysis of pods with various head and tail profiles other than ones in this research. A well designed pod will not only provide better aerodynamic capabilities to achieve better speed, it also reduces the amount of electrical energy required by linear accelerators to propel the hyperloop resulting in significant energy savings overall.
References:
[1] Y.P. Zhang, S.Z. Mei, X.G. Zeng, ETT-lead the highspeed transportation of the 21st century, World Sci-Tech Research and Development, 2002, 24(2): 60-64.
[2] D. Oster, ET3, http://www.et3.com, 2004-05-12.
[3] D. Oster, Crystal River, Fla. Evacuated Tube Transportation, United States Patent: 5950543, 1999. [4] D. Oster, M. Kumada, Y.P. Zhang, Evacuated tube transport technologies (ET3)tm: a maximum value global transportation network for passengers and cargo, Journal of Modern Transportation, 2011, 19(3):42-50.
[5] Y.P. Zhang, Y.Y. Li, Role and position of ETT in the future comprehensive transportation system, In: The Proceedings of International Conference on Transportation Engineering 2007, Chengdu, China, 2007: 2796-2803.
[6] Q.H. Qian, Some issues on design of underground magnetic levitation transportation system, Tunnel Construction, 2011, 31(2): 155-160
[7] Y.P. Zhang, D. Oster, M. Kumada, et al., Key vacuum technologies to be solved in evacuated tube transportation, Journal of Modern Transportation, 2011, 19(2): 110-113
[8] Musk, E. Hyperloop Alpha. s.l. : SpaceX, 2013.
[9] Mi, B. and Zhan, H. and Zhu, J., Simulation of aerodynamic drag of high-speed train in evacuated tube transportation, Journal of Vacuum Science and Technology , 877 (2013).
[10] J. Braun, J. Susa, and C. Pekardan, Aerodynamic Design and Analysis of the Hyperloop, American Institute of Aeronautics and Astronautics , 1 (2016).
[11] M. Opgenoord and P. Caplan, On the Aerodynamic Design of the Hyperloop Concept, American Institute of Aeronautics and Astronautics, 1 (2016).
[12] Schlichting, H. and Gersten, K., Boundary Layer Theory, 9th ed. (Springer-Verlag, 1221 Avenue of the Americas, New York, NY 10020, 2017).
[13] A. Kantrowitz and C. Donaldson, Preliminary Investigation of Supersonic Diffusers, National Advisory Committee on Aeronautics (1945).
[14] Wong, F., 2018. Aerodynamic Design and Optimization of a Hyperloop Vehicle, s.l.: Delft University of Technology.
[15] Y. Zhang, Numerical simulation and analysis of aerodynamic drag on a subsonic train in evacuated tube transportation, Journal of Modern Transportation 20, 44 (2012).
[17] Van Wie, D; Kwok, F; Walsh, R (July 1996). "Starting characteristics of supersonic inlets". AIAA 96-2914. doi:10.2514/6.1996-2914.
[18] T. Kim, K. Kim, and H. Kwon, Aerodynamic characteristics of a tube train, Journal of Wind Engineering and Industrial Aerodynamics 99, 1187 (2011).
[19] A. Hodaib and S. Fattah, Conceptual Design of a Hyperloop Capsule with Linear Induction Propulsion System, International Journal of Mechanical, Aerospace, Industrial, Mechatronic and Manufacturing Engineering 10, 835 (2016).
[20] J. Anderson, Fundamentals of Aerodynamics, 5th ed. (McGraw-Hill, 1221 Avenue of the Americas, New York, NY 10020, 2011).
[21] M. Yang, J. Du, and Z. Li, Moving Model Test of High-Speed Train Aerodynamic Drag Based on Stagnation Pressure Measurements, Plos One 12 (2017).
[22] W. Trzaskoma, Tube vehicle system (TVS); technology review (McLean, Va., Mitre Corp., 1970). [23] J. Ma, X. Chen, and L. Zhao, Aerodynamic simulation of evacuated tube maglev trains with
different streamlined designs, Journal of Modern Transportation , 115 (2012).
[24] H. Versteeg and W. Malalasekera, An introduction to Computational Fluid Dynamics, 5th ed. (John Wiley Sons, 605 Third Avenue, New York, NY 10158, 1995).
![Figure 1. Shock Waves at M=0.57 [18]](https://thumb-us.123doks.com/thumbv2/123dok_us/7954045.1319873/4.595.99.492.519.569/figure-shock-waves-at-m.webp)