ISSN(Online): 2319-8753 ISSN (Print): 2347-6710
I
nternational
J
ournal of
I
nnovative
R
esearch in
S
cience,
E
ngineering and
T
echnology
(A High Impact Factor, Monthly, Peer Reviewed Journal)
Visit: www.ijirset.com Vol. 8, Issue 10, October 2019
Numerical Analysis of Three Span Continuous
Bridge Deflection by Using Rotation
Tjatur Haripriambodo
1, Made Suangga
2Student, Master of Civil Engineering Program, Fac. of Engineering, Tarumanagara University, Jakarta, Indonesia1 Lecturer, Master of Civil Engineering Program, Fac. of Engineering, Tarumanagara University, Jakarta, Indonesia2
ABSTRACT: Bridges are infrastructures that experience a dynamic and repetitive load in the long run, so that the condition has the potential to decrease over time. To ensure that bridges are always in service, a systematic effort is needed to monitor the condition of the bridge structure. To meet this demand, in the last few decades Structural Health Monitoring Systems (SHMS) have been introduced which describe a number of ways of monitoring that are implemented on a full scale in civil buildings that aim to assist operators to obtain information on civil service building on an ongoing basis. Among the structural parameters, vertical deflection is the most important parameter to be monitored both in the short and long term or measured in load tests for the purpose of predicting abnormal conditions and ensuring the overall safety of the bridge. This research is aimed at building a mathematical model of the relationship between rotation that occurs in the supports of the bridge with deflection that occurs in the middle of the span of the bridge, especially the three span continuous bridge. The method used is simulating deflection and bridge rotation through a two-dimensional structural analysis of bridges with the application of several positions of concentrated loads. Serial data deflection and rotation obtained are then processed into mathematical models of deflection and rotation equations using the analysis of the multiple regression equations.
KEYWORDS: Bridges, Structural Health Monitoring Systems, Deflection, Rotation I. INTRODUCTION
Bridges are infrastructures that experience dynamic and repetitive burdens in the long run (Nugraha, 2017), consequently they have the potential to experience a deterioration over time. To ensure that the bridge is always in service, a systematic effort is needed to monitor the condition of the bridge structure. To meet this demand, in the last few decades Structural Health Monitoring (SHM) Systems have been introduced that describe a number of ways of monitoring that are applied at full scale to civilian buildings with the aim of assisting Operators to obtain information on civil service services in a sustainable manner. At present the structure being tested and monitored is increasing so that the knowledge of structural behavior is increasing as well. Deflection, rotation (angle rotation), and strain measured during load testing or long-term monitoring of the structure are used to detect indications of changes that are detrimental to the structure. The development and success of the implementation of a long-term structure monitoring system on the bridge has been widely reported by researchers. In recent years tiltmeters (also called inclinometers) are increasingly being used for construction monitoring, structural testing and monitoring the bridge's long-term performance (Ozakgul et al., 2009).
ISSN(Online): 2319-8753 ISSN (Print): 2347-6710
I
nternational
J
ournal of
I
nnovative
R
esearch in
S
cience,
E
ngineering and
T
echnology
(A High Impact Factor, Monthly, Peer Reviewed Journal)
Visit: www.ijirset.com Vol. 8, Issue 10, October 2019
the short and long term or measured in a load test for the purpose of predicting abnormal conditions and ensuring overall safety of the bridge. Very often, to directly measure bridge deflection is not easy, or even impossible due to physical or climatic conditions (Ozakgul et al., 2009).
For bridges over rivers, trains, or highways, direct measurement methods are not practical. The method of measuring bridge deflection using rotation data from a tiltmeter (inclinometer) is considered quite promising. This method offers a simple, practical and inexpensive method for measuring static and dynamic deflection of a span of a bridge under load, even for a span of a bridge that crosses heights. Hundreds of experiments and practical tests on simple and continuous bridges, utilizing dynamic and static loads, at various vehicle speeds, show that this method has very high precision, which provides authentic results for reception of newly built bridges and evaluating the safety of old bridges. This method does not require a fixed observation position as another deflection measurement method because the tiltmeter is mounted on the bridge directly, which greatly increases the measurement efficiency. The results obtained through the rotation method of this tiltmeter show as a potential method for measuring bridge deflection, so that the tiltmeter has significant engineering application values and a promising future (Hou et al., 2005).
The Author conducted this research with the aim to obtain a model of deflection and rotation equations (angular turns) on a three span continuous bridge. Practitioners are expected to use this deflection and rotation equation, to estimate deflection based on rotation data from tiltmeter monitoring.
II. RELATEDPAPERS
In this paper, it is presented two papers which relevant with Author paper. II.1 Paper with the title of “Using Inclinometers to Measure Bridge Deflection”
This paper was published on Journal of Bridge Engineering, ©ASCE, September, 2005, written by Hou, X., Yang, X. and Huang, Q. This study contains experiments in the laboratory that provide comparison value of deflection obtained from the tiltmeter (inclinometer) and deflection which is read directly from a deflection meter (micrometer).
II.2 Paper with the title of “Load Testing of Bridges Using Tiltmeters”
This paper was presented in the SEM Annual Conference June 1-4, 2009 Albuquerque New Mexico USA ©2009 Society for Experimental Mechanics Inc, written by Ozakgul, K., Caglayan, O., Uzgider, E. This journal contains the results of experiments on a bridge mounted tiltmeter and deflection meter (Linear Variable Differential Transformer - LVDT) to further apply three vehicle load schemes. Rotation and deflection values obtained from the tool are transformed in the form of cubic spline deflection curves and finite difference analysis. Besides that, analysis was also carried out with the finite element 3-dimensional method using certain software to produce deflection.
III.TWO DIMENSION STRUCTURAL ANALYSIS
The study began with a two-dimensional (2D) structural analysis of a single bridge girder modeled as a four-beam continuous beam, with a non-prismatic cross section type of girder. Span of bridge is 45 m along A-B, 80 m at B-C section and 45 m at span C-D. Two-dimensional modeling is presented in Figure 1.
Figure 1. Two dimension structure modeling
ISSN(Online): 2319-8753 ISSN (Print): 2347-6710
I
nternational
J
ournal of
I
nnovative
R
esearch in
S
cience,
E
ngineering and
T
echnology
(A High Impact Factor, Monthly, Peer Reviewed Journal)
Visit: www.ijirset.com Vol. 8, Issue 10, October 2019
Figure 2. Deflection and rotation monitored position
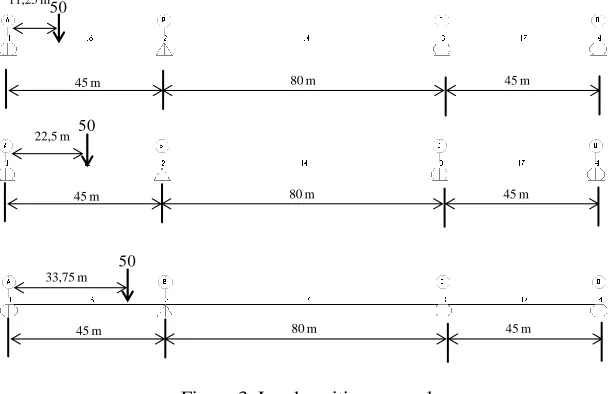
The two dimensional structure analysis of concentrated load is a parametric study by placing point loads of 50 tons, 20 tons and 10 tons, each with 12 load positions (PB), hence there are a total of 36 PB. For example, the first 50 ton (PB1), second (PB2) and third (PB3) load positions are presented below.
Figure 3. Load position example
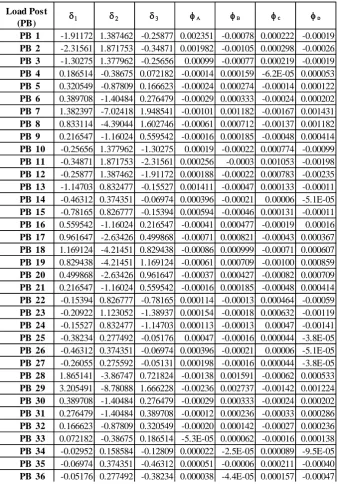
Next step is a two-dimensional structure analysis using Finite Element Method (FEM) software. It results deflection (1, 2, 3) in cm and rotation (A, B, C, D) in radians. It is shown on the following table.
50
50
50
11,25 m
22,5 m
33,75 m
45 m 80 m 45 m
45 m 80 m 45 m
45 m 80 m 45 m
1
2
3
A B C D
A B C D
(LAB)/2
(LBC)/2
ISSN(Online): 2319-8753 ISSN (Print): 2347-6710
I
nternational
J
ournal of
I
nnovative
R
esearch in
S
cience,
E
ngineering and
T
echnology
(A High Impact Factor, Monthly, Peer Reviewed Journal)
Visit: www.ijirset.com Vol. 8, Issue 10, October 2019
Table 1. Deflection and rotation from two dimensional analysis
IV.MULTIPLEREGRESSIONANALYSIS
The results obtained from the two-dimensional structure analysis are processed using the regression method to get the
1 2 3 A B C D
PB 1 -1.91172 1.387462 -0.25877 0.002351 -0.00078 0.000222 -0.00019
PB 2 -2.31561 1.871753 -0.34871 0.001982 -0.00105 0.000298 -0.00026
PB 3 -1.30275 1.377962 -0.25656 0.00099 -0.00077 0.000219 -0.00019
PB 4 0.186514 -0.38675 0.072182 -0.00014 0.000159 -6.2E-05 0.000053
PB 5 0.320549 -0.87809 0.166623 -0.00024 0.000274 -0.00014 0.000122
PB 6 0.389708 -1.40484 0.276479 -0.00029 0.000333 -0.00024 0.000202
PB 7 1.382397 -7.02418 1.948541 -0.00101 0.001182 -0.00167 0.001431
PB 8 0.833114 -4.39044 1.602746 -0.00061 0.000712 -0.00137 0.001182
PB 9 0.216547 -1.16024 0.559542 -0.00016 0.000185 -0.00048 0.000414
PB 10 -0.25656 1.377962 -1.30275 0.00019 -0.00022 0.000774 -0.00099
PB 11 -0.34871 1.871753 -2.31561 0.000256 -0.0003 0.001053 -0.00198
PB 12 -0.25877 1.387462 -1.91172 0.000188 -0.00022 0.000783 -0.00235
PB 13 -1.14703 0.832477 -0.15527 0.001411 -0.00047 0.000133 -0.00011
PB 14 -0.46312 0.374351 -0.06974 0.000396 -0.00021 0.00006 -5.1E-05
PB 15 -0.78165 0.826777 -0.15394 0.000594 -0.00046 0.000131 -0.00011
PB 16 0.559542 -1.16024 0.216547 -0.00041 0.000477 -0.00019 0.00016
PB 17 0.961647 -2.63426 0.499868 -0.00071 0.000821 -0.00043 0.000367
PB 18 1.169124 -4.21451 0.829438 -0.00086 0.000999 -0.00071 0.000607
PB 19 0.829438 -4.21451 1.169124 -0.00061 0.000709 -0.00100 0.000859
PB 20 0.499868 -2.63426 0.961647 -0.00037 0.000427 -0.00082 0.000709
PB 21 0.216547 -1.16024 0.559542 -0.00016 0.000185 -0.00048 0.000414
PB 22 -0.15394 0.826777 -0.78165 0.000114 -0.00013 0.000464 -0.00059
PB 23 -0.20922 1.123052 -1.38937 0.000154 -0.00018 0.000632 -0.00119
PB 24 -0.15527 0.832477 -1.14703 0.000113 -0.00013 0.00047 -0.00141
PB 25 -0.38234 0.277492 -0.05176 0.00047 -0.00016 0.000044 -3.8E-05
PB 26 -0.46312 0.374351 -0.06974 0.000396 -0.00021 0.00006 -5.1E-05
PB 27 -0.26055 0.275592 -0.05131 0.000198 -0.00016 0.000044 -3.8E-05
PB 28 1.865141 -3.86747 0.721824 -0.00138 0.001591 -0.00062 0.000533
PB 29 3.205491 -8.78088 1.666228 -0.00236 0.002737 -0.00142 0.001224
PB 30 0.389708 -1.40484 0.276479 -0.00029 0.000333 -0.00024 0.000202
PB 31 0.276479 -1.40484 0.389708 -0.00012 0.000236 -0.00033 0.000286
PB 32 0.166623 -0.87809 0.320549 -0.00020 0.000142 -0.00027 0.000236
PB 33 0.072182 -0.38675 0.186514 -5.3E-05 0.000062 -0.00016 0.000138
PB 34 -0.02952 0.158584 -0.12809 0.000022 -2.5E-05 0.000089 -9.5E-05
PB 35 -0.06974 0.374351 -0.46312 0.000051 -0.00006 0.000211 -0.00040
PB 36 -0.05176 0.277492 -0.38234 0.000038 -4.4E-05 0.000157 -0.00047
ISSN(Online): 2319-8753 ISSN (Print): 2347-6710
I
nternational
J
ournal of
I
nnovative
R
esearch in
S
cience,
E
ngineering and
T
echnology
(A High Impact Factor, Monthly, Peer Reviewed Journal)
Visit: www.ijirset.com Vol. 8, Issue 10, October 2019
y = β0 + β1x1 + β2x2 +···+ βkxk
The general equation of quadratic multiple regression follows the formula below.
𝑦 = 𝛽0+ 𝛽1𝑥1+ 𝛽2𝑥2+ 𝛽3𝑥1𝑥2+ 𝛽4𝑥12+ 𝛽5𝑥22
To obtain satisfactory results, the elasticity lines obtained from the structure analysis of two dimensions are grouped according to their shape.
In elasticity line of group I, A-B and C-D span curve are below the structure line. Figure 4. shows the group I.
Figure 4. Shape of group I elasticity line
In elasticity line of group II, A-B and C-D span curve are above the structure line. The shape of group II presented below.
Figure 5. Shape of group II elasticity line
In multiple regression analysis, deflection () is treated as dependent variable and rotation () is as independent variable. The followings are equation which show relationship between deflection and rotation, resulting from regression analysis (Eq 1 – Eq 4). This paper only shows the result for deflection in span B-C (2) and group I.
Linear deflection – rotation equation by using two rotation data
𝛿2(2)= 0.0056 − 1385.27∅𝐵+ 1385.37∅𝐶
(Eq. 1)
Linear deflection – rotation equation by using four rotation data
𝛿2(4)= 0.014 − 404.37∅𝐴+ 1355.08∅𝐵+ 132.414∅𝐶+ 1.092∅𝐷
(Eq. 2)
Quadratic deflection – rotation equation by using two rotation data
𝛿2(2)= −0.00083 − 1385.62∅𝐵+ 1386.02∅𝐶+ 17797935∅𝐵∅𝐶+ 4664245∅𝐵2 + 4664071∅𝐶2 (Eq. 3)
Quadratic deflection – rotation equation by using four rotation data
𝛿2(4)= 0.00016 − 5.40∅𝐴− 1391.51∅𝐵+ 1392.50∅𝐶+ 5.75∅𝐷+ 1267614∅𝐴∅𝐵+ 4871375∅𝐴∅𝐶+
353757∅𝐴∅𝐷+ 18378033∅𝐵∅𝐶+4830413∅𝐵∅𝐷+ 1245808∅𝑐∅𝐷− 2291.71∅𝐴2+ 3778053∅𝐵2 + 3765996∅𝐶2−
3058.40∅𝐷2 (Eq. 4)
ISSN(Online): 2319-8753 ISSN (Print): 2347-6710
I
nternational
J
ournal of
I
nnovative
R
esearch in
S
cience,
E
ngineering and
T
echnology
(A High Impact Factor, Monthly, Peer Reviewed Journal)
Visit: www.ijirset.com Vol. 8, Issue 10, October 2019
The comparison by using two data rotation is shown in Table 2.
Table 2. Comparison of FEM deflection with deflection of the regression equation linear and quadratic, 2 data rotation, span B-C (2 (2)), group I
While the comparison by using four data rotation is shown in Table 3.
Table 3. Comparison of FEM deflection with deflection of the regression equation linear and quadratic, 4 data rotation, span B-C (2 (4)), group I
Regresi FEM-Reg Regresi FEM-Reg (FEM-Reg)/FEM
PB 1 1.387462 1.3916483 0.0041863 1.387518 5.60852E-05
PB 2 1.871753 1.8709586 0.0007944 1.872314 0.000560946
PB 3 1.377962 1.3750248 0.0029372 1.376246 0.001716063
PB 10 1.377962 1.3750806 0.0028814 1.376374 0.001588348
PB 11 1.871753 1.8710345 0.0007185 1.872441 0.000687577
PB 12 1.387462 1.3917047 0.0042427 1.387646 0.0001840
PB 13 0.832477 0.8347617 0.0022847 0.835033 0.002555764
PB 14 0.374351 0.3748454 0.0004944 0.373819 0.0005320
PB 15 0.826777 0.8236793 0.0030977 0.826065 0.00071179
PB 22 0.826777 0.8237128 0.0030642 0.826165 0.000612062
PB 23 1.123052 1.1229476 0.0001044 1.12210 0.000951485
PB 24 0.832477 0.8347956 0.0023186 0.835133 0.00265622
PB 25 0.277492 0.277875 0.000383 0.278744 0.001252312
PB 26 0.374351 0.3748454 0.0004944 0.373819 0.0005320
PB 27 0.275592 0.2751045 0.0004875 0.274629 0.00096319
PB 34 0.158584 0.1573613 0.0012227 0.157422 0.00116174
PB 35 0.374351 0.3748606 0.000510 0.373873 0.000478221
PB 36 0.277492 0.2778864 0.0003944 0.278786 0.001293913
0.001701 0.0010274 unit: cm 0.14% 0.77% 0.18% 0.13% 0.22% 0.37% 0.37% 0.01% 0.28% (FEM-Reg)/FEM Average 0.30% 0.04% 0.21% 0.21% 0.14% 0.14% 0.04% 0.31% 0.27% Linear 0.13% 0.0% 0.0% 0.3% 0.5% 0.1% 0.3% 0.7% 0.1% 0.5% 0.20% Quadratic 0.1% 0.1% 0.0% 0.0% 0.3% 0.1% 0.1% 0.1% 0.1% Load
Post (PB) FEM
Regresi FEM-Reg Regresi FEM-Reg (FEM-Reg)/FEM
PB 1 1.387462 1.387461 1.023E-06 1.387472 9.67E-06
PB 2 1.871753 1.871780 2.673E-05 1.871754 1.0074E-06
PB 3 1.377962 1.3782494 0.0002874 1.377969 7.2358E-06
PB 10 1.377962 1.3782836 0.0003216 1.377946 1.60E-05
PB 11 1.871753 1.8717909 3.791E-05 1.871752 8.7061E-07
PB 12 1.387462 1.387420 4.167E-05 1.387477 1.5077E-05
PB 13 0.832477 0.8323148 0.0001622 0.832443 3.3795E-05
PB 14 0.374351 0.3751583 0.0008073 0.374338 1.2687E-05
PB 15 0.826777 0.8256752 0.0011018 0.82675 2.7125E-05
PB 22 0.826777 0.8256957 0.0010813 0.826829 5.1714E-05
PB 23 1.123052 1.123473 0.000421 1.123051 1.0562E-06
PB 24 0.832477 0.832290 0.0001866 0.83243 4.7334E-05
PB 25 0.277492 0.2771741 0.0003179 0.277555 6.2824E-05
PB 26 0.374351 0.3751583 0.0008073 0.374338 1.2687E-05
PB 27 0.275592 0.2758909 0.0002989 0.275655 6.2756E-05
PB 34 0.158584 0.1579846 0.0005994 0.158455 0.00012859
PB 35 0.374351 0.3751606 0.000810 0.374367 1.6325E-05
PB 36 0.277492 0.2771661 0.0003259 0.277545 5.3493E-05
0.00% 0.00% 0.02% 0.12% 0.22% 0.38% 0.11% 0.22% 0.02% 0.00% 0.11% 0.02% 0.04% 0.13% 0.00% 0.02% 0.22% 0.13% 0.00% 0.01% 0.02% 0.00% 0.00% Load
Post (PB) FEM
ISSN(Online): 2319-8753 ISSN (Print): 2347-6710
I
nternational
J
ournal of
I
nnovative
R
esearch in
S
cience,
E
ngineering and
T
echnology
(A High Impact Factor, Monthly, Peer Reviewed Journal)
Visit: www.ijirset.com Vol. 8, Issue 10, October 2019
In Table 2, the average difference of the quadratic regression equation is 0.20%, smaller than the linear regression (0.22%). In Table 3, it is shown the average difference of the quadratic regression equation is 0.01%, while the average difference of linear equation is 0.1%.
We can also summerize that the accuracy by using four data rotation is higher than two data rotation.
V. CONCLUSION
In the preparation of the deflection - rotation regression equation modeling two-dimensional structures, in order to obtain accurate results, the data must be grouped according to the shape of the elasticity line. Others, the deflection equation - quadratic rotation from two-dimensional structure modeling gives more accurate results than the linear deflection - rotation equation. Finally, the use of rotational data with four data rotation (4 tiltmeter) from two-dimensional structural modeling gives more accurate results than rotational data with two data rotation (2 tiltmeter). Author strongly recommends to verify this result againts three dimension structure analysis.
REFERENCES
[1] Brownjohn, J.,M.,W., “Structural Health Monitoring of Civil Structures”, Philosophical Transactions Royal Society A, published online on 13 Desember 2006.
[2] Hou, X., Yang, X. and Huang, Q., “Using Inclinometers to Measure Bridge Deflection, Journal of Bridge Engineering”, ©ASCE, September, pp.1, 2005
[3] Nugraha, Widi, “Evaluation of Fatigue Life of Steel Elements of Composite Type Standard Bridges Using WIM Data”, Pusjatan Journal, The Republic of Indonesia, Ministry of Public Works and Public Housing, Research and Development Center, Road and Bridge Research and Development Center, Vol.34, Issue:1, pp.1, 2017
[4] Ozakgul, K., Caglayan, O., Uzgider, E., “Load Testing of Bridges Using Tiltmeters”, Proceedings of the SEM Annual Conference June 1-4, 2009 Albuquerque New Mexico USA ©2009 Society for Experimental Mechanics Inc., pp.1, 2009