741
Considering Gender and Socio-economic Factors as determinants of Students’ Enrolment in Regular and Parallel Undergraduate Study Platforms: A case of Public Universities in Kenya.
Mary Akinyi Otieno (PhD)
Lecturer, Department of Educational Management, Policy and Curriculum Studies, School of Education, Kenyatta University,
Email: [email protected]; [email protected] Benjamin Bizimana
PhD candidate in Educational Planning, Kenyatta University, Email: [email protected]
Irénée Ndayambaje
Assistant Lecturer, University of Rwanda-College of Education & PhD candidate in Educational Planning, Kenyatta University,
Email: [email protected]
Abstract
The ultimate goal of this study was to find out the extent to which the students’ enrolment in regular and parallel undergraduate study platforms are influenced by gender and socio-economic factors. The study has used secondary data collected from the admission records of University of Nairobi (UoN), Kenyatta University (KU) and Moi University (MU). In addition, primary data were collected from students and lecturers from the three public universities (KU, MOI and UoN), as well as education experts and policy makers. The analysis was mainly based on a comparative assessment of student gender disaggregated distribution trend data of the academic year period 2001/2002 to 2004/2005. The findings have revealed that although considerable efforts have been made toward gender equity; still women do suffer from a relatively under representation in public higher education in Kenya. Indeed, the findings have shown that students’ socio-economic status (SES) constitutes a significant determinant to the students’ enrolment; whereby few candidates from middle and high income families are enrolled for MII also known as Private/Parallel/self-sponsored programmes. Therefore, the study recommends that the Governments draw mechanisms that would alleviate gender and social-economical factors as barriers to access to higher education. Based on the findings of this study, researchers suggest that further studies should seek to establish how gender and socio-economical backgrounds affect the performance of enrolled students.
742 1. Introduction
1.1 Background of the study
Formal education has been testified as a bridge towards human resource development and social transformation (Milana, 2001). However, it is a fact that people’s aspirations and ability to undertake further levels of education are sometimes limited by gender and social economic status.
On the American continent, the research findings in Canada as established by Oxman-Martinez and Ri Choi (2014) testified that poor educational outcomes were mostly registered for immigrant children who do suffer from social-psychological inclusion and relatively low economical status. Indeed, in Canada it was found out that gender had a significant influence not only to the students’ aspirations to the kind and level of education but also to their educational achievement as they progress (Shapka, Domene & Keating, 2012).
Truly, gender and socio-economical factors has a big impact on people’s education attainments. In this regards, the study carried on in Mexico by Gonzalez, Stein and Huq (2013) has revealed that in addition to perceptions, Latin Mexico adolescents’ education was hampered much by cultural identity variables. Similarly, in Europe, Klasen (1999) has shown that social exclusion remain a barrier to education and hence a policy issue to be discussed and sorted out in organization for Economic Co-operation and Development (OECD) countries.
Coming to South Asia region; Chitrakar (2009) has scientifically instituted the existence of a relationship between gender and the educational achievement. Hence, this study has provided a numbers of recommended per country specificities majorly focusing on how to encourage girls to realize new possibilities and aspirations, implement the incentive schemes for girls and increase the general population literature level. In the particular case of Afghanistan, a study conducted in Southern Punjab by Sattar, Yasin and Afzal (2011) has depicted that the major blockades to education were limited family earnings, low parental. Hence, the study recommends elimination of gender role stereotypes and Changes in Policy making and policy implementation among others. Furthermore, as far as socio-economical factors are also concerned, a study conducted by James (2002) has confirmed the existence of imbalances in higher education participation rates based on community groups and socioeconomic backgrounds. This joins the conclusion by the UNICEF (2008)’s report on Africa whereby socio-economic and cultural factors such as culture, attitude and tradition were clearly highlighted as barriers to schooling in Southern Sudan. It is on the basis of this that the study recommends a number of actions based on community engagement in education issues if girls are to get equal chances to education as it is the case for their counterparts, boys.
743 1.2 The purpose of the study
The purpose of this paper was to establish differences in student enrolment across regular and parallel undergraduate study platforms by gender and socio-economic background in three public universities in Kenya.
1.3 Research hypotheses
Ho: There is no statistically significant different in mean gender enrolments between regular and parallel undergraduate study platforms in public universities in Kenya.
H1: There is a statistically significant relationship between socio-economic background and students’ enrolment in regular and parallel undergraduate study platforms in public universities in Kenya.
2. Review of related literature 2.1 Trends in gender and education
In different times and in different contexts, researchers have come to realize that gender constitute a determinant to the educational goals’ fulfillment. It is even the reason why the global organization such as UNESCO and UNICEF have not ceased to recall the governments to ensure that they are providing equal chances between girls and boys on education and employment (Lynch & Feeley, 2009).
Nevertheless, despite the fact that gender is a roadblock to education in many societies and efforts have been converged towards its eradication, much is yet to be achieved (Kupczynski, Brown, Holland & Uriegas, 2014). That is why apart from the general population sensitization and educational stakeholders’ intervention, much is expected from educational policy making and enforcement to alleviate gender related hindrance to education (Stromquist, 2013).
2.2. Poverty as a barrier to educational attainment
Despite the governmental and international efforts to alleviate poverty; it is a reality that some societies and people are still under the poverty line. As a result, affording educational services is rarely a fulfilled dream. It is in this line that UNESCO has been advocating for Education For All (EFA) since the year 1990 by alleviating all barriers to education-including fees- a target being achieved in basic education (UNESCO, 2013) but far to reach the higher level of education.
The fact that poverty still remains a hindrance to education was documented by Kena, et al. (2014) whose findings revealed that endemic poverty coupled with unemployment as giving root to the experienced drop out cases in schools. This is again enforced by Ashtiani and Feliciano (2012) who have indicated that young adults from low-income families continue to face barriers of accessing college or completing their programme.
2.3 Social-cultural factors and their impacts on education
744 Anthony (2011) have declared that the poor quality of girls’ education was much related to traditional rules, poor women-based consideration and opinions. Indeed, factors such as parents’ education, leaving area, age and language were also found to have an influence on the type, duration and investment in their kids’ education (Malmberg & Sumra, 2001).
3. Methodology 3.1 Research design
This study used a descriptive research survey (Orodho, 2009) to investigate into the equity dimensions in parallel and regular undergraduate degree platforms in public universities in Kenya. The key variables for this study were; students enrolment, student‘s socio-economic status, gender equity and degree programme. The research design allowed for both vertical and horizontal analysis across all the variables and other additional analyses that were of benefit and interest to the study. Descriptive survey was deemed appropriate for the study for the fact that its purpose and objective fell within the research design model. Further, descriptive research design used in this paper included facts, current conditions concerning the nature of students including a number of objects or class of events.
3.2 Target population
Originally, this study intended to target six public universities in Kenya namely Nairobi, Kenyatta, Moi, Egerton, Jomo Kenyatta and Maseno. Additionally, academic and administrative staff in the respective public universities were also part of the target population. Policy makers namely: the Ministry of Education (MoE), Commission of Higher Education (CHE) and Joint Admissions Board (JAB) and education experts from World Bank, Ford Foundation, Rockefeller, IPAR and KIPPRA were also included in the target population. Students and university staff (academic and administrative) were the key participants in the study since they are directly involved in the parallel and regular degree platforms as consumers, education providers and also as institutional managers at different levels of operation.
However, for convenience reasons (Orodho, 2009), out of the six public universities in Kenya, three Universities were targeted and therefore participated in the study. These are University of Nairobi in Nairobi County, Kenyatta University on the boundary of Kiambu County and Nairobi County and Moi University in Uasin Gishu. All the three public universities admit students on both parallel and regular platforms and conduct undergraduate degree programmes, which were the two main focus of this study.
745 3.3 Sample size and sampling techniques
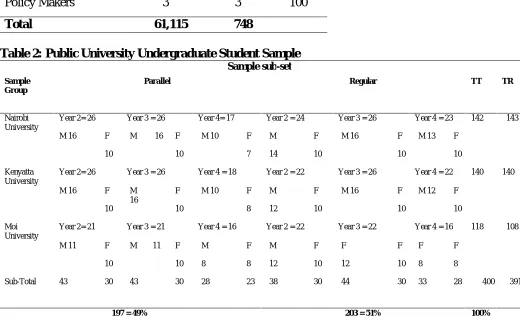
Systematic random sampling technique was used in this study (Mugenda & Mugenda, 2003) to select both university students, academic and administrative staff separately by population subset. The desired sample size for university students was 400, university administrative staff was 40 and academic staff was 300. Systematic random sampling (Padilla, 2009) was used in this study since it ensured a fair representation of the university student by gender, year of study and platform.
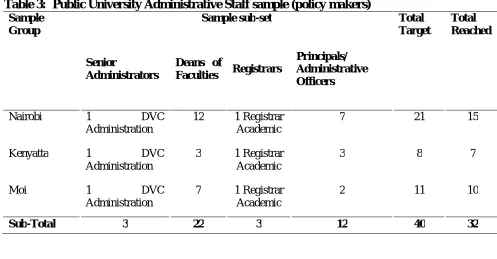
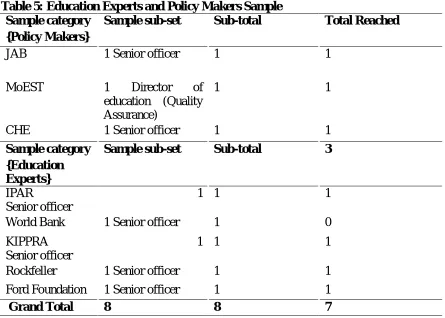
Purposive sampling technique was also used (Tongco, 2007) to select education experts and policy makers. Tables 1, 2, 3, 4 and 5 respectively outline the breakdown of the sample size into the relevant quotas for all the respondent groups that were involved in the study and their response rate.
Table 1: Population distribution and sample size Category of
respondents
Population Sample Size %
Students 58,017 400 1
Academic Staff 3,000 300 10
Administrative Staff 90 40 36
Education Experts 5 5 100
Policy Makers 3 3 100
Total 61,115 748
Table 2: Public University Undergraduate Student Sample
Sample sub-set
Sample Group
Parallel Regular TT TR
Nairobi University
Year 2= 26 Year 3 = 26 Year 4= 17 Year 2 = 24 Year 3 = 26 Year 4 = 23 142 143
M 16 F M 16 F M 10 F M F M 16 F M 13 F
10 10 7 14 10 10 10
Kenyatta University
Year 2= 26 Year 3 = 26 Year 4 = 18 Year 2 = 22 Year 3 = 26 Year 4 = 22 140 140
M 16 F M 16
F M 10 F M F M 16 F M 12 F
10 10 8 12 10 10 10
Moi University
Year 2= 21 Year 3 = 21 Year 4 = 16 Year 2 = 22 Year 3 = 22 Year 4 = 16 118 108
M 11 F M 11 F M F M F F F F F
10 10 8 8 12 10 12 10 8 8
Sub-Total 43 30 43 30 28 23 38 30 44 30 33 28 400 391
197 = 49% 203 = 51% 100%
M = Male; F = Female
746 Table 3: Public University Administrative Staff sample (policy makers)
Sample Group
Sample sub-set Total
Target
Total Reached
Senior
Administrators
Deans of
Faculties Registrars
Principals/ Administrative Officers
Nairobi 1 DVC
Administration
12 1 Registrar Academic
7 21 15
Kenyatta 1 DVC
Administration
3 1 Registrar Academic
3 8 7
Moi 1 DVC
Administration
7 1 Registrar Academic
2 11 10
Sub-Total 3 22 3 12 40 32
Table 4: Public University Academic Staff Sample
University Target
Target
Return Professors Associate
Professors
Senior Lecturers
Lecturers Tutorial Fellows
Total Total Target Reached
UoN 6 8 22 64 20 120 116
KU 6 8 18 36 16 84 65
Moi 6 8 14 56 12 96 90
747 Table 5: Education Experts and Policy Makers Sample
Sample category Sample sub-set Sub-total Total Reached {Policy Makers}
JAB 1 Senior officer 1 1
MoEST 1 Director of
education (Quality Assurance)
1 1
CHE 1 Senior officer 1 1
Sample category Sample sub-set Sub-total 3
{Education Experts}
IPAR 1 Senior officer
1 1
World Bank 1 Senior officer 1 0
KIPPRA 1 Senior officer
1 1
Rockfeller 1 Senior officer 1 1
Ford Foundation 1 Senior officer 1 1
Grand Total 8 8 7
3.4 Research Instruments
In this study, information was collected from students and lecturers from the three public universities (KU, MOI and UoN), as well as education experts and policy makers. Hence, four research instruments were developed for the study; namely two questionnaires, document analysis guide and one interview schedule. They included: university student questionnaire, university academic staff questionnaire and interview schedule for policy makers and education experts (including university administrators).
3.5 Method of Data Analysis and Presentation
Data analysis for this study was done both quantitatively and qualitatively. The process of data preparation and analysis is herby outlined: Validation, editing, coding and analysis. The method of analysis was based on the type of data that was collected, mainly primary and also secondary data. The independent T-test, the Pearson Product Moment Correlation Coefficient and Chi-square statistics were used to test the hypotheses (Christensen & Stoup, 1991).
5. Discussion
5.1 Differences in student enrolment in regular and parallel undergraduate study platforms by gender and socio-economic background
748 Module II platform compared to the Module I platform; where 155 (74%) reported coming from the same family backgrounds.
Furthermore, while only 11 (6%) of MII students reported coming from low (SES) families, up to one in every four MI students 54 (26%) reported having emanated from similar family backgrounds. Additionally, Chi-square tests results at > 0.05 significance level shows that male and female student participation in the two platforms by family SES backgrounds differed significantly with students from middle and high socio-economic backgrounds dominating positions in both platforms across the gender divide.
5.2 Differences in proportion of regular and parallel undergraduate students across public universities
Data on gender desegregated enrolment have indicated the existence on a trend in gender enrolment proportions by institution. While MI female participation in KU has remained around the 2,887 (40%) mark, MII female student population continues to oscillate around the 1963 (20%) mark. In the case of Moi University, overall gender enrolment proportions have remained largely constant in the MI platform among female students at 2019 (43%), while there has been an upward trend in female student enrolments from 690 (33%) in 2001/2002 academic year to (2019) 45% by the 2004/2005 academic year on the MII platform. The UoN figures indicate that female proportions in MII programmes have remained significantly higher than those in MI.
Again, data on total enrolment as per the academic year 2004/2005 for the three universities that participated in the study point out significant differences that have occurred between the parallel and regular platforms. In University of Nairobi, enrolment of students in the parallel platform were more by about 2,500 students than that of regular in 04/05 academic year. On the other hand, while Kenyatta University had a fairly close enrolment between the two platforms, with total regular platform enrolment of 7,200 students and parallel with 8,855 students, parallel enrolment was still more with 1,655 students. However, Moi University, in the same academic year had 2,988 more students in regular than parallel students.
The scenario above shows clearly that Nairobi and Kenyatta Universities depicted a similar trend in increased enrolment in 2004/05, indicating some growth in parallel platform enrolment while Moi University stagnated. Such a confirmation of increasing trend in enrolment was also ascertained by Kiamba (2003) who revealed that UoN had shown tremendous increase in enrolment as well as income from the parallel platform.
Truly, the fact is that UoN attracts more parallel students is more a result of location and nearness to transport services coupled with certain courses popularly known with it as medicine, engineering, architecture and alike. Moi University is favoured by regular students due to some of the unique and popular programmes it has introduced such as health sciences, environmental studies among others. Kenyatta University is viewed as an average university in terms of programmes offered, both in regular and parallel and the more reason why the difference in enrolment was not wide across the platforms.
749 5.3 Gender and socio-economic background as determinants to undergraduate study platform The findings of this study have lead to establish a link between gender and socio-economic background as factors that determine the enrolment to undergraduate study platform. As evidence to that, researchers have observed a tendency for female students to prefer more MII programmes offered at UoN. One of the reasons was again that UoN is located downtown and hence such a location coupled with easy access and low transport charges that attract the majority of the urban female students who did not qualify for MI positions and wish to enroll for degree programmes. While there was a significant difference in the status of preference for current degree programmes undertaken by the female students; with the proportion of female students reporting placement in preferred programme increasing with the family SES, there was no significant difference in the proportion of male students reporting placement in preferred degree programmes by family SES. This suggests that most male students were probably equally ambitious (to want to join competitive programmes) regardless of their family backgrounds. However, the fact that even among male students from low SES 17 (16%) compared to 14 (12.7%) of females reported preference of the programmes they were undertaking is further confirmation that more male students perform better in their Kenya Certificate of Secondary Education (K.C.S.E) examination compared to their female counterparts, hence getting placed into programmes of choice that are probably competitive.
Specifically, based on particular undergraduate degree programmes, preference was also evident in enrolment of the female students. It also shows that the widest gender disparities have been in Science, Mathematics and Technology (SMT) related programmes where female enrolment was lower, 12.5 per cent in engineering and architecture; 12.6 per cent in agriculture and veterinary medicine; 14.1 per cent in natural sciences and 19.7 per cent in medicine and pharmacy, whereas their male counterparts registered 87.5%, 87.4%, 85.9% and 80.3% in the same programmes respectively (Kilemi and Njuguna, 2002).
Therefore, female student’s family SES would be used to predict the level of satisfaction with the degree programme pursued; which is quite different for male students. In addition, this study has also revealed that female students shy away from applying for science based degree programmes. This might be linked to the fact that their performance at K.C.S.E is normally uncompetitive; resulting in low numbers registered and thus rendering them low bargaining power to influence their admission in preferred programmes.
6. Conclusion and recommendations
750 Private/Parallel/self-sponsored programmes still sounds as solely dedicated for those students from middle and higher socio-economic backgrounds.
It is on the basis of this fact that this study recommends that the Kenya Government enforce the implementation of Poverty reduction Strategy and the Plan for Economic Recovery. Again, there are still big step to make to alleviate bias and discrimination based on gender towards girls’ educational dreams fulfillment. In addition, based on the findings of this study, researchers suggest that further studies should seek to establish how gender and socio-economical background affect the performance of enrolled students.
References
Anastasia, N. & Teklemariam, A.A. (2011). Socio-Cultural and Economic Factors Affecting Primary Education of Maasai Girls in Loitokitok District, Kenya. The Western Journal of Black Studies , 35 (4).
Arowoshegbe, A. O. & Anthony, E.(2011). Improving the Quality of the Girl-Child Education in Nigeria. Educational Research Quarterly, 34 (4), pp.16-26.
Ashtiani, M. & Feliciano, C. (2012). Low-Income Young Adults Continue to Face Barriers to College Entry and Degree Completion. Research brief (1),
http://pathways.gseis.ucla.edu/publications/201201_ashtianifelicianoRB_online.pdf. Barton, S.M. (2010). Social and Cultural Factors that Influence the Uptake of E-learning: Case
Studies in Malaysia, Indonesia, Turkey, Singapore and Australia. Unpublished PhD Thesis, RMIT University.
Chitrakar, R. (2009). Overcoming Barriers to Girls’ Education in South ASIA: Deepening the Analysis. Regional Office for South Asia (UNICEF ROSA): United Nations Children’s Fund 2009.
Christensen, L.B. & Stoup, C.M. (1991). Introduction to statistics for the social and behavioral sciences. 2nd Ed., California: Brooks/Cole Publishing Company.
Gonzalez, L. M., Stein, G. L. & Huq, N. (2013). The Influence of Cultural Identity and Perceived Barriers on College-Going Beliefs and Aspirations of Latino Youth in Emerging Immigrant Communities.Hispanic Journal of Behavioral Sciences, 35 (1), pp.103-120.
James, R. (2002). Socioeconomic Background and Higher Education Participation: An analysis of school students’ aspirations and expectations. Centre for the Study of Higher Education,The University of Melbourne.
Kiamba, C.M. (2003). The Experience of Privately Sponsored Studentship and other income generating activities at the University of Nairobi, (unpublished).
751
Klasen, S. (1999).
Social Exclusion, Children, and Education: Conceptual and
Measurement Issues
. Department of Economics, University of Munich.
Kena, G., Aud, S., Johnson, F., Wang, X.; Zhang, J., Rathbun, A.; Wilkinson-Flicker,S.; Kristapovich, P. (2014). The Condition of Education . National Center for Education Statistics. 256 pp.
Kupczynski, L, Brown, M.,; Holland, G. & Uriegas, B. (2014). The Relationship between Gender and Academic Success Online. Journal of Educators Online, 11 (1), 14 pp.
Lynch, K. & Feeley, M. (2009). Gender and education (and employment), Gendered imperatives and their implications for women and men: lessons from research for policy makers, European Commission.
Milana, M. (2001). “UNESCO, Adult Education and Political Mobilization”. Confero doi: 10.3384/confero.2001-4562.140604a.
Malmberg, L-E. & & Sumra, S. (2001). Socio-cultural Factors and Tanzanian Primary School Students' Achievements and School Experience, UTAFITI , 4, pp.207-219.
Mario, M., Peter F., Lisbeth, L., & Arlindo C. (2003). Higher Education in Mozambique. London: Oxford.
Mbemba, F.M. (2003). Restore, Reform but do not transform: The Gender Politics of Higher Education in Africa, Cape Town.
Mugenda, O.M. & Mugenda, A.G. (2003). Research Methods: Quantitative and Qualitative Approaches. Nairobi: African Centre for Technology Studies (ACTS).
Opini, B. (2012). Barriers to Participation of Women Students with Disabilities in University Education in Kenya. Journal of Postsecondary Education and Disability, 25 (1), pp. 65-79.
Orodho, J. A. (2009). Elements of Education and Social Science Research Methods (2nd Ed.). Maseno: Kanezja Publishers.
Oxman-Martinez, J & Ri Choi, Y. (2014). Newcomer Children: Experiences of Inclusion and Exclusion, and Their Outcomes. Social Inclusion, 2 (4), pp.23-37.
Padilla, A. (2009). An Unbiased Estimator of the Variance of Simple Random Sampling Using Mixed Random-Systematic Sampling, Banco de M∂exico.
Sattar, T., Yasin, G. & Afzal, S. (2011). Socio-Political and Economic Barriers of Development in Education Sector of Southern Punjab (Pakistan). British Journal of Economics, Finance and Management Sciences, 3 (1), pp. 51-71.
Shapka, J. D., Domene, J. F. & Keating, D. P. (2012). Trajectories of Educational Aspirations through High School and beyond: A Gendered Phenomenon? Canadian Journal of Education, 35(1) pp.239-258.
752 Stromquist, N. P. (2013). Education Policies for Gender Equity: Probing into State Responses.
Education Policy Analysis Archives, 21 (65), 31 pp.
Tongco, M. D. C. (2007). Purposive Sampling as a Tool for Informant Selection. Honolulu: University of Hawaï.
UNESCO (2013). Education for All Global Monitoring Report. Policy Paper, http://unesdoc.unesco.org/images/0021/002199/219998E.pdf.
UNESCO (2012). UNESCO Global Partnership for Girls’ and Women’s Education- One Year On. http://www.unesco.org/eri/cp/factsheets_ed/KE_EDFactSheet.pdf.
UNICEF (2008). A Report of the Study on Socio-Economic and Cultural Barriers to Schooling in Southern Sudan: Final Report.
http://www.unicef.org/sudan/SOCIO-ECONOMIC_AND_CULTURAL_BARRIERS_TO_SCHOOLING_IN_SOUTHER N_SUDAN.pdf.
Waweru, J.M. (1982). Socio-Economic Background as an Influence Factor in Pupils' Achievement in Primary Schools in Embu District, Kenya. African Studies in Curriculum