ISSN: 2089-3272, DOI: 10.11591/ijeei.v8i2.1287 419
The Segmentation Analysis of Retinal Image Based on K-means
Algorithm for Computer-Aided Diagnosis of Hypertensive
Retinopathy
Wiharto Wiharto1, Esti Suryani2
1,2Department of Informatics, Universitas Sebelas Maret, Surakarta, Indonesia
Article Info ABSTRACT
Article historys: Received Jan 7, 2020 Revised June 28, 2020 Accepted June 30, 2020
Computer-aided diagnosis of hypertensive retinopathy (CAD-HR) is performed by analyzing the retinal image. The analysis is carried out in several stages, one of which is image segmentation. The segmentation carried out so far generally uses a region-based and threshold-based approach. There is not yet a clustering-based approach, and there has been no previous analysis of why clustering-based is not yet widely used. This study aims to conduct clustering-based Segmentation analysis, specifically k-means clustering in CAD-HR. The research method used is divided into four stages, namely preprocessing, segmentation, feature extraction using fractal dimensions, statistical analysis for classification, and classification. Testing is done using the DRIVE and STARE datasets. The results of statistical tests showed that the number of clusters 3 was able to provide a significant difference between the fractal positive and negative dimensions of hypertensive retinopathy. The model of CAD-RH using the k-means algorithm for segmentation method is able to provide 80% sensitivity performance. The k-mean algorithm can be used as an alternative to segmenting retinal blood vessels.
Keywords: Clustering Segmentation Hypertensive Retinopathy K-mean Diagnosis Computer-aided
Copyright © 2020 Institute of Advanced Engineering and Science. All rights reserved. Corresponding Author:
Wiharto Wiharto,
Department of Informatics, Universitas Sebelas Maret,
Jl. Ir. Sutami, No. 36A. Kentingan, Surakarta, Indonesia Email: [email protected]
1. INTRODUCTION
Image segmentation is an important step in the pattern recognition process, that is, if the segmentation stage has passed, then the next stage can be done in the form of feature extraction. This is also needed in a computer-aided diagnosis (CAD) model of hypertensive retinopathy based on retinal image [1], [2]. Segmentation can be used as a way to analyze retinal images. Image segmentation can be done using several approaches, namely region based, edge-based, threshold and clustering-based [3], [4]. The most widely used approaches are region-based, edge-based and threshold, while clustering is still relatively small. The use of segmentation with relatively little clustering is not supported by adequate reasons and studies, especially for hypertensive retinopathy CAD.
Segmentation by utilizing clustering has been done by several researchers, including by Dhanachandra et al. [5]. The study used k-mean clustering and subtractive clustering for white blood cell segmentation in the diagnosis of leukemia. The clustering method has also been used in retinal blood vessel segmentation, which is done by Mapayi et al. [6]. The study combines k-mean clustering and image difference for segmentation of the retinal eye vessels. A similar study was carried out by a number of researchers, Mapayi et al. [7], Ding et al. [8] and Dey et al. [9]. In this study, the difference is the use of fuzzy c-means algorithms. Research using similar objects has also been carried out by Rashid & Shagufta [10] and Prasad et al. [11]. The research uses a Fuzzy C-mean algorithm to detect exudates and microaneurysms in the retinal image. Another study that uses
clustering-based segmentation is done by Siddiqui & Isa [12], but not in the case of a retinal image, and using the k-means algorithm.
Researches that have been conducted in using clustering-based segmentation are limited to segmenting retinal blood vessels [6]–[9]. The study uses a number of clustering algorithms for segmentation, namely k-mean clustering algorithm [6] and fuzzy c-means [7]–[9]. Referring to the results of the research [6]– [9] shows that the clustering k-means algorithm is able to provide better performance compared to a number of other clustering algorithms for the segmentation process. The clustering algorithm for segmentation was also carried out by Siddiqui & Isa [12] and Dhanachandra et al. [13]. Both studies show that the combination of k-means and subtractive clustering is able to provide improved image quality [13], and in research [12] shows that enhanced moving k-mean, is able to provide better image quality than a number of clustering algorithms, including fuzzy c-mean. Unfortunately in a number of studies using clustering-based segmentation did not analyze the effect of the number of clusters used, besides the use of clustering-based segmentation has never been used in the development of CAD-HR system models [14].
Referring to a number of studies that have been conducted, this study aims to analyze clustering-based segmentation, specifically k-mean clustering in hypertensive retinopathy CAD. The research method used is divided into four stages, namely preprocessing, segmentation, feature extraction using fractal dimensions, statistical analysis for classification, and classification. Pre-processing aims to improve image quality, while feature extraction is done using fractal analysis, which is by calculating fractal dimension values. The results of feature extraction, then performed statistical analysis using significance test. Significance test with a 95% confidence level for each fractal dimension in normal retina and hypertensive retinopathy. The results of the statistical analysis are then used for the classification process. The data used for testing is the DRIVE and STARE datasets.
2. RESEARCH METHOD
2.1. K-means Clustering Algorithm
The clustering is a technique in data mining. Clustering is the process of grouping a data that has the same characteristics into a group, and groups of data with different characteristics to other groups. Clustering has a number of algorithms that can be used, one of which is k-means. The k-means algorithm has the following procedures [6], [13], [15]
a. Determine the number of clusters b. Determine random cluster centers
𝜇1 𝜇2 𝜇3………..𝜇𝑖
c. Determine cluster members by calculating the Euclidean distance for each data to the nearest centroid 𝑑𝑖= 𝑀𝑖𝑛𝑗‖𝑥(𝑖)− 𝜇𝑖‖ (1)
d. Calculate the average of each cluster of data that has been allocated to each cluster
𝜇𝑖= 1 𝑚∑ 𝑥𝑗
𝑚
𝑗=1
(2)
e. Repeat steps (c) and (d), until the cluster center results are not changed. The criteria for this condition can be formulated in the following equation
∑ ∑‖𝑥𝑗− 𝜇𝑖‖ 2 𝑚 𝑗=1 𝑘 𝑖=1 (3)
reach convergent, where 𝑥𝑗∈ 𝑆𝑖 and 𝜇𝑖 is the-i cluster center, from 𝑆𝑖, {1,2,3,4 … … , 𝑘}.
2.2. Dimension Fractal (DF)
Fractal dimensions are a measure of fragmentation of an object [16]. Fractal dimensions can be used to identify the complexity of a fractal, by comparing changes in irregularities in a form when the scale is changed. This study uses fractal dimensions with the box-counting method [17]. Calculation of fractal dimensions with box-counting can be written in the following equation.
𝐷 =log (𝑁(𝑠)) log (1𝑠)
(4)
where 𝑁(𝑠) is the average of the cells visited by the measurement process on a different set of translations on the side of a square cell in a grid.
2.3. Method
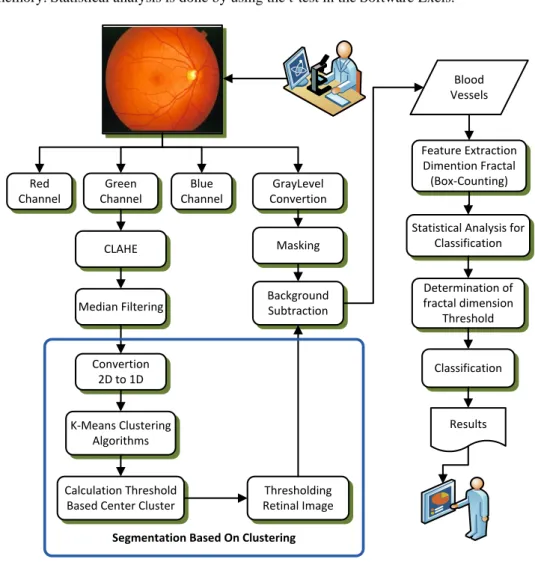
This study conducted a performance analysis of clustering-based segmentation methods in CAD systems. The clustering algorithm used is k-means. The analysis was carried out using the STructured Analysis of the Retina (STARE) [18] and Digital Retinal Images for Vessel Extraction (DRIVE) [19] datasets which can be accessed online. DRIVE dataset is 50, consisting of normal 25 and hypertensive retinopathy 25. STARE dataset is 70, which is distributed to normal 34 and hypertensive retinopathy 36. Retinal data from both datasets are used as system inputs. The system description along with the process stages in the CAD system can be shown in Figure 1. The hypertensive retinopathy CAD model is implemented using the Matlab R2014a software with the Toolbox Image processing. The implementation and testing of the CAD-HR system are done using a computer with an AMD E2-1800 APU processor with Radeon (tm) HD Graphics 1.70 GHz, and with 4 Gbyte memory. Statistical analysis is done by using the t-test in the Software Exels.
Green Channel GrayLevel Convertion Masking CLAHE Median Filtering Convertion 2D to 1D K-Means Clustering Algorithms Calculation Threshold Based Center Cluster
Background Subtraction Blood Vessels Feature Extraction Dimention Fractal (Box-Counting) Results Statistical Analysis for
Classification Thresholding Retinal Image Red Channel Blue Channel
Segmentation Based On Clustering
Determination of fractal dimension
Threshold
Classification
Figure 1. The model system and research method
The CAD system model shown in Figure 1 has a number of stages. Preprocessing stages, the image of the retina from the acquisition using the fundus camera, then divided into 3 channels, namely red, green, and blue channel. The next step is to choose the channel with the best image quality, that the green channel. The next advanced image processing will be carried out on the green channel. Image processing is carried out in order to improve image quality. The repair method is done with Contrast Limited Adaptive Histogram Equalization (CLAHE) and 2D median filters. The result of the repairing quality retina image from
improvisation, then segmentation is performed using the k-means algorithm. Before the clustering process is carried out, first the conversion of data from two dimensions to one dimension. The next step is to do clustering with variations in the number of clusters. The number of clusters tested is 2, 3, 4, 5, 6 and 7. The result of the clustering process is the center of the cluster and the membership of each gray level into the nearest cluster.
The results of the clustering process in the form of a cluster center, then performed calculations to determine the threshold limit. The threshold obtained is used to form a binary retinal image. The threshold determination is done by selecting the average of all cluster centers produced. In the results of the segmentation process with k-mean clustering, it has not produced the same background in all parts, it requires an image subtraction process. Image subtraction is done by using masking images from gray level retinal images. The next step is to do feature extraction using analysis fractals. Fractal analysis is done to calculate fractal dimensions using the box-counting method. Feature extraction results are fractal dimensions of segmented retinal images. Furthermore, the last step is to perform a statistical analysis of the results of feature extraction, namely by testing the significance of the fractal dimension and the number of clusters used in segmentation. The test was to determine differences in fractal dimensions in normal retinal images and hypertensive retinopathy.
The next step after statistical analysis is the classification process. Classification is done referring to the fractal dimension value obtained, taking into account the significance test results. The fractal dimension used is the fractal dimension which has a p-value <0.05. Classification results are determined by comparing the fractal dimension values obtained by the threshold, whose value is mean ± stdv. If it is bigger then it is negative and if smaller it is positive, as shown in equation (5). The performance parameters used are sensitivity and specificity parameters. The developed CAD-HR system was used for initial diagnosis, so that performance parameters emphasized high sensitivity. The values of sensitivity and specificity are calculated by referring to the confusion matrix shown in Table 1, with the formula as shown in equation (6-7).
Result = {Negative, DF > Threshold
Positive, Others (5) Table 1. Confusion Matrix
Actual Class Predictive Class
Positive Negative
Positive TP (True Posiitive) FN (False Negative)
Negative FP (False Positive) TN (True Negative)
TPrate= Sensitivity = TP
TP + FN (6)
TNrate= Specificity = TN
TN + FP (7)
3. RESULTS AND DISCUSSION
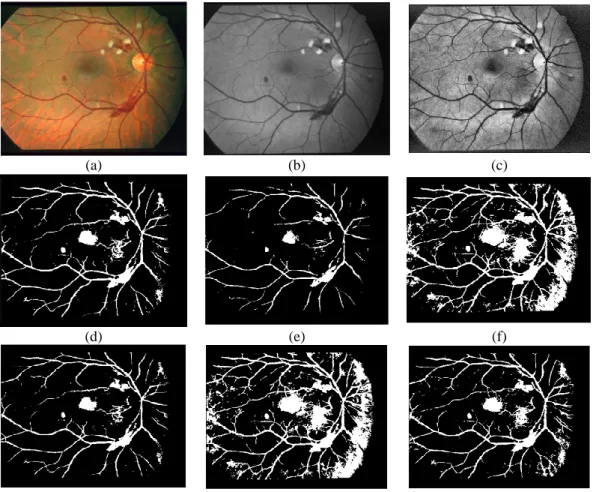
The research on retinal image segmentation analysis based on clustering with the k-mean algorithm produces a number of outputs. The research output is presented in two models, namely the output image for each stage of the study and the final output in the form of fractal dimension data with a variable number of clusters. The results of the research are in the form of images as shown in Figure 2. In Figure 2 it is divided into 9 images, Figure 2(a) shows the retinal image that is the CAD input system. The result of the separation process of the three channel retinal images, shown in section Figure 2(b) is the green channel, then Figure 2(c) is the retinal image of the improved results using a combination of CLAHE [20] and median filter [1]. In part Figure 2(d-i) is a clustering-based segmentation output with the number of clusters 2, 3, 4, 5, 6 and 7. The resulting retinal image is a retinal blood vessel. The blood vessel pattern is then analyzed using fractal analysis to determine the fractal dimensions. The results of the second study were, in the form of significance test results with a 95% confidence level of normal fractal dimensions and hypertensive retinopathy, both for the number of clusters 2 to 7. The results of the significance tests were shown in Table 2. The tests were carried out using two DRIVE datasets and STARE.
Retina based clustering image segmentation using the k-means algorithm is able to segment blood vessels as shown in Figure 2(d). Significant test results are shown in Table 2 which show that fractal dimensions for normal retina and hypertensive retinopathy have different mean ± stdv values for all variations in the number of clusters. In the DRIVE dataset when the number of clusters 3 and 5, the resulting fractal dimension
values showed a significant difference between positive and negative hypertensive retinopathy. The significant difference is indicated by the p-value <0.05. This difference is in accordance with the research conducted by Wiharto et al. [21]. In this study using segmentation with a threshold approach, and a DRIVE dataset. Segmentation with the threshold approach was also carried out by Syahputra et al. [22]. The study also used fractal dimensions for feature extraction, unfortunately, in the study, no significance testing was done for differences in normal fractal dimensions and hypertensive retinopathy. The study immediately classified the probabilistic neural network, and also did not show the fractal dimension values produced for normal conditions and retention of hypertension.
(a) (b) (c)
(d) (e) (f)
(g) (h) (i)
Figure 2. The results of retinal image segmentation with the k-mean algorithm
Further comparison with the research conducted by Popovic et al. [23]. In this study, unfortunately, uses manual segmentation, and furthermore, the feature extraction uses fractal and lacunarity dimensions. The resulting fractal dimension also shows the difference between normal and hypertensive retinopathy, where the average fractal dimension for normal conditions is higher than hypertensive retinopathy. Cavallari et al. [24] also used fractal dimensions to determine hypertensive retinopathy or not, unfortunately in the study did not explain explicitly about the method of segmentation of blood vessels. The results of fractal dimension calculations performed showed that when hypertensive retinopathy the fractal dimension values 1.41 ± 0.04, whereas for normal (control) 1.45 ± 0.04. These results indicate that in this study the results of relative fractal dimensions are the same as the fractal dimensions of the results of segmentation using k-mean clustering.
A number of other studies related to the use of fractal dimensions which do not mention the segmentation methods and approaches used, but in this study using existing application software. This research such as conducted by Zhu et al. [25] and Aliahmad et al. [26]. In the study of Zhu et al. [25] explained the relationship between fractal dimensions of retinal blood vessels with cardiovascular disease. Aliahmadi et al. [26] explained the relationship between fractal dimensions of retinal blood vessels to predict the incidence of stroke. Referring to a number of studies that have been conducted show that the fractal dimensions for normal are greater than the dimensions of fractal hypertension retinopathy. This is in line with fractal dimensions resulting from retinal image segmentation with a k-means clustering algorithm.
The last process is classification. The classification results are carried out using the fractal dimension threshold whose value is mean-stdv. The selection of the threshold value is done by three trials of threshold values, namely, mean+stdv, mean, and mean-stdv. The results of these experiments show mean-stdv values are able to provide better performance. Referring to the mean-stdv threshold dimensions of fractal dimensions, and using equation (5), the results of testing the CAD-HR system are able to provide the performance shown in Table 3. The results show for the DRIVE dataset with cluster 3, capable of delivering performance best with reference to the sensitivity parameter. Sensitivity values indicate the ability of the CAD-HR system to detect patients when they are positive, by a positive system detected 80%. The CAD-HR system is used for initial diagnosis by referring to changes in the pattern of retinal vessels, as measured by the fractal dimension, so that the performance parameters that are preferred are sensitivity[27], [28].
Table 2. Statistical analysis of fractal dimensions in clustering-based image segmentation
Dataset The Number of Clusters
Fractal Dimension P-value Normal HR Mean Stdv Mean Stdv DRIVE 2 1.5023 0.0145 1.4505 0.0227 0.2341 3 1.4118 0.0478 1.2946 0.0452 0.0431 4 1.6121 0.0086 1.6036 0.0121 0.7801 5 1.5617 0.0286 1.4351 0.0381 0.0386 6 1.6174 0.0056 1.6181 0.0047 0.9757 7 1.6146 0.0153 1.5479 0.0248 0.1181 STARE 2 1.4973 0.0110 1.4795 0.0186 0.5240 3 1.3623 0.0457 1.3432 0.0511 0.7044 4 1.6000 0.0113 1.5900 0.0206 0.7198 5 1.5336 0.0251 1.4891 0.0381 0.3116 6 1.6132 0.0063 1.6106 0.0079 0.8950 7 1.5844 0.0187 1.5378 0.0243 0.1523
The CAD-HR system that has been carried out mostly uses a number of features, such as research conducted by Wiharto et al. [21]. The study uses two features, namely dimensions of fractal and lacunarity, and uses the random forest classification algorithm. This combination makes the system perform better. If it only refers to one feature, namely the fractal dimension, the performance produced is relatively the same as the proposed CAD-HR system. Another study was also conducted by Syahputra et al. [22], the study not only used the fractal dimension but was added with invariant features and also used probabilistic neural network classification algorithms. The use of a number of features and using classification algorithms or data mining techniques in a number of previous studies shows that the proposed research has relatively the same performance. This is because the proposed system only uses the fractal dimension threshold, and uses the equation (5), but is able to produce sensitivity with a value reaching 80%. It also shows that k-means segmentation can be an alternative to segmenting blood vessels, which is then analyzed by the fractal dimension.
Table 3. Results of testing the CAD-HR system
Dataset The Number of Clusters Sensitivity(%) Specificity(%)
DRIVE 3 80.000 44.000
5 76.000 44.000
STARE 5 61.760 55.560
7 64.710 38.890
4. CONCLUSION
The results of retinal image segmentation analysis using mean clustering algorithm show that the k-mean clustering method can be used for retinal blood vessel segmentation. This is shown by the feature extraction results in the form of fractal dimensions showing significant differences between normal and hypertensive retinopathy. The number of clusters used in the segmentation process also influences fractal dimension values. The number of clusters that give the best results is the number of clusters 3 for the DRIVE dataset, while STARE is relatively the same. These results indicate that clustering-based segmentation also provides performance that is not inferior to a number of segmentation methods that are widely used so far. This
is indicated by the performance of the CAD-HR system by only using the fractal dimension value which is able to provide sensitivity reaching 80%. Suggestions for development are by combining k-mean segmentation with other methods, and using a number of features, so that it can improve system performance.
ACKNOWLEDGMENTS
We would like to thank the Sebelas Maret University Indonesia, which has provided research grants of fundamentals with funding PNBP UNS, by contract number: 543/UN27.21/PP/2018. The authors thank the anonymous referees for their constructive suggestions and comments which helped in the improvement of the presentation of the manuscript.
REFERENCES
[1] K. Noronha, K. T. Navya, and K. P. Nayak, “Support system for the automated detection of hypertensive retinopathy using fundus images,” in International Conference on Electronic Design and Signal Processing (ICEDSP), Manipal, India, 2012, pp. 7–11.
[2] S. Irshad, M. Salman, M. U. Akram, and U. Yasin, “Automated detection of Cotton Wool Spots for the diagnosis of Hypertensive Retinopathy,” in Cairo International Biomedical Engineering Conference (CIBEC), Cairo, Egypt, 2014, pp. 121–124.
[3] P. Sharma and J. Suji, “A Review on Image Segmentation with its Clustering Techniques,” Int. J. Signal Process. Image Process. Pattern Recognit., vol. 9, no. 5, pp. 209–218, May 2016, doi: 10.14257/ijsip.2016.9.5.18.
[4] N. S and P. Baraki, “Color Image Segmentation By Clustering,” Int. J. Adv. Res. Comput. Sci. Technol., vol. 2, no. 1, pp. 95–97, 2014.
[5] N. Dhanachandra, K. Manglem, and Y. J. Chanu, “Image Segmentation Using K -means Clustering Algorithm and Subtractive Clustering Algorithm,” Procedia Comput. Sci., vol. 54, pp. 764–771, 2015, doi: 10.1016/j.procs.2015.06.090.
[6] T. Mapayi, S. Viriri, and J.-R. Tapamo, “Retinal Vessel Segmentation Based on Difference Image and K-Means Clustering,” presented at the 2014 PRASA, RobMech and AfLaT International Joint Symposium, Cape Town, RSA, 2014, pp. 53–58.
[7] T. Mapayi and J.-R. Tapamo, “Difference image and fuzzy c-means for detection of retinal vessels,” in Image Analysis and Interpretation (SSIAI), 2016 IEEE Southwest Symposium on, 2016, pp. 169–172.
[8] L. Ding, Y. Zhang, and X. Zhang, “An approach to retinal image segmentations using fuzzy clustering in combination with morphological filters,” in Control Conference (CCC), 2011 30th Chinese, 2011, pp. 3062–3065. [9] N. Dey, A. B. Roy, M. Pal, and A. Das, “FCM based blood vessel segmentation method for retinal images,” ArXiv
Prepr. ArXiv12091181, 2012.
[10] S. Rashid and S. Shagufta, “Computerized Exudate Detection in Fundus Images Using Statistical Feature based Fuzzy C-mean Clustering,” Int. J. Comput. Digit. Syst., vol. 2, no. 3, pp. 135–145, Sep. 2013, doi: 10.12785/ijcds/020305.
[11] G. N. S. Prasad, H. Khan, and E. Gopinathan, “Reduction of False Microaneurysms in Retinal Fundus Images using Fuzzy C-Means Clustering in terms NLM Anisotropic Filter,” Int. J. Comput. Appl., vol. 113, no. 19, 2015. [12] F. U. Siddiqui and N. A. M. Isa, “Enhanced moving K-means (EMKM) algorithm for image segmentation,” IEEE
Trans. Consum. Electron., vol. 57, no. 2, 2011.
[13] N. Dhanachandra, K. Manglem, and Y. J. Chanu, “Image Segmentation Using K -means Clustering Algorithm and Subtractive Clustering Algorithm,” Procedia Comput. Sci., vol. 54, pp. 764–771, 2015, doi: 10.1016/j.procs.2015.06.090.
[14] W. Wiharto and E. Suryani, “The Review of Computer Aided Diagnostic Hypertensive Retinopathy Based on The Retinal Image Processing,” presented at the The 2nd Sriwijaya International Conference on Science, Egineering, and Technology (SICEST 2018), Palembang, Indonesia, 2018, pp. 1–9.
[15] F. Albu, N. Dumitriu, and A. Popescu, “An Enhanced Clustering Algorithm For Gaussian RBF Networks,” in International Symposium on Electronics and Telecommunications, Timisoara, Romania, 1998, pp. 216–219. [16] A. R. Backes and O. M. Bruno, “A new approach to estimate fractal dimension of texture images,” in International
Conference on Image and Signal Processing, 2008, pp. 136–143.
[17] W. Li, P. Fu, and E. Zhang, “Application of fractal dimensions and fuzzy clustering to tool wear monitoring,” Indones. J. Electr. Eng. Comput. Sci., vol. 11, no. 1, pp. 187–194, 2013.
[18] A. D. Hoover, V. Kouznetsova, and M. Goldbaum, “Locating blood vessels in retinal images by piecewise threshold probing of a matched filter response,” IEEE Trans. Med. Imaging, vol. 19, no. 3, pp. 203–210, 2000, doi: 10.1109/42.845178.
[19] J. Staal, M. D. Abramoff, M. Niemeijer, M. A. Viergever, and B. van Ginneken, “Ridge-Based Vessel Segmentation in Color Images of the Retina,” IEEE Trans. Med. Imaging, vol. 23, no. 4, pp. 501–509, 2004, doi: 10.1109/TMI.2004.825627.
[20] J. Ma, X. Fan, S. X. Yang, X. Zhang, and X. Zhu, “Contrast Limited Adaptive Histogram Equalization-Based Fusion in YIQ and HSI Color Spaces for Underwater Image Enhancement,” Int. J. Pattern Recognit. Artif. Intell., vol. 32, no. 7, 2018.
[21] W. Wiharto, E. Suryani, and M. Y. Kipti, “Assessment of Early Hypertensive Retinopathy using Fractal Analysis of Retinal Fundus Image,” TELKOMNIKA Telecommun. Comput. Electron. Control, vol. 16, no. 1, pp. 445–454, Feb. 2018, doi: 10.12928/telkomnika.v16i1.6188.
[22] M. F. Syahputra, I. Aulia, and R. F. Rahmat, “Hypertensive retinopathy identification from retinal fundus image using probabilistic neural network,” in International Conference on Advanced Informatics, Concepts, Theory, and Applications (ICAICTA), Denpasar, Indonesia, 2017, pp. 1–6.
[23] N. Popovic, M. Radunovic, J. Badnjar, and T. Popovic, “Fractal dimension and lacunarity analysis of retinal microvascular morphology in hypertension and diabetes,” Microvasc. Res., vol. 118, pp. 36–43, Jul. 2018, doi: 10.1016/j.mvr.2018.02.006.
[24] M. Cavallari, C. Stamile, R. Umeton, F. Calimeri, and F. Orzi, “Novel Method for Automated Analysis of Retinal Images: Results in Subjects with Hypertensive Retinopathy and CADASIL,” BioMed Res. Int., vol. 2015, pp. 1–10, 2015, doi: 10.1155/2015/752957.
[25] P. Zhu et al., “The Relationship of Retinal Vessel Diameters and Fractal Dimensions with Blood Pressure and Cardiovascular Risk Factors,” PLoS ONE, vol. 9, no. 9, pp. 1–10, 2014, doi: 10.1371/journal.pone.0106551. [26] B. Aliahmad et al., “Zone Specific Fractal Dimension of Retinal Images as Predictor of Stroke Incidence,” Sci.
World J., vol. 2014, pp. 1–7, 2014, doi: 10.1155/2014/467462.
[27] W. Wiharto, H. Herianto, and H. Kusnanto, “The analysis of performace model tiered artificial neural network for assessment of coronary heart disease,” Int. J. Electr. Comput. Eng., vol. 7, no. 4, pp. 2183–2191, 2017, doi: 10.11591/ijece.v7i4.pp2183-2191.
[28] B. Sasangka and T. Ratnaningsih, “Reticulocyte hemoglobin content (CHr) for iron deficiency screening in pregnant women,” J. Gizi Klin. Indones., vol. 16, no. 1, p. 40, Jul. 2019, doi: 10.22146/ijcn.27387.
BIOGRAPHY OF AUTHORS
Wiharto, received obtained a Doctor of Philosophy (Ph.D.) in Biomedical Engineering (BME) from Gadjah Mada University, Yogyakarta, Indonesia, 2017. He received a Bachelor of Electrical Engineering (B.E.) from Telkom University, Bandung, Indonesia, 1999 and Master's Degree in Computer Science (M.Cs.) from Gadjah Mada University, Yogyakarta, Indonesia, 2004. He is presently working as an Assistant professor in the Department of Informatics, Faculty of mathematics and natural sciences, Sebelas Maret University, Solo, Indonesia. His experience and areas of interest focus on Artificial Intelligence, Computational Intelligence, Clinical Decision Support System, Medical Image Processing and e-Health.
Esti Suryani, received obtained a Bachelor of Science (B.S.) from Gadjah Mada University, Yogyakarta, Indonesia, 2002 and Master's Degree in Computer Science (M.Cs.) from Gadjah Mada University, Yogyakarta, Indonesia, 2006. He is presently working as an Assistant professor in the Department of Informatics, Faculty of mathematics and natural sciences, Sebelas Maret University, Solo, Indonesia. His experience and areas of interest focus on Image Processing, Fuzzy Logic, Data mining, and Expert System.