- Attracting cargo by improving efficiency -
Master thesis of P.V.Vroegop
Economics & Business
Rotterdam, November 2008
The Future of Feedering the Humber
- Attracting cargo by improving efficiency -
Author
Patrick Vincent Vroegop
Student reference 174687
University
Erasmus University Rotterdam
Faculty
Economics & Business
Department
Urban Port and Transport Economics
University Supervisors DRS. M. Nijdam DR. P.W. de Langen
Company
Port of Rotterdam N.V.
Company Super visor DR. P.W. de Langen
Rotterdam, November 2008
© 2008 P.V. Vroegop, Rotterdam, the Netherlands
Preface
This thesis is the result of study that reveals inefficiencies and provides solutions to improve efficiency in an existing feeder chain; “the Rotterdam-Humber corridor”. By improving efficiency Port of Rotterdam should be able to attract more cargo from Middle and North UK. Gathering data to reveal inefficiencies and constructing a model for analysis was a difficult and time consuming work. To get the needed information a lot of interviews with different companies were conducted. Nevertheless, I have conducted this research with a lot of enthusiasm and devotion. The results are presented in the thesis you are about to read.
I conducted this research for the Department Corporate Strategy of Port of Rotterdam N.V. and to finish my study Business & Economics at Erasmus University Rotterdam. I always have had a fascination for ports and big (container) vessels. When I got the opportunity to combine the writing of my thesis with an internship at Port of Rotterdam, I did not have to think twice to seize that opportunity.
Although I wrote this thesis by myself, it would not have been possible without the help and support of a lot of people. Particular, I would like to sincerely thank Peter de Langen and Michiel Nijdam, who have supported me during the process and always gave me useful feedback. I would also like to thank the people at Port of Rotterdam and the companies I interviewed, who in spite of their busy agendas, always made time for me to give me useful feedback and information to write my thesis. Particular, I would like to thank the Department Corporate Strategy at Port of Rotterdam for the ability to participate in their daily business and for all the good moments I have experienced.
With the finishing of my thesis I also finish a period of 7 wonderful years of studying in Rotterdam. During these years I gained a lot of knowledge via my studies Business & Economics and International Marketing Management. This would not have been possible without the support of my parents. I would like to thank them for the opportunity and trust they always had in me. Especially, I would like to thank my dad because he always made time to help me with difficulties regarding my thesis during his own busy job. Last but not least, I would like to thank all my family and friends for the support they gave me.
I hope you will read this thesis with pleasure while it simultaneously informs you about a, in my point of view, very interesting topic.
Patrick Vroegop
Abstract
Feedering, which is an integrated part of transhipment, has not had much attention by the different scholars in the field of maritime economics. Most scientific literature is about transport networks, which includes transhipment. Or about the economic principles, which induced the creation of these new network structures. This thesis goes further where most literature stops. It provides more insight in the transhipment and feeder market in North West Europe. Besides the way feedering has originated, this thesis shows us where today’s problems regarding feedering occur and what the main factors for shipping lines are for deploying dedicated feeders. Furthermore, this thesis shows how feeder chains are constructed and what the different (cost) components are in the feeder chain. A conceptual model of the feeder chain costs is created. By identifying the “Service Distortion Costs” in the feeder chain, a clear picture exists about where efficiency improvements could be made. The port of Rotterdam has been used as a case study for this research and the Rotterdam-Humber corridor has been used for analysis. The conceptual model is applied on the Rotterdam-Humber corridor and has revealed existing inefficiencies. The main goal of this thesis is to improve efficiency in the Rotterdam-Humber corridor in order to attract more cargo from Middle and North UK to port of Rotterdam. Solutions for feeder chain efficiency improvements are discussed and recommendations are given. In short, this thesis adds more knowledge to existing literature about feeder chain efficiency problems and improvements in the North West European container market by analyzing an existing feeder connection (Rotterdam-Humber) from Rotterdam to the UK.
Acronyms
ABP Associated British Ports
DC Distribution Centre
DDE Delta Dedicated East
DDN Delta Dedicated North
DDW Delta Dedicated West
DBF Dedicated Barge Feeder ITT Intern Terminal Transport NETA North European Trade Axis RDC Regional Distribution Centre
PoR Port of Rotterdam
SDC Service Distortion Costs THC Terminal Handling Charges WTD Working Time Directive
List of Tables
Table 2.1: Fundamental and Practical oriented research ... 14
Table 2.2: Differences between deductive and inductive approaches to research ... 17
Table 3.1: World container traffic and its components in million TEUs ... 23
Table 3.2: Total share of transhipment in total world throughput ... 23
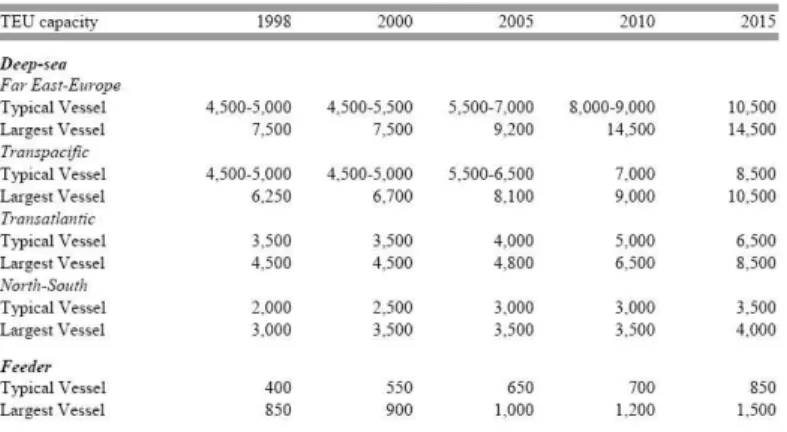
Table 4.1: Development of container vessels ... 37
Table 4.2: Forecast vessel sizes by major container trades to 2015 ... 37
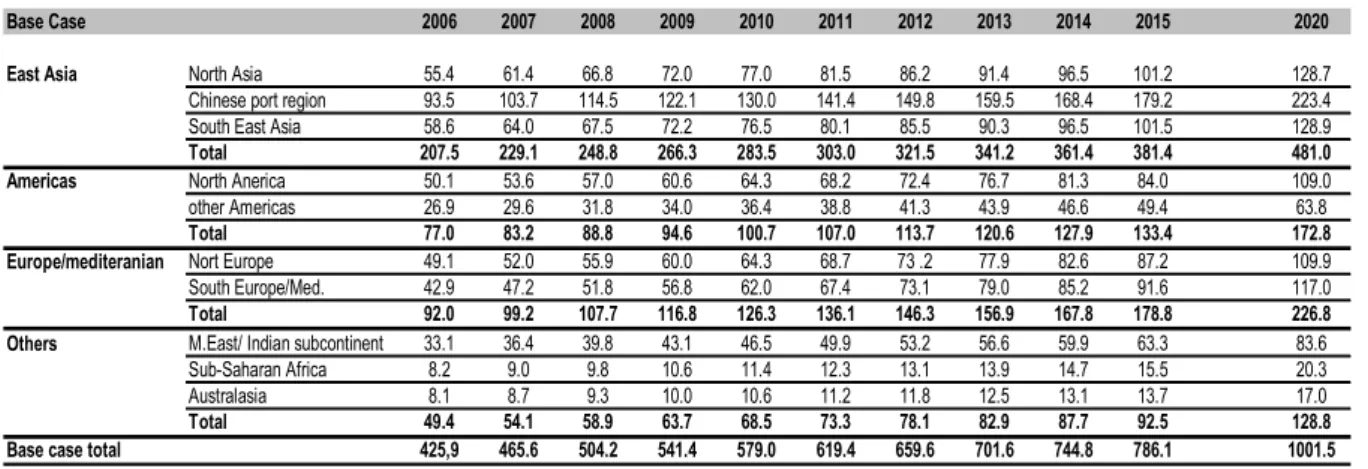
Table 4.3: Total world container port demand by region to 2020 (incl. Transhipment) – Million TEUs ... 38
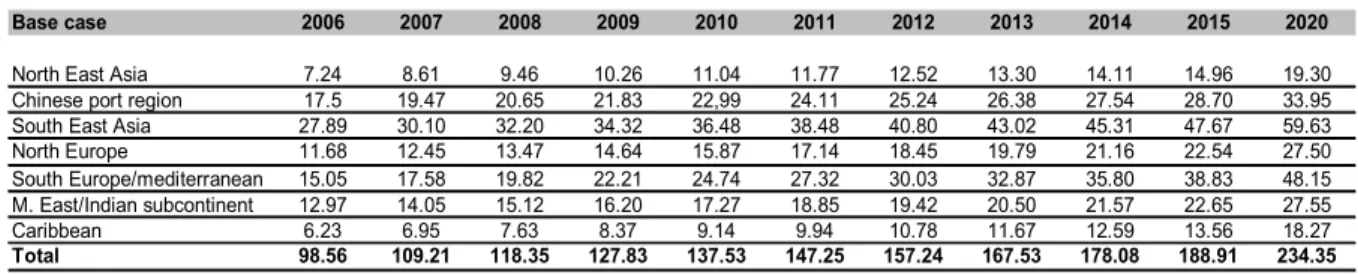
Table 4.4: Total world transhipment demand by region to 2020 in million TEU ... 39
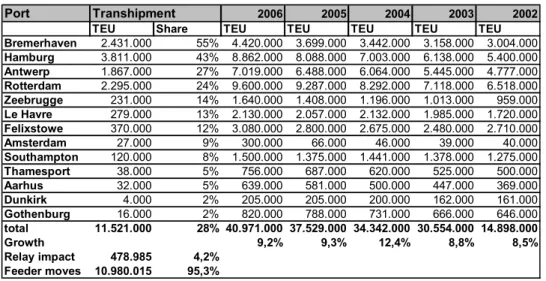
Table 4.5: Transhipment share and total container throughput in NW-Europe ports ... 40
Table 4.7: Charter rates container vessels ... 49
Table 4.8: Rotterdam market shares on feeder areas ... 50
Table 6.1: Volume handled in UK ports (2007) ... 67
Table 6.2: Forecast UK containerised traffic by world region, 2004-2030 – TEU (‘000) ... 68
Table 6.3: UK volume estimation to 2012 in TEU (‘000) ... 71
Table 6.4: Evolution of vessels and fleet capacity ... 72
Table 6.5: UK ports capacity and utilisation rates ... 73
Table 6.6: UK port Utilisation till 2012. ... 73
Table 6.7: Converted deep sea volume to feeder/short sea volume ... 74
Table 6.8: Humber port traffic (200-2006) ... 77
Table 6.9: Port handled TEUs ... 79
Table 6.10: Ports used for imports ... 79
Table 6.11: UK/Ireland market shares and number of full loaded/discharged TEUs ... 80
Table 6.12: Rotterdam – UK traffic (including empty containers) ... 81
Table 6.13: Overall connectivity index; Asia trade ... 82
Table 6.14: Inbound connectivity index; Asia trade ... 83
Table 6.15: Transit time and direct calls inbound ... 83
Table 6.16: Time savings Rotterdam ... 84
Table 7.1: Cost allocation feeder operator ... 90
Table 7.2: Service distortion costs and UK road haulage costs ... 90
Table 7.3: Feeder tariffs to Humber ... 91
Table 7.4: Terminal Handling Charges ... 91
Table 7.5: Break-even-points for different scenarios ... 93
Table 7.6: Indicated Rotterdam-Humber corridor inefficiencies ... 102
Table 8.1: Five most important selection factors for mainline and feeder……….106
Table 8.2: Overview of present inefficiency factors in Rotterdam-Humber corridor………..110
List of figures
Figure 1.1: Inter-port distance ... 10Figure 2.1: Research framework ... 20
Figure 3.1: The emergence of hierarchical port shipping networks handling containerized cargo ... 26
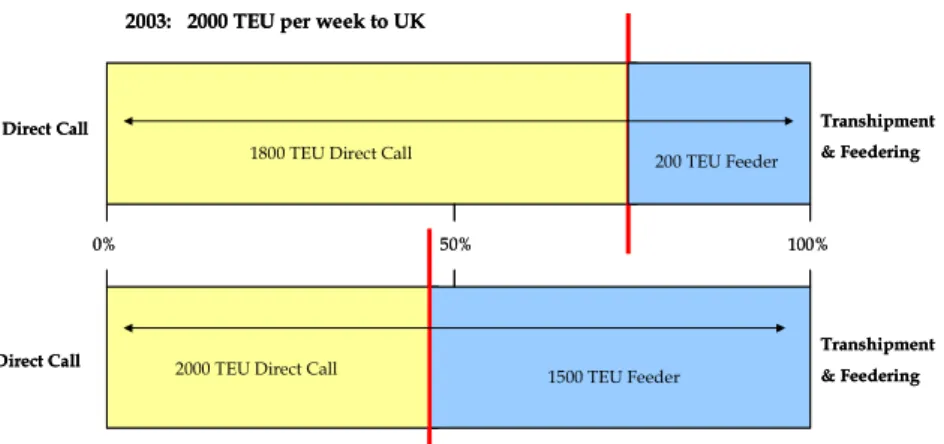
Figure 4.6: Visualised dynamics of feeder market... 43
Figure 5.1: Feeder chain stages and costs components ... 55
Figure 5.2: Conceptual model of the feeder chain costs ... 58
Figure 6.1: Container Distribution – Southampton ... 69
Figure 6.2: Container distribution - Felixstowe……….…...68
Figure 6.3: Import Container Distribution – All Import ... 70
Figure 6.4: Map of Humber ports ... 76
Figure 6.5: Major Ports traffic UK (2006) ... 77
Figure 6.6: North European Trade Axis ... 78
Figure 7.1: Feeder chain cost components………89
Table of contents
Preface ... 3 Abstract ... 4 Acronyms ... 5 List of Tables ... 6 List of figures ... 6 Table of contents ... 7 Chapter 1 – Introduction ... 9 1.1 Background ... 9 1.2 Problem analysis ... 11 1.3 Objective ... 12 1.4 Definitions ... 12Chapter 2 - Research setup ... 14
2.1 Introduction ... 14
2.2 Type of research ... 14
2.3 Problem statement ... 15
2.3.1 Main research question ... 15
2.3.2 Sub research questions ... 15
2.4 Research strategy ... 16 2.5 Relevance ... 18 2.5.1 Practical relevance ... 18 2.5.2 Scientific relevance ... 19 2.6 Scope... 19 2.7 Research framework ... 20
Chapter 3 - Literature review of transhipment ... 21
3.1 Introduction ... 21
3.2 Changes in the maritime environment ... 21
3.3 Hub-and-spoke system ... 22
3.3.1 Dynamics and restructuring of hub and feeder networks ... 24
3.3.2 Network transformation ... 25
3.3 Port strategies ... 27
3.4 Port criteria and selection factors ... 28
3.5 Conclusions ... 31
Chapter 4 - Transhipment and Feedering ... 33
4.1 Introduction ... 33
4.2 Principles of transhipment ... 33
4.3 Footloose business ... 35
4.4 Ship size developments and order book ... 36
4.5 Global forecast figures ... 38
4.6 Transhipment in North West Europe ... 39
4.7 European Feeder market... 41
4.7.1 Feeder market principles ... 41
4.7.2 Types of feedering ... 43
4.7.3 Competition ... 45
4.7.4 Feeder vessels in North West Europe ... 46
4.7.5 Market developments and trends ... 48
4.7.6 Charter market Rates ... 49
4.7.7 Intra-European feeder areas ... 49
4.8 Hub port issues ... 51
4.9 Conclusions ... 52
Chapter 5 - Feeder chain ... 54
5.1 introduction ... 54
5.2 Feeder chain stages and cost components ... 55
5.3 Conceptual model: Feeder Chain Costs ... 57
5.3.1 Terminal costs ... 58
5.3.2 Capital cost ... 59
5.3.3 Operating costs ... 60
5.3.4 Fuel costs... 60
5.3.5 Slot utilisation costs ... 60
5.3.7 Inland transportation costs ... 62
5.3.8 Service Distortion costs ... 62
5.4 Conclusions ... 65
Chapter 6 – UK and Rotterdam ... 67
6.1 Introduction ... 67
6.2 UK container market ... 67
6.2.1 UK cargo distribution ... 68
6.2.2 UK port capacity situation... 71
6.3 UK ports ... 74
6.3.1 Southern UK deep sea ports ... 75
6.3.2 New projects and focus ... 75
6.3.3 Humber ports ... 76
6.4 Rotterdam – UK Connection ... 80
6.5 Quality of connections ... 82
6.6 Conclusions ... 85
Chapter 7 – Rotterdam –Humber Corridor ... 87
7.1. Introduction ... 87
7.2 Business case: “The Rotterdam – Humber Corridor“ ... 87
7.2.1 Costs allocation ... 88 7.2.2 Rotterdam-Humber case ... 90 7.3 Corridor analysis ... 95 7.3.1 Corridor inefficiencies ... 95 7.3.2 Interview results ... 101 7.4 Conclusions ... 102
Chapter 8 – Conclusions and Recommendations ... 104
8.1 Introduction ... 104
8.2 Conclusions ... 104
8.3 Recommendations ... 110
Bibliography ... 116
Chapter 1 – Introduction
1.1 Background
The ongoing development in global trade has significantly increased the demand for container (liner) shipping. Together with containerisation, contemporary liner shipping is characterised by increasing vessel size, more comprehensive geographical network coverage and frequent restructuring of shipping lines, like mergers, acquisitions and shipping alliances (Heaver, 2002). In turn, this has led to increased popularity of using hub-and-spoke systems. As a result, transhipment has become a significant sector in the shipping industry and is increasingly important in determining port competitiveness.
Globalisation and the booming industry in the Far East (China) have contributed to annual growth rates of 11% in the container market between 1980 and 2006. In that time span container throughput has increased from 39 to 440 million TEUs (Drewry, 2007). This tremendous growth in world trade has led to capacity problems and congested transport networks at most North-West Europe container ports.
Ports with capacity shortages and congested transport networks are expensive and unable to provide reliable services. As a consequence shipping lines try to find other solutions to ship containers from and to their customers. Other solutions usually mean using the congested port as little as possible. The combination of increasing vessel size, tremendous growth in world trade and congestion at major container ports, will only increase the demand for transhipment.
According to Notteboom (1998) the assumption of larger mainline carriers calling at fewer ports and thus induce an increase in feeder traffic has not been actualised so far. However, It is in my opinion that increasing size of carriers will probably result in fewer ports getting a direct call from the shipping lines. The first reason is that not all ports are able to handle these big carriers, mainly because of draft and berth restrictions. Second, it is economically not profitable when a big carrier call at a lot of different ports in the same region. The trend of increasing vessel sizes can, in the future, lead to only one or two call(s) at one or two port(s) in North West Europe. Becoming the main port hub of Europe will increase container throughput tremendously and thus market share and revenues. Furthermore, this development will also lead to more demand for transhipment and feedering in the North West European region.
This evolvement in the shipping industry, which is an opportunity for Rotterdam because of its geographical location, has to be turned into a new strength. Providing sufficient transhipment possibilities to major shipping lines is important for ports, because it not only generates transhipment cargo but also additional (continental) hinterland cargo. When carriers do not have the possibility to tranship at a port, they will seek other ports in the region, which do have sufficient transhipment possibilities. The consequence is the fact that if a shipping line decides to move to another port, a part of the hinterland cargo generated by the moving shipping line will also move. In other words, if Rotterdam does not create an efficient and effective transhipment environment, they will loose (continental) hinterland and transhipment cargo to other ports in the region and eventually will loose the battle of becoming Europe’s main port hub.
Port of Rotterdam (PoR) is always seeking to increase market share and their goal is to be the main port hub of Europe. In the transhipment business, Rotterdam wants to maintain its leading role (Bedrijfsplan HbR, 2008-2010). Because of its unique geographical location, Port of Rotterdam is besides its gateway function for the European continent very suited to be the main transhipment hub for Europe. But if Rotterdam wants to be the main transhipment hub of Europe, they have to provide all necessary facilities for transhipment and feedering.
In North West Europe transhipment has a share of 28% in total container throughput, which means that approximately 5.5 million TEU has to be feedered over the region (Dynamar, 2007). There are three dense intra-European feeder flows; Scandinavia and the Baltic, Northern Spain and Portugal and UK and Ireland. Rotterdam has the largest market share in the UK/Ireland and Spain/Portugal flows.
This thesis is about transhipment and feedering the UK via Rotterdam. It investigates the opportunities and possibilities of attracting cargo from North and Middle UK to the port of Rotterdam. A conceptual model of the feeder chain costs is created and analysed, in order to get an understanding of how the feeder chain works and where efficiency improvements can be made. Improving feeder chain efficiency is one of the key elements in this thesis. Improving chain efficiency should result in attracting more containers to the port of Rotterdam and improve chain performance
The focus of the thesis is on the Rotterdam-Humber corridor. This is a connection (feeder flow) between Rotterdam and a port area located in the middle of the UK along the east coast. It has a good accessibility towards North and Midlands of the UK and can therefore be seen as a global gateway for the North. The five ports that are located in the Humber are: Grimsby & Immingham, Hull & Goole, Rivers Hull and Humber and the River Trent. This is the most obvious port area to use for serving Middle and Northern UK markets via Rotterdam because of its geographical location.
This thesis will provide recommendations about how feeder chain efficiency in Rotterdam can be improved. It gives insight in what Port of Rotterdam and the industry should do to attract more cargo from North and Middle UK. In the next paragraph the problem analysis is presented.
Figure 1.1: Inter-port distance
234 miles
235 miles Southampton
Humber
1.2 Problem analysis
Felixstowe and Southampton are the two major container ports of the UK. At the moment these Southern UK ports and their hinterland transport network are heavily congested. After the privatisation of the UK port industry in the 1980’s there has been a lack of investment in the transport network connecting the ports with the Middle and North of the UK. Together with growing demand for port capacity due to the increase in global trade, the two largest UK container ports have become unreliable and expensive in terms of services offered (Humber Logistic study, 2003). Other solutions are sought by shippers, carriers and forwarders to serve a significant part of the UK market. The congested ports in the South of the UK have led to companies rethink their supply chains.
Also the introduction of the Working Time Directive (WTD) in March 2005 has placed pressure on existing supply chains. Because of this policy implementation, all (truck) drivers are limited to a 48-hour week on average with a maximum 60-hour permissible. Because of the WTD transport costs in the UK have increased and shipping cargo, via the South of UK to parts of the Middle and North, have become expensive and unreliable in terms of costs and time. Time reliability is especially important because most retailers are operating with tight windows at Regional Distribution Centres (RDC).
A close examination of the container distribution in the UK, which is examined more extensive in chapter six, reveals that around 50 % of the import containers are designated for the Middle and North UK. However, most containers for this area are imported through the Southern container ports of Felixstowe and Southampton.
Major trends in the port and transport sector, expensive and unreliable services at the Southern deep sea port terminals because of congestion and the introduction of the WTD, have made the Rotterdam-Humber corridor a very attractive and viable option for shippers, forwarders and shipping lines to serve the Middle and North UK market.
When looking at PoR objectives for the coming years (Bedrijfsplan HbR, 2006-2010, Havenplan 2020), it becomes clear that this opportunity is in line with one of the company goals, which is to strengthen its competitive market position in the container market. This means that strengthening the Rotterdam-Humber corridor is in line with PoR objectives. Rotterdam already started with capacity expansion projects, such as the Dedicated Barge Feeder terminal (DBF) at the ECT Delta terminal and the Maasvlakte 2 project, to facilitate the largest vessels and to secure reliable feeder connections.
However, before the market is convinced that this corridor is truly the best way of serving Middle and North UK, proof has to be presented in terms of transit time, service reliability and total costs. These three factors are the cornerstones of today’s shipping industry. Furthermore, to establish an efficient and competitive feeder connection, improvements at both sides of the corridor have to be implemented. Chain efficiency is most important in that respect. Therefore, this thesis will investigate how the efficiency in the Rotterdam-Humber corridor can be improved.
1.3 Objective
The above has resulted in the following objective for this research:
By obtaining insight in the European feeder market, with a focus on UK, the inefficiencies that are present can be detected. Raising efficiency will lead to improvements in time, costs and reliability, three factors which are very important in the shipping industry.
1.4 Definitions
In this paragraph, definitions that are important with respect to this research are given. Transhipment and feedering are strongly associated. However, in the container business transhipment does not necessarily means feedering. There are different forms of transhipment (Dynamar, 2007):
§ Transit: the handling of containers from a mainline ship directly or via the quay onto barges (or other modes) to the port’s hinterland. However, in the context of this thesis transhipment concerns a move between sea-going ships. Containers transported to the hinterland by whatever mode (train, barge, truck) are in transit.
§ Interlining: transhipment between two or more parallel running services operated by one carrier (or alliance) in the same trade, but serving different ports at the end of each string. By switching containers between mainline carriers, mostly at one common hub, all ports in the trade are served at a frequency equal to that of the total number of different (weekly) strings. Leading ports at which interlining takes place are; Hong Kong, Singapore, Antwerp and Rotterdam.
§ Relay: transhipment of containers between East-West operating mainline carriers to usually a North-South trading mainline carrier (mostly smaller vessel), the container switches mainline routes.
§ Feedering: transhipment from mainline carrier onto a sea-going feeder vessel, and vice versa, for short haul distribution to ports which are too small or lack sufficient volumes to be served by a mainline carrier. Feedering is an extension of the deep sea operation.
“Container transhipment can be defined as the exchange of containers between ships via a port terminal, involving two separate lifts between the ship and the quay” (MDS Transmodal, 2006).
“Gain insight in the European Feeder market, with the aim to provide suggestions to raise the efficiency in the Rotterdam-Humber Corridor”
§ Shortsea: shortsea shipping from a European point of view means the movement of cargo (and passengers) by sea between ports situated in geographical Europe or between those ports and ports situated in non European countries having a coastline on the enclosed seas bordering Europe. The big difference between shortsea and feedering is the fact that shortsea operators are searching for their own commercial cargo, while feeder operators do not have their own commercial cargo. Feeders only ship cargo that comes directly from a mainline vessel. The commercial cargo is from the mainliner and not from the feeder operator. Feedering is an extension of the mainline operation. Shortsea shipping is a totally own operation, providing customers (shippers) in Europe an intermodal door-to-door solution for the shipment of cargo between different countries in Europe or nearby Europe.
§ Hub-and-spoke: The hub-and-spoke system is in fact an system that allows shipping lines to efficiently serve smaller markets by using a combination of very large mother carriers (>10.000TEU) that call only at a big hub port and smaller feeder ships. By including transhipment in the operation of shipping companies, they are able to achieve considerable economies of scale. Smaller ships then provide faster feeder services on inter-regional short routes or other low traffic routes. Transhipments offer an efficient way of serving smaller ports and countries and provide many more port-to-port connections to shippers than direct services (Damas, 2001). In fact, with the hub and spokes system, carriers can provide shipping service virtually between any two ports not connected by a direct service
§ Rotterdam-Humber Corridor: is a (feeder) connection between port of Rotterdam and the UK Humber ports of Immingham & Grimsby and Hull & Goole, located at the Middle of the UK at the East coast. The corridor starts with the loading of the feeder vessel in the port of Rotterdam and ends when the container is delivered at the final customer in the UK. Therefore, the corridor consist of a part sea and a part land transport The corridor is an alternative for delivering a container in Middle and North UK via a direct call of a mainline vessel in Southern UK ports.
In the next chapter the research setup is presented. The main research question and the sub-research questions are discussed and the research strategy to answer the research questions is provided. Furthermore, the practical and scientific relevance of this thesis is argued.
Chapter 2 - Research setup
2.1 Introduction
To raise chain efficiency it is important to know how a chain works; is created; what the different links in the chain are; and probably most important what the problems (inefficiencies) in the chain are. In this chapter the research method is described. According to Yin (2003) a research design is the logic that links the data to be collected and the conclusions to be drawn to the initial questions of the research. The first part of this chapter describes the type of research that is conducted. This is followed by the construction of the main research question and sub research questions. The research strategy, which gives an overview of the used methods to answer the research questions, is given in the last part of this chapter. Finally, a visualized overview of the steps taken to realize the aim of this research is given.
2.2 Type of research
According to Saunders, et al (2000) two types of research can be distinguished; a basic/fundamental oriented research and applied/practical oriented research. The types of research are put apart in the table below.
Table 2.1: Fundamental and Practical oriented research
Source: Saunders et al 2000
Practice oriented research is described by the product of the research, like concepts, views and methods, which are useful for specific management problems. Scientific oriented research, on the other hand, has the emphasis to gather general knowledge and contributes to the general science. The main difference is that practical oriented research has the aim to provide concrete knowledge for a customer or a group of customers for a specific problem or situation.
Taking the explanation of above into account this research is a practical oriented/applied research. It is practice oriented because this research provides a better understanding of feeder chains from and to Rotterdam, based on a case study of the Rotterdam-Humber corridor.
Although this thesis is practice oriented, it will have scientific value since the aim is related to create new insights in feeder chains in North West Europe. By using existing theory and information gathered by interviews, a
Fundamental/ Basic research Practice oriented/Applied research
Purpose:
- Expand the knowledge of processes of business and management
Purpose:
-Improve understanding of particular business or Management problems.
- Result in universal principles relating to the process and its relationship to outcomes - Findings of significance and value to society
Context:
- Undertaken by people based in universities - Choice of topic and objectives determined by the researcher
- Flexible timescales
- Choice for research subject and goal
-Results in solution to the problem. -New knowledge limited to problem -Findings of practical relevance and value to manager(s) in organisation(s)
Context:
- Undertaking by people based in a variety of settings, including organisations and universities - Objectives negotiated with originator
conceptual model of the feeder chain costs is created. The conceptual model provides new insights in the North West European feeder business. By analysing the Rotterdam-Humber corridor, with the constructed conceptual model, solutions for (efficiency) improvements are put forward.
2.3 Problem statement
The research question of this thesis is presented in sub-paragraph 2.3.1. To give a clear and structured answer to the main research question, sub research questions are constructed. The sub research questions are given in paragraph 2.3.2.
2.3.1 Main research question
The main research question is derived from the objective. The following research question has been formulated for this research:
2.3.2 Sub research questions
The sub questions are derived from the research question. Seven sub-questions are formulated to give a well structured answer to the research question.
1.
The answer to this question is given in chapter three. Insight has been gathered through a literature study.
2.
Also a literature study provides the necessary answer to this sub-question. The answer can be found in chapter three.
3.
The answer to this question can be found in chapter four. Literature research and interviews with different maritime companies have provided the necessary input.
“How can Port of Rotterdam improve the efficiency in the Rotterdam-Humber Corridor, in order to attract import cargo from North and Middle UK?”
Which major trends and developments in the port and transport sector have led to transhipment and the use of the hub-and-spoke system?
What makes a port attractive for shipping lines with respect to transhipment and feedering?
4.
In chapter five a conceptual model of the feeder chain costs is created. This model gives a clear overview of the different costs components that are present in the feeder chain. The input for the model has been gathered mainly through face-to-faceinterviews and to a much lesser extends through literature research and Port of Rotterdam documents.
5.
By making an analysis of the UK (container) market with respect to Rotterdam, an answer to this question is given in chapter six.
6.
To answer this question the Rotterdam-Humber corridor is used as a case study. By making a business case of transhipment via Rotterdam compared with a direct call on a Southern UK port, the difference in costs between the two options are revealed.
7.
In chapter seven the conceptual model of the feeder chain costs is applied on the Rotterdam-Humber corridor to reveal possible inefficiencies. Possible inefficiencies will be discussed and explained.
2.4 Research strategy
Research approach
According to Saunders et al (2000), the research strategy is the general plan to answer the research questions. Choosing a research approach is the first step in creating a research strategy. There are two research approaches possible: induction and deduction. The differences between the two approaches are presented in the table 2.2.
The main difference is that in the deductive approach you develop a theory and hypothesis and design a research strategy to test the hypothesis. The inductive approach, on the other hand, you collect data and develop theory as a result of your data analysis. In other words, in the inductive approach theory would follow data rather than visa versa, as in the deductive approach
What are the (costs) components of the feeder chain and what factors are of influence?
Has the Rotterdam-Humber corridor potential for attracting cargo from Middle and North UK to the port of Rotterdam?
What are the feeder chain costs of the Rotterdam-Humber corridor compared with the costs of a direct call on a major Southern UK (container) port?
Table 2.2: Differences between deductive and inductive approaches to research
Source: Saunders et al, 2000
This thesis is an inductive research. It is inductive because there is no hypothesis that is tested. Furthermore, data is collected to develop a theory (conceptual model) as a result of the data analysis. Also the data collected in this research is qualitative.
Research strategy
Saunders et al (2000) have identified eight different forms of research strategies. The experiment is a classical form of research and therefore probably the best known. This research uses the case study and an exploratory study as research strategies. Robson (1993) defines a case study as the development of detailed intensive knowledge about a single case, or a small number of related cases. The case study approach has the ability to generate answers to the question why? As well as, what and how question.
The exploratory study is defined by Robson (1993) as a valuable means of finding out what is happening; to seek new insights; to ask questions and to asses phenomena’s in new light. This research strategy is a particularly useful approach if you want to clarify your understanding of a problem or gain more insight in particular matters. According to Saunders et al (2000), there are three principal ways of conducting exploratory research:
1. Literature study.
2. Talking to experts in the subject (interviews). 3. Conducting focus group interviews.
The research strategy gives an overview of the methods that are used to answer the research questions. All the research questions in this thesis are answered by conducting a case study combined with an exploratory study. The exploratory study is used to identify and analysing trends and developments in port and transport sector. Furthermore, the exploratory study is used to determine what the influence of these trends and developments is on European ports (in particular Rotterdam) and shipping company strategies. The case used in this study is the feeder connection between Rotterdam and the Humber; ‘The Rotterdam-Humber corridor’. By focussing on this particular connection (case), answers to the (sub) research questions(s) could be given.
Deduction emphasises Induction emphasises
• Scientific principles • Moving from theory
• The need to explain causal relationships between variables
• The collection of quantitative data
• The application of controls to ensure validity of data
• The operationalisation of concepts to ensure clarity of definition
• A highly structured approach
• Researchers independence of what is being researched
• The necessity to select samples of sufficient size in order to generalise conclusions
• Gaining an understanding of the meanings humans attach to events
• A close understanding of the research context • The collection of qualitative data
• A more flexible structure to permit changes of research emphasis as the research progresses
• A realisation that the researcher is part of the research process
Data collection
There are different methods to collect data. A few examples are; questioners, interviews, focus groups and published data/literature. In this research the methods of collecting data was by interviews and by desk research. In total 20 unstructured in-dept interviews were conducted, of which 16 in the Netherlands; 3 employees of Port of Rotterdam; 8 shipping lines1 in the top 20; 2 feeder operators were interviewed (Feederlink and BG Freight); 1
terminal operator (ECT); Short Sea Shipping and Port Info Link, and 4 interviews in the UK; APB ports Grimsby & Immingham and Hull & Goole; regional development agency (Yorkshire forward); CEO of 2 maritime companies (Danbrit & RMS) located in the Humber. These interviews, together with desk research, have generated all the necessary data to answer the sub questions and to create a conceptual model of the feeder chain costs. After creating the conceptual model, the model is used for analysing the Rotterdam-Humber corridor. By analysing the Rotterdam-Humber corridor the inefficiencies in the chain are revealed. In this way all the information needed to answer the main research question was collected.
2.5 Relevance
Considering the main objective, this thesis has a practical as well as a scientific relevance. A short elaboration on the practical and scientific relevance is given in the sub-paragraphs below.
2.5.1 Practical relevance
The maritime industry is very dynamic. During the last two decades a lot of consolidation has taken place in the industry. Also the size of the mainline container vessels is growing in a rapid pace, in order to gain more advantages of scale economies. With this enormous growth in vessel size not all European ports are able to accommodate these large ships. A logical result of the ongoing growth in vessel size is that less ports will and can be used by shipping lines and it is therefore valid to conclude that feedering will increase to deliver the cargo on its final destination. Furthermore, the increase in the price for road transport also supports this argument.
The European Union is also a proponent of shifting more cargo from road to water. A good example in that respect is the Marco Polo project (Baird, 2007). Furthermore, with the second Maasvlakte being built and with the trend of growing vessels, it is to be expected that transhipment is going to increase in Rotterdam. This in turn means that the percentage of feedering in the port of Rotterdam is also going to increase.
With transhipment figures increasing, it is important that Rotterdam possesses the requirements of an efficient main port hub. This research sheds light on the inefficiencies that are occurring in the Rotterdam-Humber corridor. However, the inefficiencies in this corridor can be projected on other corridors as well, this because most inefficiencies occur in ports (at both ends of the chain). Thus when problems, regarding feedering in Rotterdam, are solved and efficiency improves, this automatically means that the efficiency for more connections improves.
Before making a connection more efficient you have to know where the inefficiencies occur. That is exactly what is done in this thesis: revealing the problems (inefficiencies) and presenting solutions. By improving the
connections, in which Rotterdam plays a pivotal role, the total picture and attractiveness of Rotterdam as a port increases. This eventually will result in attracting more cargo to the port and better chain performance.
2.5.2 Scientific relevance
Most scientific work that has been published regarding the subject of transhipment is about port criteria selection factors or about the economics of transhipment. Also the formation and restructuring of the hub-and-spoke system through time, has had a significant amount of attention. However, research about feeder chain efficiency and the positions of feeders in ports has never been published. In this respect, the research in front of you is unique. A conceptual model of the feeder chain costs is created (using the port of Rotterdam and the Rotterdam-Humber corridor as a case study) and therefore ads to the existing literature about the maritime industry.
In chapter three the most relevant literature about transhipment and feedering is discussed. By combining existing literature with interviews conducted in the market, as well in Rotterdam as in the Humber, a conceptual model is created. The conceptual model that has been created, tries to explain where and how feeder chain costs occur. In this way the model tries to increase the scientific knowledge about feeder chain efficiency in the hub-and-spoke system and the position of feeders in the port of Rotterdam.
2.6 Scope
There are many deep sea and shortsea trades. The most important deep sea trade, in terms of volume, is the Europe-Far East trade. It is on this trade where most cargo is shipped with the largest vessels deployed. The variety of feeder and shortsea networks in Europe is impressive. There are many connections between all ports in Europe. There are three dense feeder networks in Europe. These are to the Scandinavia and Eastern Baltic countries, UK and Ireland and Northern Spain and Portugal.
The focus of this research is on containerised import cargo shipped on the Europe-Far East trade with the final destination of the cargo being the North or middle of the UK. To reach this destination in the UK, containers can be shipped directly on a major UK port (e.g. Felixstowe or Southampton) or via a large port on the European continent (e.g. Rotterdam or Antwerp). This means that containers that are shipped from the Far East to, for example Rotterdam, have to be transhipped in Rotterdam to the UK. There are different manners to tranship a container but in this research feedering has the focus. The feedering of a container to the UK, with its destination being the Middle or the North of UK, can be done to a variety of ports. In this research the focus is on the Humber ports. Immingham is, in this region, the best known feeder port by the market. However, there are more ports in this region of which Hull is also well known. The purpose of this research is to improve the Rotterdam-Humber connection in a way that more containers with destination middle or north UK are (tran) shipped via Rotterdam instead of directly to UK. In short, the scope of the research is import containers from the Far East, which have a destination in Middle and North UK and which are transhipped via Rotterdam and feedered to the Humber.
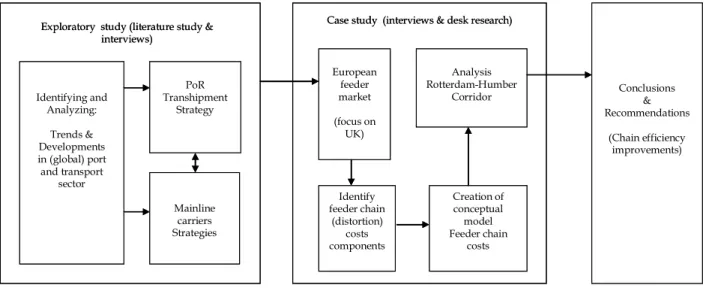
2.7 Research framework
In this paragraph a visualized outline of the research setup is presented to get a better understanding about how this research is constructed to realize the aim of this thesis. First, an exploratory study has been conducted to get an overview of the global trend and developments in the port and transport sector. These trend and developments are analysed in order to get a better understanding what the influences are on port and shipping line strategies. Furthermore, the transhipment and feeder market is uncovered and the basic (economic) principals are presented.
Second, knowing the most important trends and developments and the reaction of ports and shipping lines on these global trends and developments, a case study is conducted for the North West European transhipment and feeder market with a focus on Rotterdam and UK. Desk research and interviews have provided the necessary information about the European transhipment and feeder market to identify the different costs components, needed for the construction of a conceptual model of the feeder chain costs.
The third phase of this research focuses on the actual creation of the conceptual model of the feeder chain costs. As stated above, by conducting interviews with different stakeholders of Port of Rotterdam, the feeder chain costs components could be identified and the conceptual model created.
The objective to create a conceptual model of the feeder chain costs is to get a better under standing of the feeder chains that are connected with Rotterdam. Therefore, the conceptual model of feeder chain costs can be applied on all feeder chains that have a connection with Rotterdam. By analysing different chains with the created model, inefficiencies in a particular chain can be revealed. In this research the focus is on the Rotterdam-Humber corridor but this could have been any other feeder corridor. Appling the conceptual model on the Rotterdam-Humber corridor is therefore the fourth stage of this research. In this stage, the future of feedering the Humber is elaborated. With the analyses on the European transhipment market and a special focus on the Rotterdam-Humber corridor, all research questions are answered and conclusions plus recommendations can be given, which will satisfy the aim of this research.
Figure 2.1: Research framework Identifying and Analyzing: Trends & Developments in (global) port and transport sector PoR Transhipment Strategy Mainline carriers Strategies Exploratory study (literature study &
interviews) European feeder market (focus on UK) Identify feeder chain (distortion) costs components Creation of conceptual model Feeder chain costs Analysis Rotterdam-Humber Corridor Case study (interviews & desk research)
Conclusions & Recommendations (Chain efficiency improvements) Identifying and Analyzing: Trends & Developments in (global) port and transport sector PoR Transhipment Strategy Mainline carriers Strategies Exploratory study (literature study &
interviews) European feeder market (focus on UK) Identify feeder chain (distortion) costs components Creation of conceptual model Feeder chain costs Analysis Rotterdam-Humber Corridor Case study (interviews & desk research)
Conclusions & Recommendations
(Chain efficiency improvements)
Chapter 3 - Literature review of transhipment
3.1 Introduction
This chapter gives an overview of the literature that has been published by different scholars about transhipment in liner shipping business. The purpose of this literature review is to provide a better understanding of why and how new (transhipment) network structures in liner shipping have evolved. First, major trends in the port and transport sector are discussed to get a better understanding of how global maritime networks, as we know them today, have emerged. Notteboom and Winkelmans (2001) have written about these changes in the shipping industry and about how port authorities should face the challenges that accompany these changes. De Langen and van der Lugt (2005) have contributed to the existing literature about port re-assessment strategies by investigating how ports should attract new activities in logistics in order to improve the attractiveness of their location. Also Hoffmann (1998) has written about changes in maritime logistics. Hoffmann (1998) discusses the concentration in ports and liner shipping, what the causes of this concentration are and its impacts. Robinson (1998), on the other hand, has written about more specific changes concerning hub and feeder networks in the shipping industry. He writes about the dynamics of restructuring the hub-and-spoke system.
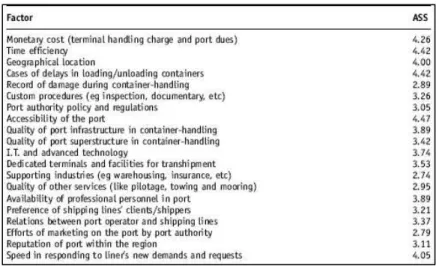
Second, an assessment of the attractiveness of ports in Northern European container transhipment market is made and important port criteria and selection factors are discussed, based mainly on the work of Ng (2006) and Chang et al (2008). Chang et al (2008) discusses the different perspectives between trunk liners and feeder operators regarding port selection factors. Ng (2006), on the other hand, discusses the attractiveness of major ports in Northern Europe acting as transhipment hubs.
3.2 Changes in the maritime environment
The liner shipping business has changed dramatically the last two decades. The market environment, in which ports operate, have also changed. These changes have shaped current global transportation networks. Notteboom and Winkelmans (2001) have discussed the impact of some changes on international trade, transport and shipping and on strategic and operational issues in the framework of port management.
According to Notteboom and Winkelmans (2001) three changes in the maritime environment can be identified. The first big change is the transition from Fordism to post-Fordism. The Fordism economy is based on creating economies of scale, whereas post-Fordism is more focused on creating economies of scope and flexible organizations through cooperation in economic networks. The short product-life cycles, the short-time-to-market and also the outsourcing of activities2 by global companies, have had a great affect on the transport flows in the
sense that the number of products to be shipped and the shipment frequency increases, whereas batch sizes are becoming smaller. Shipping lines, forwarders, terminal operators and other transport operators have responded by providing global logistic packages (the one-stop-shop) and by increasing the scale of operations through alliances and mergers and aquisitions. Providing global logistic packages and increasing scale of operations have induced horizontal and vertical integration along the supply chains. Horizontal and vertical integration are the
2 In the post-Fordian era, three basic forms of outsourcing can be distinguished with regard to supply chain management: 1) Outsourcing of the production components, 2) Value-added logistics, 3) Outsourcing of transportation, warehousing and distribution.
second and third change in the maritime environment. The consequences are mergers and acquisitions, the creation of ever increasing carriers (>10.000 TEU) and the creation of large alliances in liner shipping.
The change of horizontal integration in the maritime industry, argued by Notteboom and Winkelmans (2001), are in line with the research Hoffman (1998) has conducted about concentration in the field of maritime transport. Hoffman concludes that the size of the largest container ships has almost tripled in the last two decades, the top 20 carriers now control more than half of the world’s container slot capacity, the largest ten alliances now control about two thirds of the world’s container slot capacity and that containers are increasingly transhipped. Ports that provide transhipment services have experienced high growth rates. In his article Hoffman provides three main motives for companies to merge and to form alliances. These are to reduce unit costs (i.e. to achieve economies of scale), to increase revenue (i.e. to increase market power) and to reduce the exposure to risk.
Although fewer global players remain, competition in shipping has actual increased (Hoffman, 1998). Together, scale economies and increased competition have impacted on unit costs, profits, overcapacity, freight-rate fluctuations, alliances, North-South and regional markets, transhipment, options for smaller liner operators, global trade and policy implications.
In the next paragraph the impact of scale economies, increased competition in transhipment and the restructuring of the hub-and-spoke system are reviewed and discussed by using research conducted by Robinson (1998). Although, the restructuring of the hub-and-spoke system is also a change in the maritime environment, it is decided to handle this topic in a separate paragraph because of the importance and significance this topic has for this thesis.
3.3 Hub-and-spoke system
Transhipment is a product of the way liner shipping companies organise their container shipping service. It is therefore important to know how this service concept works. There are different manners to tranship (see paragraph 1.4). In this paragraph the hub-and-spoke system will be discussed in-depth because this form of transhipment includes feedering.
As ship sizes continue to increase and shipping line mergers and alliances continue, the economic advantages of reducing the number of port calls become more visible. It is for large carriers economically more profitable to load and unload a large amount of containers in a few ports than calling at several ports to load and unload relatively small numbers of containers. This has to do with the high capital costs associated with container ship construction and the waiting time in ports. Another important reason, in favour of transhipment, is the fact that road transport has become much more expensive the last couple of years. Road transport is in fact a direct competitor of the feeder operator because when a shipping line decides to directly sail at for example the UK, the last leg to the final customer is in most cases by road and to a lesser extent by rail3. Feedering minimises the land transport
because feeder ports are usually closer to the final customer than major main ports (e.g. Felixstowe). The trend of fewer port calls will continue and will favour the larger, centrally placed deep draft ports in a region.
3www.dft.gov.uk
However, increasing transhipment also implies increasing feeder volumes, which place demands on smaller ports to gear up to handle containers at (dedicated) container berths. Transhipment already has a significant place in the global market and its share is expected to increase even more.
In table 3.1 total world port container handlings are presented. The actual world (loaded) container traffic is much less than the port handling. In 2006 total container throughput was 440.4 million TEU’s but world container traffic was 128.3 million TEU. The difference is caused by transhipment and the moves of empties. As can be concluded there is a significant difference between loaded container traffic and total port handlings, which indicates that transhipment is a large market in the shipping business
Table 3.1: World container traffic and its components in million TEUs
Source; Drewry, 2007
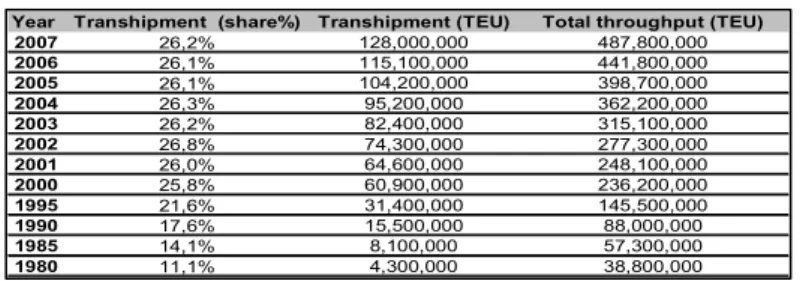
To get a better understanding of the transhipment market it is necessary to know how this market has evolved over time. Table 3.2 shows the total number of global port handled TEU and the share of transhipment in both TEU and percentage since 1985.
Table 3.2: Total share of transhipment in total world throughput
Source: Drewry, 2007
As can be conclude, is that the (absolute) numbers of TEU have increased strongly but that the (relative) share of transhipment has been stable since 2000. This indicates that the transhipment business is a very large and stable market and plays a significant role in today’s shipping business.
Another conclusion that can be drawn is that approximately 1/3 of al TEU’s handled are transhipped. In other words; there are always two moves involved when moving a container from port A to port B, the move of loading in port A and the move of unloading in port B. An additional move has to be taken into account when a container is transhipped before it reaches its final port. This means that if a container is transhipped before it reaches its final destination, it has had at least three moves. Knowing that 1/3 of the containers is transhipped, it can be said that on average a container is transhipped ones every journey.
Transhipment
Total Full Empty Full Empty Full Empty 2000 236,3 186.2 50.1 59.7 139.1 37.5 47.0 12.7 69.6 2001 248.3 193.9 54.4 63.3 144.5 40.5 49.4 13.8 72.3 2002 278.5 219.9 58.6 73.0 162.2 43.2 57.7 15.4 81.1 2003 314.8 249.4 65.4 82.3 184.2 48.3 65.2 17.1 92.1 2004 361.6 287.3 74.3 95.5 211.4 54.7 75.9 19.6 105.7 2005 399.0 316.6 82.4 105.0 233.3 60.7 83.3 21.7 116.6 2006 440.4 348.3 92.1 115.8 256.6 67.9 91.6 24.2 128.3 World container traffic Port Handling Port-to-Port Transhipment
Year Transhipment (share%) Transhipment (TEU) Total throughput (TEU)
2007 26,2% 128,000,000 487,800,000 2006 26,1% 115,100,000 441,800,000 2005 26,1% 104,200,000 398,700,000 2004 26,3% 95,200,000 362,200,000 2003 26,2% 82,400,000 315,100,000 2002 26,8% 74,300,000 277,300,000 2001 26,0% 64,600,000 248,100,000 2000 25,8% 60,900,000 236,200,000 1995 21,6% 31,400,000 145,500,000 1990 17,6% 15,500,000 88,000,000 1985 14,1% 8,100,000 57,300,000 1980 11,1% 4,300,000 38,800,000
It is in my opinion to believe that major shipping lines will continue to serve port regions by as few direct calls as possible, and that thus the role of hub-and-spoke container distribution will continue to increase.
Robinson (1998), using Asia as a case study, has investigated the dynamics and restructuring of hub and feeder networks. The changes and trends that have occurred in the maritime environment, have caused network changes and the creation of new networks. This creation and change of networks will have an impact on feedering. The restructuring of hub-and-feeder networks is discussed in the next sub-paragraph.
3.3.1 Dynamics and restructuring of hub and feeder networks
According to Robinson (1998) the mid-1990s were a defining moment in the restructuring of (shipping) networks, especially in Asia. Continuing high growth rates of containerized cargo have not only induced new ports but also an increase in volumes handled at ports. Furthermore, the rationalisation of already large container shipping lines into alliances and mergers, have caused a new level of market power that is able to force changes in shipping schedules, port rotations and feeder linkages.
Robinson (1998) argues that there are three sets of conditions that have forced fundamental reorientations in the mainline and feeder networks which have emerged. First, the formation of global alliances in liner shipping. These new alliances have implemented new services with increased frequencies, new patterns of rotation and port calls and new feeder networks. The introduction of the 5000-6000 TEU vessels into new restructured patters has had significant implications for network structures. Second, the integration of several Chinese ports into mainline service networks has induced the restructuring of mainline networks. Third, because of the integration of Chinese ports in to the network there has been a rapid growth of feeder networks to include Chinese ports (e.g. Thailand/China link or Singapore/China link).
The restructuring of mainline networks and the growth of feeder networks is also taking place in Europe. Especially the Baltic is causing feeder volumes to increase. The Baltic is a very large market with high growth rates. With mainline vessels getting bigger it is not an invalid argument to put forward that shipping companies are trying to reduce there port calls in a certain region. The first reason is that not all ports are able to handle the large mainline vessels. Second, because it is economically not profitable to call at four or five different ports in North West Europe. The principles of transhipment and thus why it is economically not profitable to call at many ports with large carriers, is explained in the next chapter.
The changes in ports and port development strategies are also adding to the restructuring of networks. Clearly, the rapid growth of some ports provide the necessary cargo threshold conditions for inclusion in new or existing mainline and feeder networks. New ports provide new options for network restructuring or development. However, in a very competitive regional environment inclusion in shipping networks has underlined the need for efficiency as well as growth. These conditions have impacted on and are still impacting on ownership and management strategies in regional ports.
Privatization and corporatization of ports (authorities) have been successful strategies in achieving higher efficiency. A Good example is Port Authority Singapore (PSA). But also shipping lines have focussed on gaining
more control over terminal operations in order to control efficiency and/or other operational requirements. A dedicated terminal, such as the APM terminal in Rotterdam, is a good example.
3.3.2 Network transformation
The changes argued in the above paragraph have implications for port-shipping networks handling large volumes of containers. For ports, increasing volumes of containers through terminals under fixed capacity will cause delays and thus increased costs. New investments, on the other hand, will increase capacity and create economies of scale/scope. Furthermore, increasing container volumes will increase the potential for the port’s inclusion into the mainline rather than feeder networks as critical thresholds are reached. For shipping lines, increasing volumes of containers will create pressures on capacity. The pressure on capacity will trigger an increase in capacity, such as charted-in vessels, slot-agreements, alliances and new buildings of vessels. New vessels are becoming larger and larger in order to reduce per unit costs (Robinson, 1998).
Given these driving principles and changes, the network itself comes under increasing pressure, so that existing networks transform into new networks that reflect an increasing segmentation of the market. Because of this transformation more hierarchical networks will evolve and older networks will become less hierarchical. In this way first, second and third order networks are created. There will be a hierarchy of hubs and in real time these networks will have overlap (Robinson, 1998).
Figure 3.1 illustrates network transformation for a hypothetical set of ports and shipping linkages, which focus on Asia in particularly. The process, which is described by Robinson (1998), is simplified in a three stage process.
Stage I: In this initial stage conventional break-bulk liner services link ports in a well-connected network. Small but increasing volumes of containers begin to appear on some links in the network and from selected ports. This is the pre-1972 stage. Cellular container vessels were beginning to emerge in the Japan-oriented trades and in the Australia-Europe trades. It was in this stage that significant adaptation in the regional ports occurred. Hong Kong, for example, went through an extended period in which conventional berths were modified in numerous ways to deal with increasing numbers of conventional and part-modified conventional vessels, carrying deck loads of containers. Most ports struggled to cope with the new technology.
Stage 2: Increasingly, purpose-built cellular container vessels replace break-bulk vessels; and the port shipping network is progressively decomposed into mainline links supported by feeder shipping links. Hub ports become the centre points between mainline and feeder networks. This was the period of the emergence and consolidation of for example Singapore and Hong Kong as the major hubs in the Asia region
Stage 3: Continuing rapid growth in container volumes, with changes in size and complexity of ports and upgraded shipping services and operations, decompose existing networks into a reordered, hierarchical set of networks. Ports A1 and A2 reach sufficient volumes to evolve into first order ports, examples are the connection Shanghai-Rotterdam. In such networks, highly efficient shipping companies and terminal operators are present in high density trade corridor. Conceptually, they might be regarded as mega terminals. Ports B1, B2 and B3 represent second order networks and support shipping services that are excluded from first order networks, for
example, Dalian (China) and Le Havre. Similarly, ports C1, C2, C3 and C4 represent a hypothetical third order level and serve shipping excluded from the first and second order networks. An example is the Rotterdam-Humber connection.
Figure 3.1: The emergence of hierarchical port shipping networks handling containerized cargo under conditions of rapid growth
Source: Robinson, 1998
Typically, higher order networks will have fewer ports than lower order networks. Note that numerous ports (Dl and D2, for example) will retain feeder status. This is the stage which coincides with major growth in container volumes in other regional economies and particularly the emergence of regional concentrations in China. It is the period of deregulation and the loosening of networks; of the exceptional growth in intra-Asian volumes; of the reorganization of schedules and port calls initiated by the new alliances. This stage stretches beyond the 1990s; mega terminals are emerging; the alliances remain unstable; China volumes continue to increase; more large vessels (10.000 TEUs) are on order and/or are added to major fleets. It will take some time before precisely defined hierarchical networks emerge; and even then they may not be as exclusive as the conceptualization suggests.
Also a stage four can be added to the conceptualisation. In a Stage 4 of the process, the degree to which a port's growth is dependent upon either its role as a hub (transhipment traffic) or its inherent ability to generate traffic other than transhipment traffic, will be critical in determining its position in the network hierarchy.
This paragraph has showed and discussed the significance of transhipment in today’s shipping industry. Furthermore, this paragraph has given insight in the evolvement and transformation of the hub-and-spoke-system. In the above paragraphs the focus was on the changes in the maritime industry and the impact it has had on transhipment and the hub-and-spoke system. However, the roll of ports in the changing industry has not yet been discussed. In the next paragraph the focus will be on the ports.
3.3 Port strategies
Notteboom and Winkelmans (2001) have rightly noticed that all the above changes mentioned have affected port management strategies. There are a couple of important port management strategies that have to be re-assessed. The first one is that ports must be able to accommodate large port clients that are the result of the horizontal and vertical integration. Ports can no longer expect to attract cargo simply because they are natural gateways to rich hinterlands. Major port clients consider ports merely as a sub-system in the logistic chain. Accordingly, they concentrate their service packages not on the ports’ sea-to-land interface but on the quality and reliability of the entire transport chain. Port choice becomes more a function of network costs. The ports that are chosen are those that will help to minimize the sum of sea, port and inland costs.
Another important port strategy is that of securing investments. Contemporary ports make investments based on speculations without actually knowing if traffic will increase. The main argument is that a lack of investments will certainly not increase traffic. Dealing with increased port competition is also a result of the changes mentioned. Shipping lines are creating new types of networks, based on hub and spoke systems. Hub ports used only for transshipment have emerged the last couple of years. Load centers, whose competitive strategy is completely based on their intermediacy, may find themselves in an unstable and highly fragile position, as this kind of traffic flow is more footloose and depends solely upon the strategy of shipping lines with respect to their service networks.
A last point mentioned by Notteboom and Winkelmans (2001) regarding port management strategies is that load centre ports have to deal with possible drawbacks. The economies of scale approach implemented by many seaports do not provide all necessary tools to cope with the highly competitive market environment and to secure their position in the global transport network. The economies of scale approach has to be complemented, if not partly replaced, by an economies of scope approach, based on greater flexibility and a focus on the logistics performance in the whole transport chain. This will allow a port authority to build inimitable and durable core competencies that form the basis of a port’s competitive advantage.
This is also supported by de Langen and van der Lugt (2005). They also concluded that ports have to re-assess their strategy to a more economies of scope approach. Only their approach was from a different perspective (not from a shipping line strategy perspective but from a multinational company strategy). They have investigated the role of ports in global supply chains and the opportunities to attract new economic activities in logistics. According to de Langen and van der Lugt (2005), an interesting question that arises is the speed of the developments of multinational manufacturing and logistics firms towards sophisticated supply chain systems and the ability of ports to position themselves as attractive partners in changing supply chains. Ports with that