Ambientale
DICAM – Dipartimento di Ingegneria Civile, Ambientale, Aerospaziale,
dei Materiali
ICAR/02
Development of an early warning system to predict
sewer overflow
IL DOTTORE IL COORDINATORE
ING. ANTONIA INCONTRERA PROF. ORAZIO GIUFFRÈ
IL TUTOR
PROF. GOFFREDO LA LOGGIA
CICLO XXV
Introduction ... 7
Acknowledgments ... 9
Chapter 1 ... 11
Flood in urban areas ... 11
1.1. Types and causes of urban flooding... 12
1.2. Urban flooding management ... 17
1.2.1. European strategies ... 18
1.2.2. Laws and institutions for the governance of stormwater in Italy .. 20
1.2.3. Excellences in other member countries ... 21
Chapter 2 ... 23
Urban flood mitigation ... 23
2.1. Flood mitigation measures ... 23
2.1.1. Avoidance measures ... 24
2.1.2. Resistance measures ... 25
2.2. Urban resilience ... 27
2.2.1. Resilient city ... 27
2.2.2. Flood resilience evaluation ... 29
2.2.3. Flood resilience measures ... 33
2.2.4. Community Mitigation Capacity ... 35
2.2.5. Decalogue for householders ... 37
Chapter 3 ... 39
Early warning systems... 39
3.1. Early warning system components ... 40
3.2. Rainfall data ... 41
3.2.1. Quantitative Precipitation Forecast (QPF) ... 42
3.3.3. Remote sensing ... 46
3.3.4. Monitoring ... 47
3.4. Urban outflow models ... 48
3.4.1. SWMM ... 49
3.4.2. MIKE STORM ... 50
3.4.3. Delf –FLs ... 51
3.4.4. Infoworks CS ... 51
3.4.5. TUFLOW ... 52
3.5. Communication and alert systems ... 52
3.6. Early warning system examples... 55
3.6.1. Systems based only on rainfall information and empirical scenarios 55 3.6.2. Systems based on rainfall information and pre-simulated scenarios 56 3.6.3. Systems based on real-time data assimilation ... 57
3.6.4. Systems with active feedback to the drainage system operation .. 59
Chapter 4 ... 61
Sewer overflow forecasting for the city of Palermo ... 61
4.1. The city of Palermo ... 62
4.2. Historic information of Palermo sewer system ... 63
4.3. Current assessment ... 65
4.3.1. Separate system and pump station inside shipyard area ... 65
4.3.2. Pipe connecting shipyard area to the second pump station ... 66
4.3.3. Removal of discharge to the sea ... 66
4.3.4. Building of sewer networks ... 66
4.6. QPF ... 72
4.7. Hydrologic and Hydraulic model... 76
4.7.1. SIPSON ... 77 4.7.2. UIM ... 82 4.7.3. ANN ... 84 4.8. Alert system ... 86 4.9. Cost estimation ... 87 Chapter 5 ... 89 Case study ... 89
5.1. Flood event report ... 89
5.2. Flood events selection ... 91
5.3. Rainfall data assessment ... 109
5.3.1. Ground clutter correction ... 110
5.3.2. Estimation of Z-R power law ... 111
5.4. Model assessment ... 113
5.5. Results ... 117
Appendix A ... 126
Figure 1.1: Economic and human life losses in the world due to urban flooding
events. ... 12
Figure 1.2: The Mississippi River flooding in 2011 (a), Hull city during the flooding in 2007 (b), a village in the north of Sumatra in 2004 (c), Buenos Aires province during the flooding in 2002 (d). ... 16
Figure 2.1: Basement floor and walls covered with plastic render. ... 34
Figure 2.2: Resilient floor arrangement. ... 34
Figure2.3:Flood damage on the plaster (a), a room with plastic skirting and raised radiator (b), raised house appliances in a kitchen (c). ... 35
Figure 2.4: Blockage hinges (non-resilient) (a) and traditional hinges(resilient) (b), PVC doors (Ashish Polymers Company) (c). ... 35
Figure 3.1: Map of risk level for Sicily Island (Regione Sicilia-Dipartimento di Protezione Civile). ... 57
Figure 3.2: System structure and webpage of Hvidovre city warning program. ... 57
Figure 3.3: System structure and webpage of Barcelona city warning program. ... 58
Figure 3.4: The St-Charles retention basin and the architecture of the RTC system implemented in Quebec City. ... 60
Figure 3.5: Schematic representation of the types of early warning systems. .. 60
Figure 4.1: Geographical location of the city of Palermo in the Mediterranean sea (a) and administrative borders (b) (in green the district of the old town). . 62
Figure 4.2:In blue the sea and the Kemonia and Papireto rivers, in orange the old town, in yellow the necropolis (a) and a Palermo old town map, enclosed in walls without trace of rivers (b) (16th century). ... 63
Figure 4.3: The city of Palermo in 1890 (a) and main drainage areas for sewer system (b). ... 64
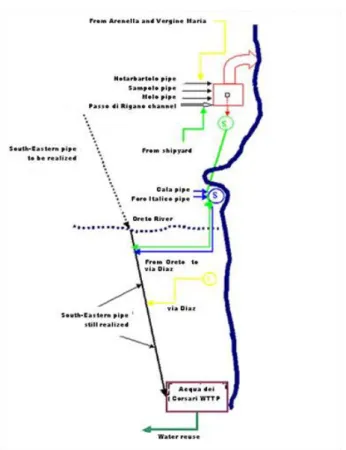
Figure 4.4: Scheme about recovery plan to clean Palermo coast. ... 68
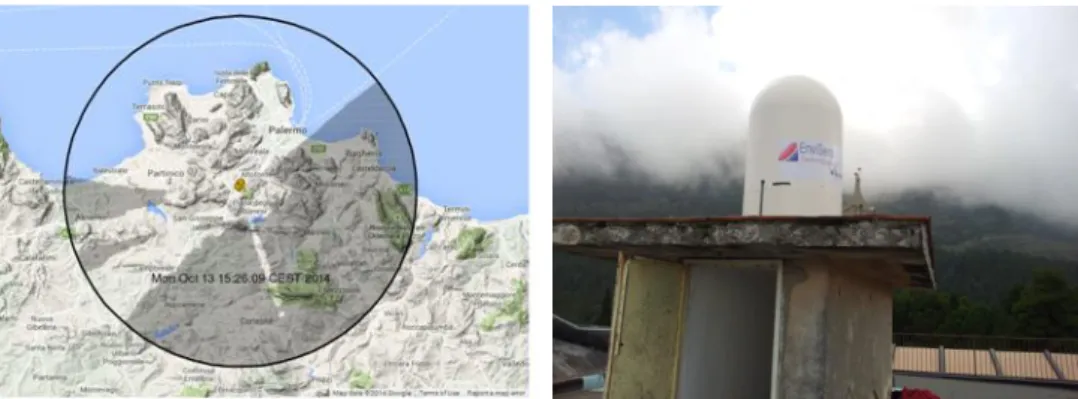
Figure 4.5: Radar clutter map (www.meteoradar.polito.it) (a), radar SUPERGAUGE (b). ... 72
Figure 4.6: Flow diagram for downscaling technique. ... 76
Figure 4.7: Scheme about SIPSON model component. ... 78
Figure 4.10: Scheme about free weir linkages. ... 84
Figure 4.11: Scheme about submerged weir a) and orifice linkage b). ... 84
Figure 4.12: Scheme about multi-input Artificial Neural Network. ... 86
Figure 5.1: Sewer overflowing events in 2008 in the city of Palermo. ... 92
Figura5.2: Sewer overflowing events in 2009 in the city of Palermo. ... 93
Figura5.3: Sewer overflowing events in 2010 in the city of Palermo. ... 94
Figura5.4: Sewer overflowing events in 2011 in the city of Palermo. ... 95
Figure 5.5: Sewer overflowing events in 2012 in the city of Palermo. ... 96
Figura5.6: Sewer overflowing events in 2013 in the city of Palermo. ... 97
Figura 5.7: Sewer overflowing events in 2014 in the city of Palermo. ... 98
Figura 5.8: Water level estimation for sidewalk in via Ernesto Basile (a) and in corso Vittorio Emanuele II (b), for a house in piazza Danisinni(c) and for a car (d). ... 108
Figure 5.9: Radar map in dBZ (a), clutter map for one event (11/10/2013) in which the red areas are classified as clutter (b) and no clutter radar map in dBZ (c). ... 111
Figure 5.10: Z-R relations determined by comparing radar and rain gauge data. ... 112
Figure 5.11: Rainfall intensity measured by rain gauge (solid line) and weather radar (dot line). ... 112
Figure 5.12: Basic parameter file for SIPSON-UIM. ... 116
Figure 5.13: Observed and simulated water level in 2013, the 11th of October. ... 118
Figure 5.14: Observed and simulated water level in 2013, the 11th of October, using rain gauge data. ... 119
Figure 5.15: Observed and simulated water level in 2009, the 1fs of October. ... 120
Figure 5.16: Observed and simulated water level in 2009, the 16th of October. ... 121
Figure 5.17: Observed and simulated water level in 2011, the 10th of November. ... 122
Figure 5.18: Observed and simulated water level in 2013, the 6th of October. ... 123
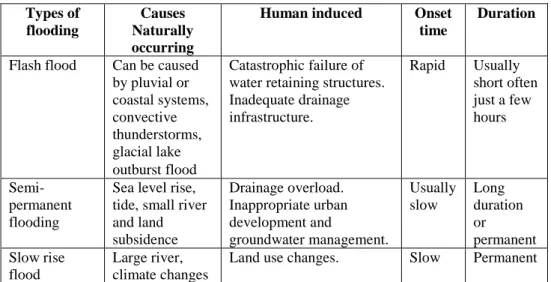
Table 1.1: Types and causes of urban flooding based on speed of onset and duration. ... 13
Table 1.2: Types and causes of urban flooding. ... 14
Table 2.1: Temporal resistant measures (costs refer to a semidetached house). ... 25
Table 2.2: Permanent resistant measures (costs refer to a semidetached house). ... 26
Table 2.3: Availability levels of urban functions. ... 32
Table 2.4: Urban functions for parcel and building flood resilience evaluation. ... 32
Table 2.5: Types of variables considered for district and city flood resilience evaluation. ... 32
Table 4.1: Raingauge installed by Department of Hydraulic Engineering. ... 70
Table 4.2: Values of the coefficients a and b for the Z-R relationship for
different types of precipitation. ... 72
Table 4.3: Start up and management cost for the early warning system of the city of Palermo. ... 88
Tabella5.1: Flood report for the old town of Palermo. ... 99
Tabella 5.2: Flood events report (G and R stands for rain Gauge and weather Radar; selected events have been marked in black). ... 109
Introduction
Flash flooding in our city is still a fairly common phenomenon. Usually the cause is the occurrence of a particularly intense precipitation that may cause the overflowing of rivers, channels or, in many cases, the overloading of the sewers. Damages caused by flooding are affecting communities, busyness, properties and environment.
The defense of urban areas from flooding must start from understanding the dynamics of runoff propagation. This knowledge is particularly important to limit the damage associated with each critical event.
Unfortunately, the development of a flash flood forecasting system in urban areas is not a simple and unambiguous procedure. There are several factors that compete to the realization of this system. The complexity of overflow pathways and the rapid response times are the main difficulties to overcome. Also the choice of the most suitable system must also take into account the sensitivity of the population to this issue and the technical and financial resources of public administration.
Thus the aid made up of all knowledge that public administration and scientific community can provide is extremely important in the study, in the comprehension, and finally in making decision about the actions for safeguard life and property of citizens.
It is clear that this cannot be done by a single person. Technical and relationship skills are part of different people. Citizens themselves are called to collaborate. All people must work together to build a safe space, of which is known the extension.
But how can be defined the extension of an area, or a drainage system? The problem of drawing the boundaries of a living space is secularly known. According to Leibnitz space has no boundaries. It can be represented by a hand in which the extension of the fingers is the distance between people and things that compose a space. Therefore boundaries are relative and only depend on the relationships we choose to adhere to. In the same way the boundaries of a drainage system cannot be defined but it is possible to choose only one extension. If the water exceeds this extension we are in an emergency situation where measures to mitigate risk have to be put into practice. If water does not exceed this limit, the distance between this situation and the limit one takes the name of resilience in a drainage system. In recent years, most of the hydraulic
studies in the urban area, tries to understand how a city can expand or change with a different contour force before drainage system crisis will happen.
Goals
While attending the PhD course in Civil and Environmental Engineering, research activity has been given to realize an urban overflowing prediction system that was best as possible suited to the drainage network of the city of Palermo.
In the past and recent years the city of Palermo has shown signs of hydraulic failure, very useful for understanding the dynamics of water drainage.
This document is the synthesis of that training and research period. The issues analyzed will be described below.
The first Chapter is devoted to analyzing the causes of flooding in urban areas, with greater attention to the phenomenon most frequently recorded in the case study basin: the overflowing due to sewage network overload. To properly define this argument, some information regarding the current state of Italian and European laws about design, correct operations and management of failure of a urban drainage system have been added.
The next Chapter explains the analysis of risk mitigation systems, focusing mostly on a method of identification of the risk levels based on the principles of hydraulic resilience.
Analyzing the structural and non- structural urban flood mitigation system it was decided to present a brief summary of alert systems in real time, including their function and module of which they are composed in Chapter 3.
The analysis of early warning systems and their fundamental components was useful for the choice of an early warning system suitable for the city of Palermo. Chapter 4 is dedicated to show the early warning system chosen for this city.
Chapter 5 explains the activities aiming to write and implement the early warning system. Due to problems related to the complexity of the system, only the procedures that led to the definition of the hydraulic model and data assessment will be described in the following. The detailed definition of the management systems aiming to a real-time application are postponed to a further stage of research. So this chapter describes the techniques needed to calibrate the hydraulic model in order to obtain the resilience map of sewage network.
Last Chapter contains the balance about the work carried out. Of course to be a balance, each item must be supported by the results obtained. In particular all faults and benefits that the proposed methodology shows are declared.
It is recommended to read the last paragraph concerning the future development of this topic.
Acknowledgments
I would like to thank all professors and researchers of DICAM - University of Palermo that allowed me to grow with their important work experience.
I would also mention the staff of University of Exeter that hosted me for four months. I thank them for their trust in me.
I thank God for making me an instrument of his will, because of giving me the gift of critical observation of the beauty of our world.
Chapter 1
Flood in urban areas
A flood is defined by the Oxford English Dictionary as ―An overflowing or
irruption of a great body of water over land in a built up area not usually submerged.‖ Hence flooding represents the phenomenon of water accumulation
in a usually dry area. Frequently the term is used as a synonym of inundation. In urban areas, it is more correct to talk about sewer overflowing, because of the presence of two runoffs, inside the sewers and over the streets.
Sewer overflowing is a natural phenomenon, but it becomes a cause for serious concern when it exceeds the coping capacities of affected communities, damaging lives and property. A sewer overflow can spill raw sewage into basements or out of manholes and onto city streets, playgrounds and into streams, before it can reach a final receiving point.
Sewer overflowing are affecting and often devastating more urban areas, where unplanned development in floodplains, ageing drainage infrastructures, increased paving and other impermeable surfaces, and a lack of overflowing risk reduction activities all contribute to the impacts experienced.
Figure 1.1 shows in the left the growth in direct monetary impacts resulting from flood events, while since the 1950s there has been a marked reduction in human lives losses.
Economic losses above are intended as direct losses. Indirect losses are equally important, such as disease, reduced nutrition and education opportunities, and loss of livelihoods, can also erode community resilience and other development goals, as does the need to constantly cope with regular, more minor, flooding. Such indirect impacts can be hard to identify immediately and harder still to quantify and value.
In terms of disaster management, it is necessary to understand urban flood hazards during overflowing emergencies in order to allow for mitigation, preparation and damage reduction activities. The management of overflowing risk requires knowledge of the types and causes of overflowing. This understanding is essential in designing measures and solutions which can prevent or limit damage from specific types of overflowing. Equally important is the knowledge of where and how often overflowing events are likely to occur.
This is a critical step in understanding the necessity, urgency and priority for overflowing risk mitigation.
Figure 1.1: Economic and human life losses in the world due to urban flooding events.
1.1.
Types and causes of urban flooding
Floods usually result from a combination of meteorological and hydrological extremes, such as extreme precipitation and flows. All floods can have severe impacts on urban areas – and thus be categorized as urban floods.
Urban floods are a growing issue of concern for both developed and developing nations. They cause damage to buildings, utility works, housing, household assets, income losses in industries and trade, loss of employment to daily earners or temporary workers, and interruption to transport systems. The damage caused by urban floods is on the rise.
Urban floods typically stem from a complex combination of causes. The urban environment is subject to the same natural forces as the natural environment and the presence of urban settlements exacerbates the problem. All precipitation and other flows have to be carried away as surface water or through drainage systems, which are usually artificial and constrained by the competing demands on urban land. High intensity rainfall can cause flooding when drainage systems do not have the necessary capacity to cope with flows. Sometimes the water enters the sewage system in one place and resurfaces in others. This type of flood occurs fairly often in Europe, for instance the floods that affected parts of England in the summer of 2007.
In other places, such as Mexico City, constant urban expansion has reduced the permeability of the soil in groundwater recharge areas. This factor, combined with significant land subsidence due to over-exploitation of
groundwater during the last century, has increased the risk of flooding. It is now common that floods in low-lying areas consist partially of sewage fluids.
Urban floods are also caused by the effects of deficient or improper land use planning. Many urban areas are facing the challenge of increased urbanization with rising populations and high demands for land. While there are existing laws and regulations to control the construction of new infrastructures and the variety of building types, they are often not enforced properly owing to economic or political factors, or capacity or resource constraints. This leads to obstruction in the natural flow path of water, which causes floods.
Decision makers and city managers may also be influenced by such issues before revealing the actual level of risk applying to an area to the public, which sometimes has much bigger negative impacts on the flood risk situation of the area. Unless there is awareness amongst residents and proper cooperation between decision makers, risk management authorities and the public in the process of flood risk management, it will be very difficult to control the deterioration of the global urban flood risk situation.
Thus it is important to understand both the cause and speed of onset of each type of urban floods to understand their possible effects on urban areas and how to mitigate their impacts.
Firstly based on the speed of onset of flooding, floods are often described as flash floods, semi-permanent floods, and slow rise floods (Jha et al. 2011) (Table 1.1).
Furthermore based on causes of flooding, floods can be generally characterized into river (or fluvial) floods, pluvial (or overland) floods, coastal floods, groundwater floods or the failure of artificial water systems.
Table 1.1: Types and causes of urban flooding based on speed of onset and duration. Types of flooding Causes Naturally occurring
Human induced Onset
time
Duration
Flash flood Can be caused by pluvial or coastal systems, convective thunderstorms, glacial lake outburst flood Catastrophic failure of water retaining structures. Inadequate drainage infrastructure. Rapid Usually short often just a few hours Semi-permanent flooding
Sea level rise, tide, small river and land subsidence Drainage overload. Inappropriate urban development and groundwater management. Usually slow Long duration or permanent Slow rise flood Large river, climate changes
Table 1.2 summarizes the type and causes of flooding and they are further described below.
Table 1.2: Types and causes of urban flooding.
Types of flooding
Causes Naturally occurring
Human induced Onset
time Duration Pluvial and overland flood Convective thunderstorms, severe rainfall, breakage of ice jam, glacial lake burst,
earthquakes resulting in landslides
Land used changes, urbanization.
Increase in surface runoff.
Varies Varies depending upon prior conditions Coastal-Tsunami and storm surge Earthquakes Submarine volcanic eruptions Subsidence, Coastal erosion Development of coastal zones. Destruction of coastal natural flora (e.g., mangrove). Varies but usually fairly rapid Usually a short time however sometime stakes along time to recede Groundwater High water table
level combined with heavy rainfall, Embedded effect Development in low-lying areas.
Interference with natural aquifers.
Usually slow
Longer duration
River or fluvial floods occur when the surface water runoff exceeds the capacity of natural or artificial channels to accommodate the flow. The excess water overflows the banks of the watercourse and spills out into adjacent, low-lying floodplain areas. Typically, a river such as the Mississippi in the United States (Figure 1.2 (a)) or the Nile in North Africa floods some portion of its floodplains. It may inundate a larger area of its floodplains less frequently, for instance once in twenty years, and reaches a significant depth only once in one hundred years on average. The flow in the watercourse and the elevation it reaches depend on natural factors such as the amount and timing of rainfall, as well as human factors such as the presence of confining embankments, like levees or dikes. River floods can be slow, for example due to sustained rainfall, or fast, for instance as a result of rapid snowmelt.
Pluvial floods also known as overland floods are caused by rainfall or snowmelt that is not absorbed into the land and flows over land and through
urban areas before it reaches drainage systems or watercourses. This kind of flooding often occurs in urban areas as the lack of permeability of the land surface means that rainfall cannot be absorbed rapidly enough. Pluvial floods are often caused by localized summer storms or by weather conditions related to unusually large low pressure areas. Characteristically, the rain overwhelms the drainage systems, where they exist, and flows over land towards lower-lying areas. These types of floods can affect a large area for a prolonged period of time: the 2007 floods in the Hull area in the UK were the result of prolonged rainfall onto previously saturated terrain which overwhelmed the drainage system and caused overland flooding in areas of the city outside the fluvial floodplain (Figure 1.2 (b)). Pluvial floods may also occur regularly in some urban areas, particularly in tropical climates, draining away quickly but happening very frequently, even daily, during the rainy season.
Coastal floods arise from incursion by the ocean or by sea water. They differ from cyclic high tides in that they result from an unexpected relative increase in sea level caused by storms or a tsunami (sometimes referred to as a tidal wave)caused by seismic activities. In the case of a storm or hurricane, a combination of strong winds that causes the surface water to pile up and the suction effects of low pressure inside the storm, creates a dome of water. If this approaches a coastal area, the dome may be forced towards the land; the increasing sea floor level typically found in inshore waters causes the body of water to rise, creating a wave that inundates the coastal zones. The storm surge usually causes the sea level to rise for a relatively short period of time of four to eight hours, but in some areas it might take much longer to recede to pre-storm levels.
Coastal floods caused by tsunamis are less frequent than storm surges, but can also cause huge losses in low-lying coastal areas. The 2004 Indian Ocean Tsunami was caused by one of the strongest earthquakes ever recorded and affected the coasts around the ocean rim, killing hundreds of thousands of people in fourteen countries (Figure 1.2 (c)).
Water levels under the ground rise during the winter or rainy season and fall again during the summer or dry season. Groundwater flooding occurs when the water table level of the underlying aquifer in a particular zone rises until it reaches the surface level. This tends to occur after long periods of sustained high rainfall, when rising water levels may cause flooding in normally dry land, as well as reactivate flows in bourns, which are streams that only flow for part of the year. This can become a problem, especially during the rainy season when these non-perennial streams join the perennial watercourses. This can result in an overwhelming quantity of water within an urban area. Groundwater flooding is more likely to occur in low-lying areas underlain by permeable rocks; where such an area has been developed; the effect of groundwater flooding can be very costly.
Groundwater flooding can also occur when an aquifer previously used for water supply ceases to be used; if less water is being pumped out from beneath a developed area the water table will raise in response. An example of this occurred in Buenos Aires (Figure 1.2 (d)), when pollution of groundwater led to a cessation of pumping. Drinking water was imported instead. The resulting water table rise caused flooded basements and sewage surcharge, which is a greater volume of combined water and sewage than the system is designed to convey (Foster 2002).
(a) (b)
(c) (d)
Figure 1.2: The Mississippi River flooding in 2011 (a), Hull city during the flooding in 2007 (b), a village in the north of Sumatra in 2004 (c), Buenos Aires province during the flooding in 2002 (d).
Since groundwater usually responds slowly compared to rivers, groundwater flooding might take weeks or months to dissipate. It is also more difficult to prevent than surface flooding, though in some areas water pumps can be installed to lower the water table. Flooding can also therefore occur in the event of the failure of pumping systems and may underlie the phenomenon of semi-permanent flooding.
In many cases groundwater and surface flooding are difficult to distinguish.
Increased infiltration and a rise in the water table may result in more water flowing into rivers which in turn are more likely to overtop their banks. A rise in the water table during periods of higher than normal rainfall may also mean that land drainage networks, such as storm sewers, cannot function properly if groundwater is able to flow into them underground. Surface water cannot then escape and this causes flooding.
Pluvial flooding are those that most frequently occur in Sicily. The Sicily Island is characterized by a Mediterranean climate with short duration and high intensity storm events especially in autumn and spring. Consequently, only stormwater management to mitigate urban flooding risk is described in the rest of the text.
1.2.
Urban flooding management
As a result of urban population increase and economic development in some areas, uncertainty about how to quantify and to discern the measures that it must be implemented to mitigate impacts, caused by flooding in urban areas, has grown. This leads to implement strategies for risk mitigation that are flexible and holistic enough. Thus these strategies should be able to ensure sufficient elasticity of the system to different disturbance and understand several aspects that concern not only the structural protection but also the involvement of the exposed population. Consequently, a broad knowledge is necessary for testing mitigation measures, for adapting to the risk that may have a positive impact on the source, on the paths and on the receptors and for understanding the consequences about any flooding event (Langella, 2012).
Stormwater management has been recently married to the criteria of environmental sustainability, due to the application of the concept of hydraulic invariance, which states that the peak flow resulting from a flood drainage area should be constant before and after the transformation of the use of the soil in that area. This has resulted in moving from a management based only on the works of regimentation of traditional hydraulic structures to other that employ autodepurative water capacity.
The different established experiences of a holistic and multidisciplinary approach to the use of integrated policies for stormwater, wastewater and drinking water, with the implementation of standardized practices for whole regions, have resulted in significant improvements in water quality and formal solutions, especially in many non-European countries, more sensitive to these issues, even due to harsh outdoor conditions. These experiences have also proved that the use of alternative techniques can reduce costs compared to traditional construction of the sewage networks and helps to protect the environment from landslides.
In particular, the stormwater management in the United States is headed by the Environmental Protection Agency (EPA) and similar government agencies preside in some regions such in Australia and New Zealand, integrating rainwater management into all environmental issues. These agencies produce guidelines used by local communities to implement effective policies and procedures aimed to correctly bring the urbanized areas at having a water balance as near as possible to the one of the pre-existing natural system. In general, the success of the initiatives, carried out with the contribution of the agencies, is based not only on the activities of regulatory and monitoring local organisms, but also - more or less depending on the case - on experimentation, research, sensitization, information, economic incentives, user participation and technical and administrative support, including the production of a rich documentation.
1.2.1.European strategies
While the previously mentioned agencies are designed as organizations to support the local communities, the European Environment Agency (EEA) is more directed to the production of studies. Although the "Towards efficient use of water resources in Europe" report, published on March 2012, highlights the need for integrated water management, originating from better application of existing legislation, it is clear that the EU devotes little attention to rainwater. Indeed this report is mainly directed towards the reduction of waste and it does not generally address the issue of water in an integrated manner between the three types of water (rainwater, wastewater and drinking water) and other environmental issues.
In addition to the absence of a single system that is able to organize and optimize local policies for proper stormwater management, there are not even specific acts on this subject at European level, although there are several documents that affect this subject, such as the European Charter of water. This extraordinary precursor declaration was written by "European Committee for the Protection of Nature and Natural Resources" and promulgated in Strasbourg, on May the 6th in 1968 by the European Council. The document consists of 19 statements that will affect all subsequent legislative:
1. fresh water resources must be used in keeping with the objectives of sustainable development, with due regard for the needs of present and future generations;
2. water must be equitably and reasonably used in the public interest; 3. water policy and law must protect the aquatic ecosystems and wetlands; 4. it is up to everyone to help conserve water resources and use them
5. everyone has the right to a sufficient quantity of water for his or her basic needs;
6. public and private partners must introduce integrated management of surface water, ground water and related water that respects the environment as a whole, takes regional planning into account and is socially equitable and economically rational;
7. integrated management must be based on an inventory of water resources and aim to ensure their protection, conservation and, if necessary, rehabilitation. In particular, any new deterioration and exhaustion of these resources must be prevented, the recycling of waste water encouraged and, where appropriate, limitations placed on certain uses;
8. water policy and law must be based on the principles of prevention, precaution and correction at source as well as the ―polluter-pays‖ principle;
9. underground water resources must be the subject of special protection, and their use for human consumption must take priority;
10. water resources must be regularly monitored and their general state periodically assessed;
11. water concession must be granted for a limited duration and must be subject to periodic review;
12. large-scale consumption of water in agricultural or industrial processes must be carefully assessed and monitored with a view to ensuring better protection of the environment and avoiding unsustainable utilization; 13. at each state level, central, regional and local authorities must adopt and
implement water management plans in a spirit of solidarity and co-operation. These plans should be based on the catchment basin;
14. decisions on water must take into account the particular conditions at regional or local level and be implemented by the relevant authorities closest to the areas concerned in keeping with water management plans; 15. States must co-operate, preferably within permanent institutions, to agree on an equitable and reasonable method of managing international watercourses and other shared water resources in conformity with international law and the principles of this Charter;
16. the public must have access to information on the state of water resources;
17. the public must be informed in a timely and appropriate manner of water management plans and projects for the utilization of water resources. It has the right to take an active part in planning and decision-making procedures concerning water;
18. the persons and bodies concerned must be able to appeal against any decision relating to water resources;
19. without prejudice to the right to water to meet basic needs, the supply of water shall be subject to payment in order to cover financial costs associated with the production and utilization of water resources. The most important rule on water, although not specifically for rainwater, is the Directive 2000/60/EC. For achieving good ecological and chemical status of all EU waters by 2015, it establishes a framework for Community action, pursuing multiple targets, such as the prevention and control of pollution, the promoting of sustainable water use, the protection of the environment, the improvement of the status of aquatic ecosystems and the mitigation of the effects of floods and droughts. The Directive involves the identification and the analysis of all European waters, classified by basin to which they belong to, and also the adoption of management plans and appropriate measures for each water body.
A subsequent Directive focused more specifically on the flood risk management. The Directive 2007/60/EC on flood risk assessment and management, in analogy to what predisposes Directive 2000/60/EC relating to water quality, wants to create a framework for uniform EU-wide flood management. Therefore, this has been created to reduce the risk of adverse consequences associated with floods, especially for life and human health, environment, cultural heritage, economic activity and infrastructures. The Directive promotes an approach to long-term planning, divided into three stages, which provide for:
stage 1: preliminary flood risk assessment (to be completed before September 22th, 2011);
stage 2: development of hazard and flood risk maps (before June 22th, 2013);
stage 3: preparation and implementation of management plans for flood risk (before June 22th, 2015).
The legislation provides that the elements set out in the flood risk management plan (stage 1, 2 and 3) be periodically reviewed and if necessary updated, even taking into account the likely impacts of climate change on the occurrence of floods. Therefore the updating of the Directive is cyclical, being provided a first review of the preliminary risk assessment to 2019, the hazard maps to 2021 and the management plan in 2021, and thereafter every 6 years.
1.2.2.Laws and institutions for the governance of stormwater in Italy
In Italy, agencies involved in stormwater management are the Basin Authority (Autorità di Bacino) and Land Reclamation Authorities (Consorzi di
Bonifica). The first, introduced by Law No. 183 of 18 May 1989 - Rules for the organizational and functional restructuring of soil conservation - are joint bodies, made up of state and the regions, operating on river basins, considered as unitary systems. Basin Authorities address their actions to protect the soil and the subsoil, to rehabilitate the waters, to use and to management of water resources and to protect environmental aspects, regardless of administrative boundaries. They are delegated to the development of appropriate Basin Plans (Piani di Bacino), that are knowledge, regulatory, technical and operational tools by which actions, aimed at conservation, protection and enhancement of the soil and at correct use of water, are planned, based on the physical and environmental characteristics of the concerned area. Land Reclamation Authorities, which are still regulated by the Royal Decree of February 13, 1933 No. 215, are public bodies responsible for the management of public works, with the aim of making it arable land through irrigation and of making urban areas secure, otherwise subject to flooding or landslides.
To meet the wording of the Water Framework Directive (Directive 2000/60/EC) and those as they're going to fit into the framework it outlined, as the Directive "Floods" (Directive 2007/60/EC ), the Italian legislature, with the Legislative Decree 152/06, makes a radical reorganization of the previously set by Law 183/89, dividing the country in just eight river basin districts: Eastern Alps, Po, Northern Apennines, the Serchio (pilot district), Central Apennines, Southern Apennines, Sicily and Sardinia.
The responsible authority is the Basin Authority District and the Regions, in coordination with the National Department of Civil Protection. Because the District Authority has not yet been established, it was determined that the biggest Basin Authorities and the Regions to ensure fulfillment of the obligations the Directive.
From the above it is evident excessive fragmentation and overlapping competencies, with deleterious effects on the implementation of actions for risk mitigation and stormwater management.
1.2.3.Excellences in other member countries
In the UK, the management of rainwater is regulated by several laws, including the recent Flood and Water Management Act of 2010. The law introduces the concept of "flood risk management" instead of "flood defense" and encourages, among other things, the adoption of sustainable drainage systems, introducing the obligation of flood care design for new buildings and redevelopment projects, removing the automatic right to connect to the sewer system. An interesting innovation was introduced in England and Wales with the Code for sustainable homes, introduced in 2008 as a national standard for
sustainable design and construction of new houses. The Code measures the sustainability of houses of nine design categories, including runoff of surface waters, and recognizes the value of sustainable drainage techniques to ensure that the drainage capacity of the site must remain unchanged after urbanization, encouraging through this the use of a credit policy. In Scotland, a similar approach was used to ensure that stormwater is effectively managed and the rules applied in a consistent manner: the Water Environment and Water Services (WEWS) Act of 2003 has made mandatory the use of drainage systems sustainable for all new settlements, with the adoption of a partnership that involves planners, local authorities, water authorities, the Scottish environmental Protection agency, the local population and non-governmental organizations.
Germany has always been a pioneer in the regulation of sustainable urban activities, with the enactment by the ATV-DVWK (the association that also takes care of all aspects related to wastewater, waste and soil protection) of some very specific standards, such as the A 105 "Choice of drainage systems" and the ATV-DVWK-M 153 "Recommendations for the treatment of rainwater. ―These rules have allowed the realization of paradigmatic interventions such as PotsdamerPlatz in Berlin, considered among the best examples of European technological and formal solutions. The general legislation on water production was national until 2006, when a constitutional amendment made independent the federal legislation on this subject.
Finally, Copenhagen is the first in Europe for environmental policies and rainwater management. It is estimated that the rains on the Danish capital will grow by 30-40% by 2100, while the rise in water level can exceed 60 cm within the next decade. To effectively respond to increased precipitation and sea level rise, for the management of stormwater Copenhagen has developed a specific section within the General Plan climate of the city. This provides various facilities, including catch basins of wastewater and stormwater, drainage and sustainable urban systems that can mitigate the effects of climate change and ensure better resilience in populated areas. In order to slow down stormwater runoff it has planned to distribute permeable areas everywhere, including small gardens and green roofs, which can absorb up to 60% of rainwater, while the coverage of buildings facades through vertical vegetation contribute to the improvement of the air quality and cooling by reducing the heat island effect, and at the same time constitute a useful continuation of the ecological network in urban areas.
Chapter 2
Urban flood mitigation
Hazard mitigation encompasses the range of advance measures taken to avoid, reduce, or eliminate the long-term risk to human life and properties from natural hazards (FEMA 2000a). Mitigation is proactive rather than reactive. Rather than simply waiting for an extreme event and then trying to respond, mitigation planners estimate vulnerability to hazards and take anticipatory actions to lessen risk and exposure.
Traditional hazard mitigation protects people, property, and the environment from the destructive impacts of hazards in a number of ways (Godschalk et al. 1999). According to Jha (2011) it is possible to count almost 200 different types of flood risk mitigation measures. The most common classification divides flood risk mitigation systems into two main categories:
SAMs (Structural-Hard-Measures);
NSAMs (Non-Structural-Measures).
The first category belong all hydraulic engineering works such as dams, embankments, drainage systems, stilt houses, flood proofing, etc...While NSAMs are all systems that do not require modification of drainage system such plans, legislation, insurance and social conscience. Furthermore, these two categories can be classified as collective measures, if they aim to protect a specific area, or individual measures, if they defend individual property.
2.1.
Flood mitigation measures
In recent years, this classification has been overcome to another one which tends to empower all individuals living in the territory. The principle on which is based this new classification is directly derived from ecology. Especially the urban area is now assimilated to a habitat that although perturbed can return to the status of pre-disturbance or can achieve a new balance with a minimum loss for who lives in it and without significant outside assistance. According to
Bowker, 2007, measures to mitigate flood risk in urban areas can be classified as:
avoidance measures;
resistance measures;
resilience of the existing system;
forecasting measures.
From this type of scheme some interventions whose function is not primarily flood mitigation are excluded: these are maintenance works. The maintenance of a drainage system can be considered as ―extraordinary‖ if it resets of a structural damage, or as ―ordinary ―if the drainage system can be restored by cleaning and/or resetting of the components out of place. It has been shown that the only maintenance of the drainage system is able to solve many crises of the drainage system. The major disadvantage of this procedure is still the inability to make the network flexible to floods caused by climate change or by later waterproofing of a basin part. Therefore even if these measures are necessary for the correct operation of the drainage network in many cases are not able by themselves to protect a city.
2.1.1.Avoidance measures
Measures and techniques aimed at mitigating flood risk by building or re-design the drainage system belong to the first category. Construction of a new drainage system is justified for developing cities and for those that still do not have an adequate wastewater treatment system. As other examples, the remediation of wetland or the regimentation of waterways closed to the city can also be considered. In recent years new drainage works to make the system more sustainable through redesign have been also developed. These works are called SUDS (Sustainable Urban Drainage Systems) and aim to:
partial recovery of soil permeability by placing porous paving or asphalt;
increase the retention capacity on the surface, with lamination effect of the flood wave by construction of detention basins for stormwater;
increase the infiltration capacity of stormwater through the establishment of draining trenches or grassy ditches;
increase the evapotranspiration surface by installing green roofs.
SUDS are meant to keep outflows away from buildings without demolishing the original drainage system. These measures inside already shaped cities are considerable difficult due to the lack of space and the high cost.
2.1.2.Resistance measures
Resistance measures are installed to prevent floodwater from reaching or entering a property. Temporary resistance measures are typically designed to cover building apertures, i.e. doors, airbricks (Table 2.1). These measures are able to resist at high water level (up to 1 m) but need to put in place in time. Thus they are not suitable for flash flood events without forecasting measures. Permanent resistance measures are normally of the form of walls which surround properties or communities, or are applications or additions to the fabric of the building (Table 2.2). In generally, permanent measures are only used for low depth (less than 300mm) and short duration floods.
Table 2.1: Temporal resistant measures (costs refer to a semidetached house).
Measure Flood type Costs (k€) Benefits Potential difficulties
Free standing barriers River flood < 1.5 m, urban flash floods, sewer flooding 7 - 15.0 (detached house) Community protection, some accredited barriers, prevents floodwater reaching property.
Require adequate flood warning to deploy store and maintain. These are general defenses rather than for individual properties Door
guards and airbrick covers
Urban flash floods, river floods < 1 m, duration hrs – day sewer flooding
2.5 - 5.0 Rapid deployment, bespoke designs.
Temporary, relatively few proven in floods, requires storage, maintenance and deployment by owner, often permanent fittings to building
Flood skirts
Urban flash floods, river floods < 1 m, duration hrs – days sewer flooding, groundwater
12.5 - 44.0 Covers building fabric, permanent housing for skirt, occupant may not need to move out, used successfully with impermeable walls
Suitable for detached buildings only, temporary, sustainability not proven,
requires storage,
maintenance and
deployment by owner, extensive below ground work needed
Sump and pumps
Urban flash floods, river floods < 1 m, duration hrs – days sewer flooding, groundwater
0.06 – 3.0 If fitted correctly and of sufficient capacity can remove floodwater in an emergency.
Must be positioned and sized correctly. May require external or ancillary power supply
Although the resistance measures are important for the mitigation of flood risk in some cases, these systems may not be a winning strategy at all. The main disadvantage is the uncertainty of heights that the barriers must have. Therefore designers and urban planners have recently proposed resilience measures that are based on consideration that a flooding may be occurred but also that in its passage it involves the least possible damage. In the next paragraph basic
principles of resilience in hydraulics and the most common interventions are presented.
Table 2.2: Permanent resistant measures (costs refer to a semidetached house).
Measure Flood type Costs
(k€)
Benefits Potential difficulties Automatic
barriers (door /gate opening)
River floods < 1.5 m, urban flash floods
10.0 – 22.5
Automatic; unobtrusive, use for flood depths up to 1.5 m, 0.6 m on property level, use for doors, gates or community barriers;
Expensive, may be safety issues for domestic use, requires substantial below ground work, specialist maintenance required
Low bund River flood<1 m Community
protection, prevents floodwater, reaching property
Require risk assessment and design to prevent breaching, or overtopping, requires below ground work, may increase flood risk Boundary
walls, fences, resistant gates
Urban flash floods, river floods < 1.2 m, duration hrs – day 4.5 – 2.5 3.0 - 5.5 Prevents floodwater reaching property proven in floods, aesthetic designs
May affect flood risk to neighbors
Raised thresholds
Urban flash floods, river flood < 300 mm, duration hrs – day, sewer flooding
1.5- 1.8
Occupant may not need to move out
Disabled access may not be possible
Stormporch Urban flash floods, river flood < 300 mm, duration hrs – day, sewer flooding
7.0– 7.5
Occupant may not need to move out
Disabled access may be difficult
External wall render and facing
Urban flash floods, river flood < 600 mm, duration hrs – months, sewer flooding
1.5- 2.5
Occupant may not need to move out, prevents floodwater entering property
Good quality workmanship essential wall preparation and regular maintenance essential
Airbrickelev ation
Urban flash floods, river flood < 300 mm, duration hrs – day, sewer flooding
3.0 - 3.7
Proven in floods Floodwater will enter cavity or beneath floor if used for floods > 300 mm, not to be used in isolation
Integral automatic airbrick
Urban flash floods, river flood < 300 mm, duration hrs – day sewer flooding
1.7 – 2.0
Automatic Novel, not proven in floods, good workmanship essential
External doors
Urban flash floods, river flood < 600 mm, duration hrs – days sewer flooding 0.9- 3 Proven in floods, aesthetic designs, reduces flood ingress and damage
Access may be a problem during long duration floods, may be difficult to may need maintenance to ensure effective seal
2.2.
Urban resilience
Futurist theorist Harold Foster (2002) has proposed 31 principles for achieving resilience. He organized them according to several categories: general systems, physical, operational, timing, social, economic, and environmental. According to Foster, resilient general systems are independent, diverse, renewable, and functionally redundant, with reserve capacity achieved through duplication, interchangeability, and interconnections.
Researchers who have studied the response of resilient systems to disasters find they tend to be:
redundant with a number of functionally similar components so that the entire system does not fail when one component fails;
diverse with a number of functionally different components in order to protect the system against various threats;
efficient with a positive ratio of energy supplied to energy delivered by a dynamic system;
autonomous with the capability to operate independently of outside control;
strong with the power to resist attack or other outside force;
interdependent with system components connected so that they support each other;
adaptable with the capacity to learn from experience and the flexibility to change;
collaborative with multiple opportunities and incentives for broad stakeholder participation.
2.2.1.Resilient city
A resilient city is a sustainable network of physical systems and human communities. Physical systems are the constructed and natural environmental components of the city. They include its built roads, buildings, infrastructure, communications, and energy facilities, as well as its waterways, soils, topography, geology, and other natural systems. In sum, the physical systems act as the body of the city, its bones, arteries, and muscles. During a disaster, the physical systems must be able to survive and function under extreme stresses. If enough of them suffer breakdowns that cannot be repaired, losses escalate and recovery slows. A city without resilient physical systems will be extremely vulnerable to disasters.
Human communities are the social and institutional components of the city. They include the formal and informal, stable and ad hoc human
associations that operate in an urban area: schools, neighborhoods, agencies, organizations, enterprises, task forces, and the like. In sum, the communities act as the brain of the city, directing its activities, responding to its needs, and learning from its experience. During a disaster, the community networks must be able to survive and function under extreme and unique conditions.
If they break down, decision making falters and response drags. Social and institutional networks exhibit varying degrees of organization, identity, and cohesion. Just as engineers analyze the fragility of physical structures under stress, social scientists seek to develop ‗‗fragility curves‘‘ for organizations under stress (Zimmerman 2001). A city without resilient communities will be extremely vulnerable to disasters.
Resilient cities are constructed to be strong and flexible, rather than brittle and fragile. Their lifeline systems of roads, utilities, and other support facilities are designed to continue functioning in the face of rising water, high winds, shaking ground, and terrorist attacks. Their new development is guided away from known high hazard areas, and their vulnerable existing development is relocated to safe areas. Their buildings are constructed or retrofitted to meet code standards based on hazard threats. Their natural environmental protective systems are conserved to maintain valuable hazard mitigation functions. Finally, their governmental, nongovernmental, and private sector organizations are prepared with up-to-date information about hazard vulnerability and disaster resources, are linked with effective communication networks, and are experienced in working together.
Resilience is an important goal for two reasons. First, because the vulnerability of technological and social systems cannot be predicted completely, resilience—the ability to accommodate changes gracefully and without catastrophic failure—is critical in times of disaster (Foster 1997). If we knew exactly when, where, and how disasters would occur in the future, we could engineer our systems to resist them. Since hazard planners must cope with uncertainty, it is necessary to design cities that can cope effectively with contingencies.
Second, people and property should fare better in resilient cities struck by disasters than in less flexible and adaptive places faced with uncommon stress (Bolin and Stanford 1998; Comfort 1999). In resilient cities, fewer buildings should collapse. Fewer power outages should occur. Fewer households and business should be put at risk. Fewer deaths and injuries should occur. Fewer communications and coordination breakdowns should take place.
2.2.2.Flood resilience evaluation
The resilience of a city is absolutely linked to the condition of environment and treatment of its resources; therefore the concept of sustainability is central to study of resilience. An environment stressed by unsustainable practices may experience more severe environmental hazards. For example, reduction of urban green was a factor in increasing the flooding hazard. This approach helps in the selection of variables to be analyzed as indicators of resilience but leaves open the choice of the space-time dimension for resilience evaluation. For example the flooding road can cause a blockage of circulation in a small scale, an interruption of services in a medium scale, a loss of profit in a larger scale. In addition to scale, the rates of onset of the initiating event are another confounding issue in resilience evaluation. In urban areas the rates of onset of the crisis are less than the minimum time of evacuation (about 1-2 hours). So in the evaluation of resilience the variables that take into account forecasting measures of the event are also provided (Cutter et al., 2008).
The majority of assessment resilience techniques are quantitative and use selected indicators or variables as proxies since it is often difficult to quantify resilience in absolute terms without any external reference with which to validate the calculations (Schneiderbauer and Ehrlich, 2006). As a result, indicators are typically used to assess relative levels of resilience, either to compare between places, or to analyze resilience trends over time. Important criteria for indicator selection include validity, sensitivity, robustness, reproducibility, scope, availability, affordability, simplicity, and relevance (Birkmann, 2006b; de León and Carlos, 2006). The most important of these is validity, which answers to the question of whether the indicator is representative of the resilience dimension of interest. Another important criterion is robustness, a characteristic that many of the existing vulnerability indices, for example, exhibit significant shortcomings (Gall, 2007). Several criticisms of the quantitative indicator approach have been noted by researchers, including subjectivity regarding variable selection and weighting, lack of availability of certain variables, problems with aggregation to different scales, and difficulties validating the results (Luers et al., 2003; de León and Carlos, 2006). However, the usefulness of quantitative indicators for reducing complexity, measuring progress, mapping, and setting priorities makes them an important tool for decision makers.
De Bruijn (2004) proposes a method to assess the resilience of the towns near lowland rivers. By describing the system response for rainfall or runoff events the following indicators have been chosen:
amplitude of response;
recovery rate from flood impacts.
The amplitude of the reaction to flood waves indicates the severity of the expected damage resulting from a certain flood wave immediately after a flood has occurred. To describe the severity of the reaction of a system to a whole regime of flood waves by only one number, the expected annual damage can be used. Hence, quantifying the amplitude requires data on the flood regime and on the corresponding primary direct flood impacts. Primary direct tangible damage can be determined by applying the unit-loss method. This method quantifies damage per unit by using relationships between flood parameters such as flood depth and the damage for typical land use types or properties (Penning-Rowsell and Green, 2000). Instead intangible damage is correlated with the number of casualties (deaths) in the flooded area. Two indicators for amplitude have been developed:
the expected average annual tangible damage (eq. [2.1]);
the expected average annual number of casualties (deaths) (eq. [2.2]);
∫ ( ) [2.1]
∫ ( ) [2.2] with EAD is the expected average damage per year ($/year), EANC is the expected average number of casualties per year (number/year) and f is the annual frequency (year−1).
The graduality indicator is calculated by expressing all discharges and damages in percentages of the total range considered. This range includes all discharges from the once a year discharge to the discharge with a probability of 1/10,000 a year and the corresponding damages. The graduality is derived from the relationship between the discharge increase in percentages and the damage increase in percentages (eq. [2.3]).When the increase of damage is exactly proportionate to the increase of discharge, the graduality is 1. The graduality will have a value close to zero when damage increases suddenly due to a small discharge increase. ∑| | [2.3] 0 ( ) 1 0 ( ) 1 [2.4] 0 ( ) 1 0 ( ) 1 [2.5]
G is the graduality (−),Q is the discharge (m3/s), Qmaxis the once in 10,000
function of Q, Smax = S(Qmax), Smin =S(Qmin), Q‘ is the percentile discharge (−)
and S‘ is the percentile damage (−).
The third aspect, recovery rate, describes the rate of return from a state where flood impacts are clear to a normal state. Because effects of floods are usually not distinguishable from impacts of other events and trends such as population growth, financial crises, war and diseases (Alberla-Bertrand, 1993) the direct measurement of recovery is not possible. However, some characteristics of society, households and individuals may be regarded indicative for their capacity to recover. These characteristics are studied in so-called vulnerability assessments in social science. The vulnerability of a community to floods depends on its susceptibility to flood impacts and its recovery capacity. Literature on vulnerability and vulnerability assessments can thus be used as a source of information for recovery. Vulnerability assessment can distinguish three groups of factors that influence the recovery rate: physical, economic and factors.
The physical factors determine how fast the water will be gone and when the area dries up again.
The economic factors determine the ability to get hold of enough money for repair and reconstruction, and for returning to pre-disaster or even improved living conditions, as well as to prevent further spreading of effects.
Social factors that determine the ability to organize reconstruction and get access to funds and information are first of all related to the larger social context in which the flood occurs. Examples of such factors are the political structure and the presence of strong social networks.
A qualitative approach is chosen in which all factors are given marks between 1 and 10 after which they are averaged.
However this methodology strongly depends on the types of damage data collected. Moreover the scores attributed to the recovery rate are arbitrary and dependent on the type of town. Finally, it does not solve the problems of spatial scale previously highlighted.
Batica (2013) proposes an approach that analyzes all flood risk management component (relief, resist, response, recovery and reflect) at different spatial scales.
Urban system is divided into four entities: city, district, block and parcel. For each of these entities the FRI (Flood Resilience Index) is calculated. The Index is represented as a level of flood resilience assessment in the analyzed area and for certain flood characteristics. The assessment of FRI on the parcel and block is focused on the building. For these two cases urban functions are evaluated through the assignment of an availability level during and after flood.
Tables 2.3, 2.4 and 2.5 show the meanings attributed to availability levels and the urban functions considered respectively.
Instead on district and city scale the evaluation of FRI is done through five dimensions (natural, physical, economic, social and institutional).A score is assigned to each of these dimensions, the Aggregate Weighted Mean Index or AWMI, calculated using Weighted Mean Index (WMI) method (Rajib Shaw and IEDM Team, 2009), which represents the FRI.
Table 2.3: Availability levels of urban functions.
Availability
level Description
0 Not available
1 Poor availability – major interruptions
2 Low availability – interruptions provide minimum availability
3 Medium–small interruptions that are tolerable for small flood durations 4 Medium-high – interruptions that are tolerable for long flood durations 5 Requirement fully provided
Table 2.4: Urban functions for parcel and building flood resilience evaluation.
External services Energy Water Waste Communication Transport Internal services Food availability
Occupation of urban functions Access to urban functions
Table 2.5: Types of variables considered for district and city flood resilience evaluation.
Dimension Variables
Natural Available water bodies, percentage of existing slope or flat areas, drainage density, rainfall duration, existing watershed.
Physical Structural measures protection, communication network (telephone, internet, transport…), human safety (ex. emergency shelter), equipment for service.
Economic Employment, wealth, private and public investment. Social Health status, knowledge, flexibility.