European Commission 6
Framework
Programme, Project no. 032055
FOSRIN
Food Security through Ricebean
Research in India and Nepal
Deliverable 1.2: Report on a consumer preference index for ricebean
Doreen Buergeldt, Rolf AE Mueller and Matthias von Oppen Christian Albrechts University, Kiel, Germany
Executive summary
The rural population in India and Nepal depend on a range of little known crops for their food security. There have been few efforts of scientists to improve the yield of these “orphan crops” by breeding. The potential role of orphan crops, using the example of ricebean, in improving the food security of rural poor in both countries was one focus of this project. To popularize ricebean and promote its usage, breeders aspire to develop an improved ricebean variety.
Usually, an improved variety should have higher yields but further improvements were desired for ricebean. Ricebean is highly heterogeneous in its appearance (colour, form and seed size) and also the insights gained from scientific articles about its nutritional composition were inconsistent. Thus, it was necessary to identify an instrument that reveals the relevant characteristics of ricebean to develop a variety which is accepted by Indian and Nepalese consumers. The benefit that the rural population would gain from an improved variety and the acceptance in markets would probably be enhanced by a ricebean variety with higher yield and meeting consumers’ preferences.
Earlier, we used hedonic price analysis to determine the relevant characteristics at reasonable costs and time inputs. It has been applied several times to identify relevant characteristics of food, and also to derive implications for breeding. The hedonic price analysis assumes that price differences of products, such as ricebean emerge due to varying quantities of quality characteristics that are relevant for consumers. The influence of characteristics on market prices was estimated by multivariate regression analysis with price as dependent variable and the objectively measured characteristics as independent variables. Price and the independent variables were entered in logarithmic form. This allows interpretation of the calculated coefficients of significant characteristics as price elasticities. The price elasticity of a characteristic indicates the price change if the considered characteristic is increased by 1%. The elasticities can be used by breeders to assess ricebean varieties and are combined into an index, referred to as Consumer Preference Index (CPI).
The hedonic price function for both countries could explain 60% of the price variations. Characteristics that significantly influence the price and that are relevant for consumers are seed size, and the content of crude fibre, protein as well as fat.
These four characteristics were used for the CPI calculator to evaluate ricebean varieties. The CPI calculator is available on the FOSRIN project website at http://www.ricebean.org.
iii Series Editor: PA Hollington
For more information or further copies of this report, please contact:
Dr Philip Hollington, CAZS Natural Resources, College of Natural Sciences, Bangor University, Bangor LL57 2UW, Wales, UK.
Email: [email protected] Website: www.ricebean.org
or
Dr Krishna Joshi, CAZS Natural Resources, South Asia Office, c/o CIMMYT, P.O. Box 5186, Singh Durbar Plaza Marg, Bhadrakali, Kathmandu, Nepal
Email: [email protected]
FOSRIN Reports in this series
1. Distribution of ricebean in India and Nepal. Gautam, R; Kumar, N; Yadavendra, JP; Neog, SB; Thakur, S; Khanal, A; Bhandari, B; Joshi, KD and Hollington, PA, (2007)
2. Identification of polymorphic markers. Bajracharya, J, Singh, S, Dangol, B, Hollington, PA and Witcombe, JR (2008)
3. Nutritional qualities of ricebean. Andersen, P (2007)
4. Farmers’ local knowledge associated with the production, utilization and diversity of ricebean (Vigna umbellata) in Nepal. Khanal, AR, Khadka, K, Poudel, I, Joshi, KD and Hollington, PA (2009)
5. Ricebean food preparation and diets. Andersen, P Kumar, N and Acharya, BP (2009) 6. Health and nutrition impacts of ricebean. Andersen, P (in preparation, 2010)
7. Molecular marker diversity in Nepalese and Indian ricebean germplasm. Bajracharya, J; Singh, S; Dangol, B; Hollington, PA & Witcombe, JR (2010)
8. Hedonic Price Function for ricebean. Buergelt, D; Mueller, RAE, Yadavendra, JP & von Oppen, M (in preparation, 2010)
9. Consumer preference index for ricebean. Buergelt, D; Mueller, RAE & von Oppen, M (in preparation, 2010)
10. Strategy to introduce ricebean into the supply-chain. Buergelt, D; Mueller, RAE & von Oppen, M (in preparation, 2010)
All are available at www.ricebean.org/publication.htm
This work is licenced under the Creative Commons Attribution-Non-Commercial-No Derivative Works 3.0 Unported License. To view a copy of this licence, visit http://creativecommons.org/licenses/by-nc-nd/3.0/ or send a letter to Creative Commons, 171 Second Street, Suite 300, San Francisco, California 94105, USA.
Correct citation: Buergelt, D; Mueller, RAE & von Oppen, M (2010) Food Security through Ricebean Research in India and Nepal (FOSRIN). Report 9. Consumer preference index for ricebean. (Ed. PA Hollington). Kiel, Germany, Christian Albrechts University and Bangor, UK, Centre for Advanced Research in International Agricultural Development (CARIAD), Bangor University.
This document is an output from the project Food Security through Ricebean Research in India and Nepal (FOSRIN), funded by the European Commission under the 6th Framework Programme contract 032055. The
opinions therein are those of the authors and may not be taken as representing those of the European Commission.
Contents
Executive summary... ii 1. Introduction...1 2. Background...1 3. Methodology...2 4. Results...24.1. Interpretation of estimated coefficients ...2
4.2. The consumer price index for ricebean ...3
4.2.1. The CPI calculator ...4
5. Conclusion and discussion...5
6. References...5
List of Tables
4.1 Consumer preference index for ricebean, Jorhat, Assam ...34.2 Consumer preference index for ricebean, Palampur, HP...4
List of figures
4. CPI for five Indian ricebean varieties ...41
1 Introduction
Ricebean (Vigna umbellata) is an underutilised grain legume grown in marginal hill areas in India and Nepal. It is found in many parts of Nepal and in the Indian states of Uttarakhand, Himachal Pradesh, Assam, Orissa, Madhya Pradesh and Chhattisgarh, often intercropped with maize. Areas where the ricebean is grown today are often remote in respect of access to markets and prevalence of subsistence households. Ricebean grows well on many soils, and exemplifies pest resistance as well as the potential for good yields of nutritious fodder for animals and high quality grain. There are no established marketing channels, and seed supply is also limited or non-existent. Thus, farmers who grow ricebean have to use their seeds from the previous year.
Ricebean and similar species are known as ‘orphan’ or ‘underutilised’ crops. They are i) locally plentiful but globally rare, ii) there is little scientific information and knowledge about them available and iii) their current use is limited, relative to their economic potential (Gruere et al., 2007). Many of these orphans have a high potential to be improved by breeding as a mean of generating food and sustainable income for the local producers and chain actors. Ricebean is an orphan crop that has received little scientific attention, so no enhanced varieties exist. It has fallen far behind the major pulses regarding area and produced quantity in India and Nepal. Disadvantages such as low yield and high labour inputs in comparison to e.g., green gram (V. radiata) and black gram (V. mungo) have resulted in a decrease of the area planted with ricebean. We describe the development of an index, the Consumer Preference Index (CPI), which can be used by plant breeders to put a monetary value to the traits for which they are breeding, and so target consumer preferences directly. An earlier document (Buergelt et al., 2010) described the development of a Hedonic Price Function to categorise the value of particular traits to consumers, and should be read in conjunction with the current work. Other documents in this series describe ricebean’s distribution in Nepal and India (Gautam et al., 2007), indigenous knowledge on the crop (Khanal et al., 2009), molecular aspects (Bajracharya et al., 2008) and its importance in diets and nutrition (Andersen, 2009; Andersen et al., 2009).
2 Background
As the hedonic price analysis provides implicit prices for characteristics of a product it is possible to identify consumer-relevant characteristics that can be used to improve varieties by breeding. Von Oppen (1978) was the first to define plant breeding goals by applying hedonic estimation. He developed a preference index to evaluate the acceptance of new food grains. Unnevehr (1986) used implicit prices of grain characteristics to evaluate rice-breeding goals in Thailand, Indonesia and the Philippines. She used the model from Ladd and Suvannunt, which implies that all products are consumed for the utility they provide and that the utility depends on the characteristics of a product. Rice samples were collected of each grade sold by a retailer combined with name and price, and analysed in a laboratory. The implicit prices of the grain quality characteristics represent the change in rice price if the considered characteristic changes for one unit. Determined results were that the demand for milling quality is similar in Thailand, Philippines and Indonesia but demand for grain shape and some chemical characteristics, such as per cent share of amylose, varies. Therefore international breeding should concentrate on good milling quality and reduced amylose content.
In the case of this orphan crop ricebean, there are two main breeding goals. First, poor farmers in remote areas should benefit from an improved ricebean variety with higher yields
and good pest resistance in order to feed their families and animals. Thus, a new ricebean variety has to fit within farmers’ agronomic and taste preferences. In the second place, farmers should be able to leave their subsistence level and sell the ricebean at markets thereby producing income. Consumers, who purchase at markets, will only purchase ricebean which meets their preferences, regardless of agronomic constraints. Thus, there has to be a compromise between breeding to secure better yields and other agronomic aims and the preferences of consumers which can include farmers and non-farmers.
3. Methodology
Consumer’s preferences were captured by estimating a hedonic demand function (Buergelt et al., 2010), based upon the analysis of samples from a number of markets in Nepal and India. From this, we were able to calculate the price variation caused by marginal and absolute variation in the amount of various characteristics, and estimate the price of new products that are variations of already existing products by assessing the implicit prices of characteristics and multiplying these prices with the amount of the considered characteristics (Brockmeier, 1993).
We used a double-log function, because characteristic’s coefficients can be interpreted as their elasticities. Thus, the results can be used as an index for breeders to asses the value of a new ricebean variety ex ante.
4. Results
4.1 Interpretation of estimated coefficients
The hedonic price analysis allows the calculation of implicit prices of single quality characteristics because product price variations are explained by the variation of a characteristic. The implicit price of a characteristic is the price difference of two products that are completely identical except of a marginal variation of that characteristic. Thus, the implicit price is equal to the first derivative of the hedonic function (F 1, F 2) in regard to the considered characteristic F 1: pi = pi
( )
zij F 2: j( )
i j i i p z j z p , = δ δwhere pj is the implicit price of characteristic j (j = 1,2,…,n) such as protein.
The regression coefficient βj in the used double-log function (F 3) for the hedonic model represents the elasticity of the product price in regard to the considered characteristic. This coefficient indicates the product price change if the characteristic changes by 1% (Brockmeier, 1993). F 3: ij n j j i z p log log 1
∑
= + =α βThe hedonic model for India and Nepal allowed the effect on price of changes in the measured traits to be assessed (Buergelt et al., 2010). For instance, protein is positively related to price; if protein were increased by one per cent then the price would increase by 0.3%. A 1 % increase in crude fibre would increase the price by 0.4%. If the weight would be increase by 1% then the price raises by 0.4%. If the shape of the seed became longer, by increasing the L/B ratio by 1%, than the price would increase by 0.5%. However, the mean
3
value of fat content in the samples was 0.4%, and the fat coefficient (0.1) was small, so although fat is a preferred trait an increase has only a little impact on the price. The coefficients of black and grey were even smaller than the coefficient of fat. Grey is negatively related to the price, i.e. decreasing the share of grey ricebean would increase the price.
4.2 The consumer preference index for ricebean
As the hedonic price analysis calculates implicit prices of characteristics it is possible to evaluate consumer preferences for a new ricebean variety. The elasticities can be used to develop a Consumer Preference Index (CPI). With this index breeders can assess the expected price of an improved ricebean variety at an early stage in plant breeding as quantities of 100 to 200 grams are sufficient to calculate the CPI.
The following section includes an evaluation of promising ricebean varieties selected by plant breeders by assessing their economic value. Selected ricebean varieties from two regions in India were analysed for their seed weight and protein content. Jorhat in Assam state in the north east of India, and contributed 9 promising varieties. Palampur in Himachal Pradesh provided three.
The CPI for each variety can be calculated as follows:
F 4: CPI i =β1zi1 +β2 zi2
where i represents the variety, β1 is the coefficient of seed weight, zi1 is the seed weight of a variety, β2 is the coefficient of protein and zi2 is the amount of protein of a variety.
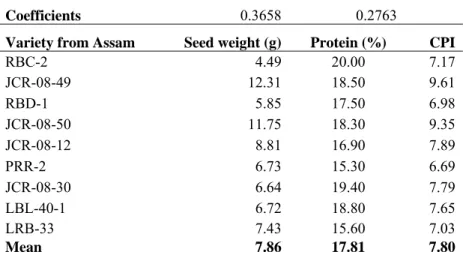
Table 4.1 shows the evaluation of varieties from Jorhat. If only seed weight and protein are included in the index then the most preferred varieties which should be used for further breeding in are JCR-08-49, JCR-08-50, and JCR-08-12 because these have an index above the average of 7.8.
Table 4.1: Consumer preference index for ricebean varieties of Jorhat, Assam, India. Coefficients 0.3658 0.2763
Variety from Assam Seed weight (g) Protein (%) CPI
RBC-2 4.49 20.00 7.17 JCR-08-49 12.31 18.50 9.61 RBD-1 5.85 17.50 6.98 JCR-08-50 11.75 18.30 9.35 JCR-08-12 8.81 16.90 7.89 PRR-2 6.73 15.30 6.69 JCR-08-30 6.64 19.40 7.79 LBL-40-1 6.72 18.80 7.65 LRB-33 7.43 15.60 7.03 Mean 7.86 17.81 7.80
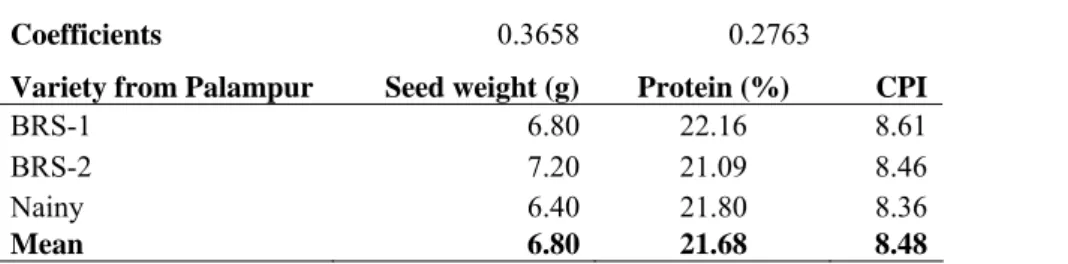
Table 4.2 shows the Palampur varieties with their seed weights and protein contents. The variety that has the highest index and is most preferred by consumers due to its characteristics is BRS-1. BSR-1 is the only Palampur variety that has an index above the average of 8.48. If breeders were to use this variety for further breeding they would possibly get a ricebean which is liked better by consumers than the other varieties.
Table 4.2: Consumer preference index for ricebean varieties from Palampur, Himachal Pradesh, India. Coefficients 0.3658 0.2763
Variety from Palampur Seed weight (g) Protein (%) CPI
BRS-1 6.80 22.16 8.61
BRS-2 7.20 21.09 8.46
Nainy 6.40 21.80 8.36
Mean 6.80 21.68 8.48
4.2.1 The CPI calculator
To enable the easy comparison of ricebean varieties that could be chosen for breeding, a program was written in JavaScript. JavaScript is an object-oriented scripting language used to enable programmatic access to computational objects within a host environment. It is implemented as part of a web browser and offers enhanced user interfaces and dynamic websites. JavaScript was designed to be easier for non-programmers to work with compared to Java (Unknown, 2010).
The CPI can be calculated by breeders by using via an internet browser, such as Firefox or Internet explorer to run the program. The program facilitates to enter the values of the characteristics that were found to influence the price of ricebean. These relevant characteristics are crude protein (%), crude fibre (%), fat (%) and in seed weight (g/100 seeds). The program allows comparison of five ricebean varieties at the same time. Further, limits in form of minimum and maximum values for each characteristic were determined to avoid errors while entering the values.
Figure 4.1 shows a screenshot of the program. The characteristics of the best three ricebean varieties from Assam, JCR-08-49, JCR-08-50, and JCR-08-12, and the best two from Palampur, BRS-1 and BRS-2 were entered. Values for the characteristics crude fibre and fat are missing for those five ricebean varieties. Thus, a value of one was entered for crude fibre and fat for all five varieties to allow a comparison. As consequence, the calculated CPI’s in Figure 8 cannot be compared to CPI’s for which all four characteristics were determined.
Figure 4.1: CPI for five Indian ricebean varieties from Assam and Palampur.
The CPI calculator evaluates these five ricebean varieties with respect to the present amounts of crude protein, crude fibre, fat and seed weight that are preferred by consumers. The most
5
preferred ricebean variety of these five would be JCR-08-49, followed by JCR-08-50 and BRS-1.
The CPI calculator is freely available on the website of the FOSRIN project at http://www.ricebean.org.4
5 Conclusion and discussion
The adequacy of a commodity for a particular use depends on its quality that is defined by quality characteristics. The perception and preferences of consumers influences which characteristics are defining the product quality. Only characteristics that relevant for consumers influence their purchase decisions. Therefore, additionally to farmers’ needs breeding should consider consumers’ perception of a product quality. The adoption of a new variety in Indian and Nepalese markets is necessary to enable farmers to sell ricebean and thereby generating income.
Additionally, ricebean is very heterogeneous. Ricebean varieties differ in size, colour and nutritional components such as protein content. In view of the large variation in quality, it is important to determine these characteristics that are relevant for consumers to identify the right ricebean varieties that should be used for breeding.
The objective was to provide breeders an instrument to evaluate ricebean varieties with respect to quality characteristics that are relevant to consumers, building on the development of the hedonic price function which allowed us to calculate implicit prices of characteristics which correspond to the price difference of two products that are identical except the considered characteristic. Four quality characteristics i.e. content of protein, crude fibre and fat and seed size were identified to be significantly related to ricebean price.
The results of the hedonic price analysis were transferred into a program, referred to as CPI calculator. This calculator allows breeders to select ricebean varieties because the varieties are evaluated with respect to the significant characteristics. The calculator facilitates an easy evaluation of ricebean varieties at an early stage and small samples of 200 grams are sufficient to assess the characteristics.
Breeding for several characteristics including phenotypic and processing quality is difficult, and time as well as cost consuming. The final evaluation of ricebean does not only depend on the set of significant characteristics. Due to the costs of breeding breeders may only focus on some characteristics. In that case, a new ricebean variety should at best have bold seeds and high protein content. These characteristics should be considered when breeders choose the parents for further breeding in order to increase the probability of consumers’ acceptance.
6 References
Andersen, P (2009) Food Security through Ricebean Research in India and Nepal (FOSRIN). Report 4. Nutritional qualities of ricebean (Ed PA Hollington). Bergen, Norway, Department of
Geography, Universitet Bergen and Bangor, Wales, UK, CAZS Natural Resources, College of Natural Sciences, Bangor University.
Andersen, P, Kumar, N & Acharya, BP (2009) Food Security through Ricebean Research in India and Nepal (FOSRIN). Report 5. Ricebean food preparation and diets (Ed PA Hollington). Bergen,
Norway, Department of Geography, Universitet Bergen and Bangor, Wales, UK, CAZS Natural Resources, College of Natural Sciences, Bangor University.
Bajracharya, J, Singh, S, Dangol, B, Hollington, PA & Witcombe, JR (2008) Food Security through Ricebean Research in India and Nepal (FOSRIN). Report 2. Identification of polymorphic markers. Khumaltar, Nepal: Agriculture Botany Division, Nepal Agriculture Research Council
and Bangor, Wales, UK, CAZS Natural Resources, College of Natural Sciences, Bangor University.
Brockmeier, M (1993) Ökonomische Analyse der Nahrungsmittelqualität. Kiel: Wissenschaftsverlag
Vauk.
Buergelt, D; Mueller, RAE, Yadavendra, JP & von Oppen, M (2010) Food Security through Ricebean Research in India and Nepal (FOSRIN). Report 8. Hedonic Price Function for ricebean. (Ed. PA Hollington). Kiel, Germany, Christian Albrechts University and Bangor, UK, Centre for Advanced Research in International Agricultural Development (CARIAD), Bangor University. Gruere et al., 2007
Khanal, AR, Khadka, K, Poudel, I, Joshi, KD & Hollington, PA (2009) Food Security through
Ricebean Research in India and Nepal (FOSRIN). Report 3. Farmers’ local knowledge associated with the production, utilization and diversity of ricebean (Vigna umbellata) in Nepal. Pokhara,
Nepal, Local Initiatives for Biodiversity, Research and Development, Rampur, Chitwan, Nepal: Institute of Agriculture and Animal Sciences, and Bangor, Wales, UK: CAZS Natural Resources, College of Natural Sciences, Bangor University.
Ladd, GW & Suvannunt, V (1976) A model of consumer goods characteristics. American Journal of Agricultural Economics 58: 504-510.
Unknown, JavaScript. http://en.wikipedia.org/wiki/JavaScript [accessed04.05.2010].
Unnevehr, LJ (1986) Consumer demand for rice grain quality and returns to research for quality improvement in Southeast Asia. American Journal of Agricultural Economics 68: 634-641.
von Oppen, M (1978) A preference index of food grains to facilitate selection for consumer acceptance, ICRISAT, Economic program, Hyderabad, India.