Fraser of Allander Institute (2018) Fraser of Allander Institute : Economic
Commentary [September 2018]. [Report] ,
This version is available at
https://strathprints.strath.ac.uk/65540/
Strathprints is designed to allow users to access the research output of the University of Strathclyde. Unless otherwise explicitly stated on the manuscript, Copyright © and Moral Rights for the papers on this site are retained by the individual authors and/or other copyright owners. Please check the manuscript for details of any other licences that may have been applied. You may not engage in further distribution of the material for any profitmaking activities or any commercial gain. You may freely distribute both the url (https://strathprints.strath.ac.uk/) and the content of this paper for research or private study, educational, or not-for-profit purposes without prior permission or charge.
Any correspondence concerning this service should be sent to the Strathprints administrator:
The Strathprints institutional repository (https://strathprints.strath.ac.uk) is a digital archive of University of Strathclyde research outputs. It has been developed to disseminate open access research outputs, expose data about those outputs, and enable the
Fraser of Allander
Institute
Economic Commentary
4
Outlook and appraisal3
At a glance2
SummaryFraser of Allander Institute
Contents
9
Scottish economy
For regular analysis on the Scottish economy and public nances please see our blog
www.fraserofallander.org
Reappraising Scotland’s exports and their geographies: Brexit and beyond Ronald V. Kalafsky, University of Tennessee and Ross Brown, University of St Andrews
Monetary and fiscal policy in a newly independent Scotland: lessons from the dissolution of Czechoslovakia?
Frantisek Brocek, Department of Economics, University of Strathclyde
Highlighting the need for policy coordination: the economic impacts of UK trade-enhancing industrial policies and their spillover effects on the energy system. Andrew G. Ross, Grant Allan, Gioele Figus, Peter G. McGregor, Graeme Roy, J. Kim Swales, and Karen Turner
Economic perspectives
25
42
53
18
Our forecasts20
Policy contextAfter a sustained period of weak growth and despite ongoing political uncertainty, the Scottish economy has been showing some signs of strengthening.
This trend has continued over the summer.
As we discussed in our last commentary, in recent months we have seen evidence of a short-term pick-up in the rate of economic growth in Scotland. Growth over the year to June 2018 – whilst still below average – was the fastest since late 2014/ early 2015 and the Scottish economy has outpaced the UK for the last two quarters.
While we remain cautiously optimistic, growth is likely to remain below trend for the duration of our forecast horizon.
And overall, the immediate outlook for Scotland’s economy remains highly uncertain.
On the one hand, wages across the UK have started to pick-up, whilst the global economy remains in strong health which should boost Scottish exports. Tourism numbers continue to go from strength to strength. And the majority of measures of business confidence we track have been on the rise, albeit from very low levels.
On the other hand, despite being less than six months from the UK leaving the EU, the lack of clarity on the UK’s future relationship with its largest external market continues to cast a shadow over the outlook.
As a result, whilst we are forecasting – in our base case – growth of 1.3% this year and 1.4% in 2019 and 2020, we would stress the heightened degree of uncertainty around such point estimates at the current time.
Summary
Our forecasts are based upon a broad-based agreement between the UK and the EU. Should this not happen, then our forecasts are likely to change significantly. With so many different factors – both economic and political – about what a ‘no-deal’ may look like, we have not forecast this scenario at this stage. An update will be provided in December when more details are known.
As we have argued before, in our view, a ‘hard-Brexit’ would act as a significant drag on Scotland’s – and the UK’s – economic potential. Many of the impacts, such as weakened supply chains, reduced flow of skilled workers, trade barriers, and lower levels of international investment will set in gradually.
However, it is the risk of a ‘no-deal’ scenario that is of most concern in the immediate term. Whether you agree or disagree with the decision to leave the EU – or the final agreement the UK should negotiate with the EU – the need for an orderly transition is vital.
As both the Chancellor of the Exchequer and the Governor of the Bank of England have agreed, a ‘no-deal’ outcome would cause hardship for many firms, workers and families across the UK.
Sleepwalking into a ‘no-deal’ outcome cannot be viewed as an effective economic plan.
Now is the time for effective and strong leadership from all our political leaders.
Fraser of Allander Institute September 2018
1.4%
20201.3%
1.4%
1.4%
2019 2018 We expect growth to remain below trend.Scottish growth forecast
Unemployment forecast
Job
Market
4.2%
down from 4.3% 20184.2%
down from 4.4% 20194.3%
down from 4.5% 2020Fraser of Allander Institute
At a glance
2018 2019 2020 GDP 1.3% 1.4% 1.4% Production 1.5% 1.6% 1.5% Construction 1.0% 1.1% 1.0% Services 1.2% 1.4% 1.3%Table: FAI forecast Scottish economic growth (%), 2018 – 2020
-0.5% 0.0% 0.5% 1.0% 1.5% 2.0% 2.5% 3.0% Q1 Q2 Q3 Q4 Q1 Q2 Q3 Q4 Q1 Q2 Q3 Q4 Q1 Q2 Q3 Q4 Q1 Q2 Q3 Q4 Q1 Q2 2013 2014 2015 2016 2017 2018 % c h a n g e
Scottish quarterly GDP growth Scottish annual GDP growth (q on q)
Chart: Scottish growth (since 2013) – year and quarter Chart: Employment & unemployment rates, May - July 2018
-2% -1% 0% 1% 2% 3% 4% A n n u a l G V A G ro w th Forecast
Chart: FAI forecast Scottish economic growth range
Employment (16-64) Unemployment (16+) Rate (%) Year Change Rate (%) Year Change Scotland 75.1% 4.1% England 75.8% 4.0% Wales 74.8% 3.8% N. Ireland 69.3% 4.0% UK 75.5% 4.0%
Fraser of Allander Institute
Outlook and Appraisal
As we argued back in June, there have been welcome signs of a gradual pick-up in activity in the Scottish
economy after a sustained period of weak growth. Indeed, the most recent data point to Scotland’s
economy outpacing growth in the UK as a whole. These figures are clearly welcome, although below the
surface businesses are becoming increasingly worried about the costs of a ‘no-deal’ Brexit.
Chart 1: Scottish growth since 2013, year and quarter
-0.5% 0.0% 0.5% 1.0% 1.5% 2.0% 2.5% 3.0% Q1 Q2 Q3 Q4 Q1 Q2 Q3 Q4 Q1 Q2 Q3 Q4 Q1 Q2 Q3 Q4 Q1 Q2 Q3 Q4 Q1 Q2 2013 2014 2015 2016 2017 2018 % c h a n g e
Scottish quarterly GDP growth
Scottish annual GDP growth (quarter on same quarter in previous year)
Source: Scottish Government & FAI calculations
Table 1: Employment & unemployment rates, May - July 2018
Employment (16-64) Unemployment (16+) Rate (%) Year Change Rate (%) Year Change Scotland 75.1% 4.1% England 75.8% 4.0% Wales 74.8% 3.8% N. Ireland 69.3% 4.0% UK 75.5% 4.0% Source: ONS
Chart 2: Scottish economic growth revisions, 2010 — Q1 2018
94 96 98 100 102 104 106 108 110 112 2010 2011 2012 2013 2014 2015 2016 2017 2018 In d e x Q 1 2 0 1 0 = 1 0 0 Previous series Revised series
Source: Scottish Government & FAI calculations
Introduction
The Scottish economy grew by 0.5% in the 3-month period to June 2018 – ahead of the UK for the 2nd consecutive quarter. (Chart 1 and Chart 2)
Growth over the year was the fastest since late 2014/early 2015. Revisions for 2016 and 2017
lifted the o cial growth estimates much closer to
our own forecasts. (Chart 3)
As outlined in June, we are slightly more optimistic about Scotland’s near-term economic prospects than this time last year.
On balance, our central view is that the Scottish economy is showing greater signs of resilience. Why?
First, whilst there is undoubtedly heightened uncertainty around Brexit, many businesses appear to be ‘looking-through’ such concerns and are getting on with day-to-day activities. But this is clearly fragile. And the apparent lack of contingency
planning by many rms is a signi cant concern.
Second, the outlook for oil and gas – and its all-important supply chain – remains more positive than it has been in almost three years.
Third, there are signs that the recent upturn is relative broad-based with most sectors currently posting positive returns.
We forecast that growth will continue at around its current pace for the next 2 to 3 years.
Of course, some of this upturn is cyclical and follows a sustained period of weak growth. The greatest risk to this forecast is from a no-deal Brexit. Whilst not sharing some of the concerns of the most pessimistic commentators regarding the potential negative hit to the economy should this happen,
we do think that a cli -edge scenario would have
serious short-term – and long-term – negative consequences for the Scottish economy.
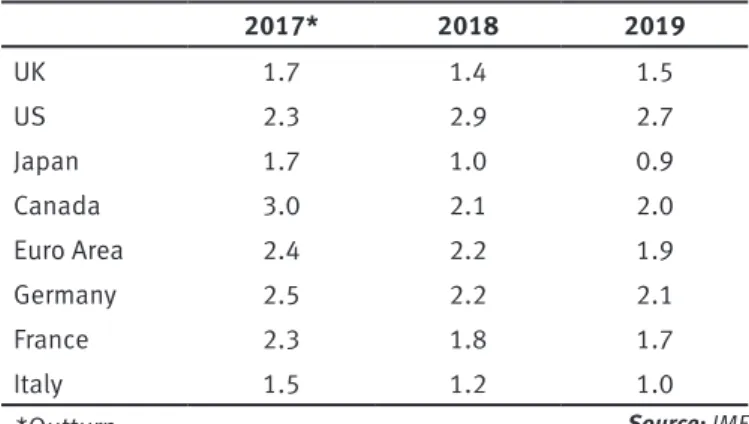
Table 2: IMF forecasts for growth (%), 2017 (outturn) to 2019 2017* 2018 2019 UK 1.7 1.4 1.5 US 2.3 2.9 2.7 Japan 1.7 1.0 0.9 Canada 3.0 2.1 2.0 Euro Area 2.4 2.2 1.9 Germany 2.5 2.2 2.1 France 2.3 1.8 1.7 Italy 1.5 1.2 1.0 Source: IMF
Chart 3: Euro-zone unemployment rate and real GDP since 2006
90 94 98 102 106 110 114 118 0 2 4 6 8 10 12 14 2006 2007 2008 2009 2010 2011 2012 2013 2014 2015 2016 2017 2018 R e a l G D P , In d e x e d , 2 0 1 0 = 1 0 0 U n e m p lo y m e n t ra te ( % )
Euro-zone unemployment rate (LHS) Real Euro-zone GDP (RHS)
Source: Eurostat
Chart 4: Business confidence in the UK’s major markets
94 96 98 100 102 104 2002 2004 2006 2008 2010 2012 2014 2016 2018 N e t b a la n c e ( > 1 0 0 = o p ti m is m )
G7 China US Euro Area
Source: OECD
The global economy
Whilst the pace of growth in the world economy has slowed slightly, particularly in emerging economies, the outlook remains robust.
Most predictions are for world growth to continue to be close to, or slightly above, average over the next couple of years. (Table 2)
The slight easing in world growth seems to re ect a
movement toward a more balanced type of growth,
rather than a more signi cant slowdown.
There has been a gradual shift toward more sustainable drivers of growth such as trade, investment and wages across most major economies.
At the same time, some structural problems – such
as unemployment in Europe – whilst still signi cant,
continue to be slowly addressed. (Chart 3)
Overall sentiment and demand in Europe remains high and well ahead of the UK. (Chart 4)
Across the Atlantic, the US continues to power
ahead driven by more con dent households and
increasing investment. President Trump’s tax cuts
have helped to provide a signi cant scal stimulus.
(Chart 5). US unemployment is on track to fall to its lowest rate in around 50 years.
Without Brexit, such factors would be pointing toward a highly positive outlook for Scottish
exporting rms over the next few months.
Chart 5: Contributions to US growth, Q1 2012 — Q2 2018
-3 -2 -1 0 1 2 3 4 5 6 7 Q1 Q2 Q3 Q4 Q1 Q2 Q3 Q4 Q1 Q2 Q3 Q4 Q1 Q2 Q3 Q4 Q1 Q2 Q3 Q4 Q1 Q2 Q3 Q4 Q1 Q2 2012 2013 2014 2015 2016 2017 2018 A n n u a lis e d g ro w th r a te s ( % c h a n g e )
Consumption Investment Net exports Government GDP
Source: U.S. Bureau of Economic Analysis *Outturn.
Chart 6: Policy rates in UK, US and Europe, 2013 — 2021 -1.0 -0.5 0.0 0.5 1.0 1.5 2.0 2.5 3.0 2013 2015 2017 2019 2021 O ff ic ia l in te re s t ra te ( % )
US Fed Funds Rate
ECB Discount Rate ECB Refinancing Rate
Expectations now BofE Bank Rate
Early summer expectations
Early summer expectations Expectations (now) Expectations now Early summer expectations
Source: Thomson Reuters Datastream & FAI calculations
Chart 7: Bad loans in Europe, 2016 and 2018
0% 10% 20% 30% 40% 50% 60% 70% 0 50 100 150 200 250 300 350 N o n -p e rf o rm in g lo a n s r a ti o N o n -p e rf o rm in g lo a n s ( E u ro s b n )
Non-performing loans [LHS] (2016) Non-performing loans [LHS] (2018) Bad loans Ratio [RHS] (2016) Bad loans ratio [RHS] (2018)
Source: European Central Bank
Chart 8: Stock market indices, Jan 2013 — Aug 2018
80 100 120 140 160 180 200 2013 2014 2015 2016 2017 2018 In d e x , J a n 2 0 1 3 = 1 0 0 STOXX EUROPE 600 STOXX ASIA/PACIFIC 600 S&P 500 FTSE 100
Source: Thomson Reuters Datastream
Of course, there are risks to this outlook.
The Trump administration’s decision to increase
tari s on some European and Chinese imports, has
escalated trade tensions.
The short-run impact of a trade war may be more modest than one might expect (relative to the geo-political consequences). But the potential damage to long-run prospects for growth is a concern. The strength of global growth has led to increased speculation about a gradual return to normality in interest rates. (Chart 6)
The US Fed increased rates by 25 basis points in June, with two further hikes pencilled in for 2018. The ECB plans to taper its QE programme, marking
the rst step in the unwinding of its emergency support e orts.
But a combination of scal consolidation,
weak productivity, bad loans – Chart 7 – and demographics is likely to mean that the ‘neutral interest rate’ in most economies will remain lower than pre-crisis averages for at least a decade. Equity prices have bounced back following their correction in February. Volatility has subsided and risk appetite has been strong. (Chart 8)
Consequently, overall nancial conditions have
remained highly supportive.
Our colleague Gary Koop has co-developed a
nancial accounting index which draws on data such
as equity, corporate bonds and interbank spreads.
It shows general nancial conditions remain highly
supportive. (Chart 9)
Chart 9: Koop and Koroblis Financial Conditions Index, 2000 —
2018 (values < 0 = supportive, values > 0 = restrictive)
-2 -1 0 1 2 3 4 5 6 2000 2002 2004 2006 2008 2010 2012 2014 2016 2018 D is ta n c e f ro m a v e ra g e s s in c e 1 9 9 1 ( s .d ) Global Emerging economies Advanced economies
Chart 10: Monthly UK economic growth to July 2018 -0.6 -0.4 -0.2 0.0 0.2 0.4 0.6 0.8 1.0 1.2 J a n F e b M a r Ap r M a y J u n J u l Au g Se p O ct N o v D e c J a n F e b M a r Ap r M a y J u n J u l Au g Se p O ct N o v D e c J a n F e b M a r Ap r M a y J u n J u l 2016 2017 2018 % c h a n g e o n p re v io u s m o n th
UK monthly GDP Rolling three month growth
Source: ONS
Chart 11: Annual GDP growth in G7 countries, 2016 – 2017
-0.5 0.0 0.5 1.0 1.5 2.0 2.5 3.0 3.5
Canada France Japan USA Germany Italy UK
A n n u a l g ro w th ( % a n d p e rc e n ta g e p o in ts )
Change in growth between 2016 & 2017 Growth in 2016 Growth in 2017
Source: ONS & OECD
Chart 12: UK manufacturing output, Jan 2008 — Jul 2018
80 85 90 95 100 105 110 2008 2009 2010 2011 2012 2013 2014 2015 2016 2017 2018 In d e x , 2 0 1 6 = 1 0 0
Manufaturing monthly output
Manufacturing 3-month average
Source: ONS
The UK economy
For the rst time, in July the ONS published UK GDP
on a monthly and rolling 3-monthly basis. The results require careful interpretation.
Firstly, the latest UK gures might not always follow
the ‘traditional’ calendar quarters of Q1, Q2 etc. So growth comparisons – including with Scotland – need to ensure a like-for-like basis. Secondly, month-to-month results will be volatile. (Chart
10). One-o events – e.g. weather – could have signi cant impacts on the headline results.
Up to July, rolling 3-month growth of 0.6% was the highest since last summer.
This pick-up follows a challenging start to 2018, and weak growth through 2017, when the UK lagged behind other G7 economies. (Chart 11).
Within sectors, performance has been mixed. Manufacturing output fell over both the quarter and the year.
With manufacturing activity still lower than a decade ago, any hope of boosting exports substantially – and to the government’s target of 35% of GDP – is hugely optimistic. (Chart 12)
A strong performance from consumer facing activities, driven by factors such as the good weather, boosted the summer growth numbers. The growth in consumer activity has also been boosted by an upturn in real earnings. But conditions remain challenging for many in the sector. Over the year to July, real terms regular earnings increased by 0.5%. (Chart 13)
Chart 13: Real and nominal earnings growth, Jan 2007 - Jul 2018
-3 -2 -1 0 1 2 3 4 5 6 2007 2008 2009 2010 2011 2012 2013 2014 2015 2016 2017 2018 E a rn in g s g ro w th ( % c h a n g e o n a y e a r e a rl ie r)
Nominal regular earnings Real-terms regular earnings
Chart 14: Contributions to the UK savings ratio, 2013 — 2018 -10 -8 -6 -4 -2 0 2 4 6 8 10 12 -10 -8 -6 -4 -2 0 2 4 6 8 10 12 2013 2014 2015 2016 2017 2018 P e rc e n ta g e ( % ) £ b ill io n
Households' final consumption expenditure Adjustment to pension entitlements Gross disposable income Gross Saving
Saving ratio (%) (RHS)
Source: ONS
Chart 15: Bank of England Agent Scores: capacity constraints &
recruitment difficulties since August 2007
-5 -4 -3 -2 -1 0 1 2 3 4 2007 2008 2009 2010 2011 2012 2013 2014 2015 2016 2017 2018 B a n k o f E n g la n d A g e n ts S c o re Recruitment difficulties Capacity constraints
Source: Bank of England
Chart 16: Change over year in employment by nationality,
Apr-Jun 2017 — Apr-Apr-Jun 2018 -150 -50 50 150 250 350 UK nationals All in employment Non-EU nationals EU nationals
Change from same period a year ago
Source: ONS
That being said, average regular pay remains around
£11 per week lower than prior to the nancial crisis
– and over £30 less when bonuses are included. As a result of this squeeze, the UK savings ratio (the proportion of income not spent each quarter) is at its lowest level in over 50 years. (Chart 14)
Some of the rise in wages is undoubtedly driven by the tight UK labour market.
Unemployment of 4 per cent is the lowest since the winter of 1974-75.
Whilst welcome, there is increasing evidence that this is posing recruitment challenges and wider capacity constraints. (Chart 15)
The number of people in work continues to grow, but there is also evidence of a fall back in the number of EU nationals in employment in the UK. (Chart 16)
Whether or not this is part of a ‘Brexit e ect’ remains
unclear. Reports from the Bank of England’s network of agents suggests that companies are becoming more uncertain about the outlook, with a fall-back in investment intentions. Contingency planning, whilst modest, is intensifying.
This backdrop of fragility – albeit counterbalanced by positive indicators of current activity – will set the context for the upcoming 2018 UK Budget.
Whilst borrowing continues to fall (Chart 17), with debt still above 80% of GDP, and rising pressures on health and social care costs, the Chancellor does not have his challenges to seek.
Chart 17: UK public sector net borrowing by financial year,
2014/15 to 2018/19 0 10 20 30 40 50 60 70 80 90 100
Apr May Jun Jul Aug Sep Oct Nov Dec Jan Feb Mar
2018 2019 C u m u la ti v e b o rr o iw n g ( £ b n ) 14-15 15-16 16-17 17-18 18-19 (year to date)
OBR forecast for PSNB ex 2017 to 2018
OBR forecast for 18/19: £37.1bn
Chart 18: Scottish GDP since 2016 96 97 98 99 100 101 102 103 104 105 106 -0.50% -0.25% 0.00% 0.25% 0.50% 0.75% Q1 Q2 Q3 Q4 Q1 Q2 Q3 Q4 Q1 Q2 2016 2017 2018 In d e x e d Q 1 2 0 1 6 = 1 0 0 G ro w th (% )
Quarterly growth (LHS) Scottish GDP Level (RHS) 1998-2007 trend growth (RHS)
Source: Scottish Government & FAI calculations
Chart 19: Scotland vs. UK economic growth since 2013
-6% -4% -2% 0% 2% 4% 6% Q1 Q2 Q3 Q4 Q1 Q2 Q3 Q4 Q1 Q2 Q3 Q4 Q1 Q2 Q3 Q4 Q1 Q2 Q3 Q4 Q1 Q2 2013 2014 2015 2016 2017 2018 % c h a n g e ( a n d % p o in t > 0 = S c o > U K )
Scottish/UK quarterly growth difference Scottish/UK GDP cumulative difference Scottish/UK GDP per head cumulative difference
Source: Scottish Government & FAI calculations
Chart 20: Composition of growth over year and latest quarter
-0.2 0.0 0.2 0.4 0.6 0.8 1.0 1.2 1.4 1.6
Past quarter Past year
% p o in t c h a n g e Services Construction Production
Agriculture, forestry & fishing
Source: Scottish Government & FAI calculations
The Scottish economy
The latest Scottish GDP growth gures were
published last week (19th September). (Chart 18) They showed a further pick-up in growth, with the Scottish economy expanding 0.5% over the 3-months to June. This followed revised growth of
0.4% in the rst 3-months of the year.
These gures (consistent with the latest survey indicators) show further evidence of the rst
sustained period of expansion since the downturn in early 2015. Indeed, growth over the year to June 2018 was the fastest since late 2014/early 2015. That being said, annual growth of 1.7% (quarter-to-quarter) and 1.4% (4Q-on-4Q), still lags Scotland’s long-term historical growth rates.
The Scottish economy has outpaced the UK for the last two quarters and over the year as a whole.
Some of this, re ects a degree of cyclical catch-up,
with the UK having grown more strongly over the four years to late 2016, shown in Chart 19.
But the upturn has been broad-based. Over Q2, there was growth of 0.6% in production activities, 1.8% in construction and 0.4% in services.
With services making up over 75% of activity – it is no surprise that Scotland’s overall rate of growth has been shaped by services. (Chart 20)
Some of the improvement in the Scottish numbers
undoubtedly re ects a more positive outlook for oil
and gas than last year – albeit cutbacks continue to be made. (Chart 21)
Chart 21: Capital and operating expenditure in the North Sea,
1998-99 to 2017-18 2,000 4,000 6,000 8,000 10,000 12,000 14,000 16,000 £ m ill io n ( n o m in a l te rm s ) Operating expeniture Capital expenditure
Scottish Economy Dashboard
Agriculture
% of Economy 2017 Q2 2018Growth
Construction
Signi cant revisions to o cial data paint a more positive
picture for sector than before
Uplift in public sector capital investment should help support infrastructure, but wider measures of activity – including commercial property and house-building – remain relatively subdued
Sector grew in 2017 but is arguably most exposed to any hit to migration post-Brexit
Sector will need clarity on support, opportunities and regulation post-Brexit to ensure growth can continue
Services
Retail and wholesale
Accommodation & food services
Financial & insurance
76%
10% 3% 6%0.9%
1.4% 0.3% -1.3%0.4%
1.1% -0.2% 1.1%Aggregate data suggests a recent upturn in sector activity Micro data suggests tough trading conditions, with many
high-pro le names on the high street struggling
Rising wages could give some respite to a sector going
through signi cant structural change
Mixed performance with growth over the year, but some fall-back in the most recent quarter
Like retail, many casual eating and drinking
establishments have been struggling. Changes in how households consume entertainment is impacting many business models
Tourist faring elements of the sector continue to improve Relative modest output in this key sector of the Scottish economy
Unlike other sectors directly exposed to the nancial crisis – such as professional services and real estate – nancial
services has taken much longer to get back on its feet
Uncertain future for nancial services in relation to trading
with Europe, even under the ‘Chequers’ plan
Production
Manufacturing
Food and drink
17%
11% 3%1.9%
1.7% -0.7%0.6%
0.9% 4.0%Con dence and growth has returned recently – boosted by
a more positive outlook for the oil and gas supply chain
Exporters likely to continue to bene t from weak pound
and strong global economy. But also most likely to be at risk from dislocation of UK-EU trade
Key issues/trends
6%
1%
4.3%
4.5%
1.8%
-1.2%
Sector continues to grow strongly – and is now at its highest ever level
Growth potential is high, although boosting productivity in sector will be key for sustainability
Future post-Brexit challenges could include ‘just-in-time’ deliveries and access to migrant workers
Chart 22: Manufacturing and Food & Drink in Scotland, Q1 2013 — Q2 2018 90 95 100 105 110 115 Q1 Q2 Q3 Q4 Q1 Q2 Q3 Q4 Q1 Q2 Q3 Q4 Q1 Q2 Q3 Q4 Q1 Q2 Q3 Q4 Q1 Q2 2013 2014 2015 2016 2017 2018 In d e x 2 0 1 3 Q 1 = 1 0 0
Manufacturing Food & Drink
Source: Scottish Government & FAI calculations
Chart 23: Growth in services over quarter and year
-1.5 -1.0 -0.5 0.0 0.5 1.0 1.5 2.0 2.5 3.0 3.5 % c h a n g e Quarterly change Annual change
Source: Scottish Government & FAI calculations
Chart 24: Financial services in Scotland since the crisis
80 90 100 110 120 130 140 2006 2007 2008 2009 2010 2011 2012 2013 2014 2015 2016 2017 2018 In d e x 2 0 0 6 Q 1 = 1 0 0
Financial services Real estate Professional services
Source: Scottish Government & FAI calculations
But there is also increasing evidence of a wider recovery. For example, manufacturing grew by 0.9% over the quarter and by 3.2% over the year on 4Q-on-4Q basis.
A key driver of this has been the strong growth in Scotland’s food and drink sector. The sector has grown 3.0% over the year on a 4Q-on-4Q basis to reach its highest ever level. (Chart 22)
Whilst electricity and gas supply activity has slipped back a little in the most recent quarter, growth was strong over the year buoyed by renewables output. Within services, growth has been more modest but – for the most part – broadly positive. (Chart 23) Retail and accommodation and food sectors have picked-up. Whilst positive, it is clear from wider
indicators that such sectors continue to nd trading
conditions challenging.
If the rise in earnings continues to build momentum, then this should provide some respite. However, many of the challenges that they face are more structural and relate to the way in which people now choose to consume such services (e.g. online retailing).
One sector which returned to growth was nancial
services, which grew by 1.1% in Q2.
But as Chart 24 highlights, the sector continues to lag behind its counterparts, such as real estate and professional services. (Chart 24)
That said, Scotland’s nancial services industry appears to be no di erent in operating on a slightly smaller scale – post nancial crisis – than the UK
sector. (Chart 25)
Chart 25: Financial services in Scotland since the crisis
80 85 90 95 100 105 110 115 2006 2007 2008 2009 2010 2011 2012 2013 2014 2015 2016 2017 2018 In d e x 2 0 0 6 Q 1 = 1 0 0
Scottish financial services UK financial services
Chart 26: Revisions to construction GDP, Q1 2010 = 100, Q1 2010 — Q2 2018 90 95 100 105 110 115 120 125 130 135 2010 2011 2012 2013 2014 2015 2016 2017 2018 In d e x Q 1 2 0 1 0 = 1 0 0
New construction data Old construction data
Source: Scottish Government & FAI calculations
Chart 27: Revisions to GDP growth, %, 2011 – 2017
-0.5% 0.0% 0.5% 1.0% 1.5% 2.0% 2.5% 3.0% 2011 2012 2013 2014 2015 2016 2017 A n n u a l c h a n g e ( % ) old GDP growth new GDP growth Revised up Revised down
Source: Scottish Government & FAI calculations
Chart 28: Commercial property transactions in Scotland,
2007-08 to 2017-18 1,000 2,000 3,000 4,000 5,000 6,000 0 1 2 3 4 5 6 T o ta l n u m b e r o f tr a n s a c ti o n s T o ta l v a lu e o f s a le s ( £ b n ) Volume of Transactions (RHS) Value of Sales (LHS)
Source: National Registers of Scotland
Revisions to Scottish construction data
Back in June, we discussed the puzzling patterns in the Scottish construction series.
The o cial Scottish Government data had been
showing a sharp rise in construction activity during 2014 and 2015 – by around 30% - before falling back in 2017 and 2018.
The scale of such changes was unprecedented.
The government had hypothesised that the gures
were driven – in part – by a number of major
infrastructure projects coming to an end (such as the Queensferry Crossing and M8 upgrade).
But even with expanded borrowing powers, and
growing capital budgets, this was always di cult to
reconcile with activity on the ground and what other data was telling us.
In August, the statistics were revised substantially
(Chart 26). The o cial data now show construction
growing since 2014, with only a modest decline in recent times.
As a result, even though construction accounts for just 6% of our economy, the revisions were of such
a large scale that they changed the entire pro le of
growth in the Scottish economy. (Chart 27)
In June, the Scottish Government published growth
estimates for 2017 of just 0.8%. Now that gure is
1.3%.
That being said, the changes do not alter Scotland’s
long-term growth pro le (with GDP per head still
rising by just under 2% over the decade). Revisions are an important and necessary part of producing robust economic statistics. And there are advantages in making major changes to methodology at set points in time.
These data have wider implications with sustained weak economic performance unlocking emergency borrowing, depending on the performance of the economy.
So one lesson is perhaps the need to revise more
quickly if the o cial methodology is clearly and
signi cantly inconsistent with wider evidence. Double checking a suite of data, e.g. commercial transactions, actual Scottish Government data on infrastructure spending, housing completions etc, should provide a more accurate picture. (Chart 28)
Table 3: Scotland and UK labour market, May - Jul 2018 Employment rate (16-64) Unemployment rate (16+) Inactivity rate (16-64) Scotland 75.1% 4.1% 21.7% Quarterly change (pp) -0.1 -0.2 0.3 Annual change (pp) -0.8 0.3 0.5 UK 75.5% 4.0% 21.2% Quarterly change (pp) -0.1 -0.2 0.3 Annual change (pp) 0.2 -0.3 0.0 Source: ONS, LFS
Chart 29: 16-24 unemployment rate, Apr 2017 - Mar 2018
0 2 4 6 8 10 12 14 16 U n e m p lo y m e n t ra te , 1 6 -2 4 ( % )
Source: ONS, APS
Chart 30: Number of employees and self-employed in Scotland
since 2007 140 160 180 200 220 240 260 280 300 320 340 2,100 2,120 2,140 2,160 2,180 2,200 2,220 2,240 2,260 2,280 2,300 2007 2008 2009 2010 2011 2012 2013 2014 2015 2016 2017 2018 N u m b e r o f p e o p le i n s e lf -e m p lo y m e n t N u m b e r o f p e o p le i n f u ll ti m e w o rk Employees (LHS) Self-employed (RHS) Source: ONS, LFS
Scottish labour market
Unemployment in Scotland remains low and, taking
the con dence intervals around headline estimates into account, e ectively no di erent from the UK.
But over the last year, there has been a degree of weakening in labour market outcomes. Employment has fallen by around 40,000, whilst there has been a rise 7,000 in unemployment. (Table 3)
One big success story for the labour market in Scotland in recent years has been substantial drops in youth (16-24) unemployment. Scotland currently has the lowest 16-24 unemployment rate of anywhere in the UK. (Chart 29)
One feature we have discussed in past
commentaries, has been the rise in part-time work and self-employment, with a corresponding relative squeeze on the number of full-time employees. Interestingly, over the last year to 18 months this trend has eased. Instead, the number of employees has been on the rise, as has the number of full-time workers. (Chart 30)
The fall in employment, alongside the revisions to GDP growth by the Scottish Government, has led to a bounce back in Scotland’s productivity numbers. Labour productivity in Scotland is nearly 4% higher than this time last year.
However, these revisions do little to alter Scotland’s relatively weak track record in productivity – with last year’s boost counterbalanced by weaker than before estimates for productivity in earlier years. (Chart 31)
As a result, productivity in Scotland is largely back at 2011 levels.
Chart 31: Revised productivity estimates, Q1 2010 — Q1 2018
96 97 98 99 100 101 102 103 104 105 106 2010 2011 2012 2013 2014 2015 2016 2017 2018 In d e x 2 0 1 0 Q 1 = 1 0 0
Revised productivity statistics Old productivity statistics
Chart 32: Components of Scottish Productivity, 1998 — 2017 80 90 100 110 120 130 140 In d e x , 1 9 9 8 = 1 0 0
Gross value added Output per hour
Average weekly hours worked in whole economy
Source: Scottish Government
Chart 33: Growth in employment from 1997-2017 and GVA per
hour worked in 2016, size of circle indicates the number of workers in that sector
Manufacturing
Construction Wholesale & Retail
Transportation & Storage Accommodation & Food Information & Communication Financial & Insurance Professional, Scientific & Technical Services Administrative & Support Services Public Administration Education Health Arts, Entertainment & Recreation Other Services 0 10 20 30 40 50 60 70 -100 -50 0 50 100 150 G V A p e r h o u r w o rk e d 2 0 1 6 ( £ /h r)
Growth in employment from 1997-2017 (%) The relative size of circles indicates the number of workers in that industry (2017)
Source: ONS & FAI analysis
Chart 34: Royal Bank of Scotland PMI, Jan 2016 — Aug 2018
40 45 50 55 60 65 2016 2017 2018 P u rc h a s in g M a n a g e rs I n d e x ( > 5 0 = e x p a n s io n )
Scotland London S. East S. West East Wales W. Midlands E. Midlands Yorkshire N. East N. West N. Ireland
Other regions and devolved nations UK
Source: Royal Bank of Scotland & IHS Markit
Over a longer time horizon, productivity has lagged behind wider growth in the economy. The slack has been picked up by rising employment. (Chart 32) But with an ageing population, employment at near record levels, and uncertainty over the future of
migration post-Brexit, it is not di cult to see why
turning around Scotland’s productivity performance is so crucial to future prosperity.
Greater e ciency, not just in high value added
sectors, but across our economy will be key. (Chart 33)
Latest Scottish indicators
Over the summer, indicators of day-to-day activity in the Scottish economy have held up relatively well. This backs up the assessment we made in June that, despite Brexit uncertainty, underlying economic conditions have strengthened a little. We retain that cautious optimism.
Some of this is undoubtedly tied to a more positive outlook for oil and gas. But there are also signs that activity has been stabilising or picking-up across the wider economy.
For example, at 55.5, the RBS Purchasing Managers Index (where >50 marks expansion; <50 marks contraction) is the strongest it has been in four
years. Indeed last month’s gure was the rst time
since July 2016 that Scotland outpaced the UK average. (Chart 34)
A similar rise in activity was found in the latest Quarterly Economic Indicator from the Scottish Chamber of Commerce.
All sectors were showing positive trading conditions and optimism in Q2 2018, with tourism once again leading the way. (Chart 35)
Our own Scottish Business Monitor – produced in association with RBS – highlights a similar picture. The latest results for new and repeat business continue to grow. (Chart 36)
Optimism is also on the rise.
One exception to this was the latest Federation of
Small Businesses Scotland con dence index which
fell from plus 5.1 points to minus 13.2 points with Scottish businesses amongst the most concerned in the UK about a no-deal Brexit.
Chart 35: Quarterly Economic Indicator: business optimism, Q3 2014 — Q2 2018 -30 -20 -10 0 10 20 30 40 Q3 Q4 Q1 Q2 Q3 Q4 Q1 Q2 Q3 Q4 Q1 Q2 Q3 Q4 Q1 Q2 2014 2015 2016 2017 2018 N e t b a la n c e o f re s p o n d e n ts ( % )
Retail Construction Manufacturing Tourism Financial & Business services Source: FAI & Scottish Chambers of Commerce
Chart 36: Scottish Business Monitor: repeat and new business,
Q1 2013 – Expected Q3 2018 -20 -15 -10 -5 0 5 10 15 20 25 30 Q1 Q2 Q3 Q4 Q1 Q2 Q3 Q4 Q1 Q2 Q3 Q4 Q1 Q2 Q3 Q4 Q1 Q2 Q3 Q4 Q1 Q2 Q3 2013 2014 2015 2016 2017 2018 N e t b a la n c e ( a b o v e 0 = a c ti v it y g ro w in g /o p ti m is m im p ro v in g )
Repeat Business New Business Expecations Repeat Business Expectations New Business
Source: FAI-RBS Scottish Business Monitor
Chart 37: Scottish Business Monitor: turnover and costs, Q1
1998 — Q2 2018 -40 -20 0 20 40 60 80 100 N e t b a la n c e o f re s p o n s e s
Trend in turnover Trend in costs
Source: FAI-RBS Scottish Business Monitor
One advantage of our Business Monitor is the ability to track trends in activity over time. The survey has been running on a consistent basis since 1998. It therefore provides a valuable record of conditions in the Scottish economy.
Over time, we nd that – on balance – most rms
tend to report costs rising ahead of turnover. Clearly this cannot happen forever, and shows an inherent
nervousness built into most rms’ interpretation of
current conditions (i.e. they tend to be more worried about costs rather than opportunities). (Chart 37) What is revealing however, is where the gap widens and narrows and how closely this tracks Scotland’s growth record. When the gap grows - e.g. 2008/09 and 2015/16 – growth slows. When the gap narrows, growth tends to pick-up.
Another advantage of our Business Monitor, is the ability to track ‘hot topics’ over time.
Access to nance and access to workers is just one element. We nd a sustained fall in the number of
rms citing credit availability as an important issue for them (but rise in concerns over sta availability).
(Chart 38)
One interpretation of these data is that the current period of heightened uncertainty is leading
businesses to meet any increase in demand by taking on more workers, rather than investing in new plant and machinery.
These data pose questions for recent e orts – such
as the new Scottish National Investment Bank and British Business Bank – to boost the supply of
nance. Our survey suggests that demand for credit
is likely to be just as important.
Chart 38: Scottish Business Monitor: credit and staff availability
important/very important, Q1 1998 — Q2 2018 40 45 50 55 60 65 70 75 80 85 90 2007 2008 2009 2010 2011 2012 2013 2014 2015 2016 2017 2018 % r e s p o n s e s i m p o rt a n t/ v e ry i m p o rt a n t
Credit availability important/very important Staff availability important/very important
Chart 39: Consumer Sentiment Index current conditions: the economy, household finances and spending, Q2 2013 — Q2 2018 -20 -10 0 10 20 30 40 Q2 Q3 Q4 Q1 Q2 Q3 Q4 Q1 Q2 Q3 Q4 Q1 Q2 Q3 Q4 Q1 Q2 Q3 Q4 Q1 Q2 2013 2014 2015 2016 2017 2018 N e t b a la n c e o f re s p o n s e s ( > 0 = p o s it iv e ) Scottish Economy Household Finances Household Spending
Source: Scottish Government
Chart 40: Consumer confidence in Scotland and the UK, Jan
2016 – Aug 2018 -30 -25 -20 -15 -10 -5 0 5 2016 2017 2018 N e t b a la n c e UK Scotland Source: GfK
Chart 41: Consumer Sentiment Index expectations: Scottish
economy, Q2 2013 — Q2 2018 -40 -30 -20 -10 0 10 20 30 40 50 Q2 Q3 Q4 Q1 Q2 Q3 Q4 Q1 Q2 Q3 Q4 Q1 Q2 Q3 Q4 Q1 Q2 Q3 Q4 Q1 Q2 2013 2014 2015 2016 2017 2018 % o f h o u s e h o ld s
Outlook for Scottish Economy (Better) Outlook for Scottish Economy (Worse) Source: Scottish Government
One area of ongoing fragility is around consumer
and household con dence.
Scottish households’ assessment of current conditions remains weak – although they have at least stabilised in recent times. (Chart 39 and 40). For comparisons the GfK indicator for August 2018 was -13.
It would appear that the key driver of the slightly more pessimistic outlook is households’
expectations for the economy.
In contrast to their expectations for their own
nances (which remain positive), an increasing
number believe that the outlook for the economy is negative. (Chart 41)
The outlook for the labour market however, remains positive. (Chart 42)
The latest Royal Bank of Scotland Report on Jobs shows its headline indicator for labour market activity remains above its 12 month rolling average. This should help – in time – put upward pressure on real wages, bolstering household incomes.
Chart 42: Jobs market indicator, Jan 2013 — Aug 2018
50 52 54 56 58 60 62 64 66 68 70 2013 2014 2015 2016 2017 2018 B a ro m e te r (> 5 0 = e x p a n s io n ) Scotland UK
Scotland 12m moving average
Chart 43: What has been the impact of the Brexit decision, to date, on your business?
No change 49% Positive change 6% Negative change 44%
Source: Fraser of Allander Institute
Chart 44: How has the Brexit decision affected…
0% 10% 20% 30% 40% 50% 60% 70% 80% 90% 100% Your current investment activity?
Any proposed new investment activity? New staff recruitment? Your ability to retain existing staff? You starting any new business projects?
% of responses
Negatively No change Positively Source: Fraser of Allander Institute
Chart 45: Do you feel that your business is prepared for Brexit?
Yes 38% No
62%
Source: Fraser of Allander Institute
Focus: FAI Brexit survey
In July, we undertook a survey of Scottish rms
to assess their preparedness for Brexit. Over the course of the month we spoke to around 350 businesses from across the country and from a
variety of di erent sectors.
The focus of the survey was not on whether or not businesses believe Brexit to be good or bad, but instead, how their preparatory plans were taking shape.
Around half of the businesses we spoke to said that the decision so far had no impact on their business activity. Only 6% said it had been positive, with 44% saying the impact had been negative. (Chart 43)
33% of rms said that it has had a negative impact
on current investment activity (4% positive), with 41% saying that it has had a negative impact on new investment (3% positive).
33% indicated that it has had a negative impact on
sta recruitment (3% positive). (Chart 44)
Brexit is happening, like-it-or-not. So it is vital that businesses prepare for such an eventuality. We
asked rms about their preparedness for Brexit.
Only 38% said that they believed that they were prepared for Brexit. (Chart 45)
We also asked about the level of information that is available to them to make such preparations. The overwhelming response was that there is not enough information currently available to enable them to plan for potential Brexit outcomes. ‘Uncertainty over the UK Government’s objectives in the negotiations’ was the most popular response amongst businesses (with over 59% citing this as a factor).
Finally, in terms of possible opportunities. Whilst 51% of business surveyed indicated that they did
not see any immediate bene ts, 28% of those surveyed believed that there might be bene ts from
moving away from EU regulations with 26% pointing to possible increased funding from the Scottish and/ or UK Government in the future. Only 18% thought of opportunities in new markets outside the EU.
Chart 46: FAI nowcast and the latest release of Scottish GDP estimates, Q1 2016 – Q3 2018 -0.2% 0.0% 0.2% 0.4% 0.6% 0.8% Q1 Q2 Q3 Q4 Q1 Q2 Q3 Q4 Q1 Q2 Q3 2016 2017 2018 Q u a rt e rl y g ro w th
Nowcast Latest release of Scottish GDP Average (nowcast) Average (initial release) Average (latest release)
Source: Fraser of Allander Institute
Table 4: Nowcasts for Scotland’s GDP in Q2 and Q3 2018
Q2 Q3
Quarterly Growth 0.33% 0.39%
Annualised Growth 1.34% 1.57%
Source: Fraser of Allander Institute
Chart 47: FAI forecast Scottish economic growth range
-3% -2% -1% 0% 1% 2% 3% 4% 2006 2007 2008 2009 2010 2011 2012 2013 2014 2015 2016 2017 2018 2019 2020 A n n u a l G V A G ro w th Forecast
Source: Fraser of Allander Institute
* Actual data to 2017. Central forecast with forecast uncertainty for 2018 – 2020. Uncertainty bands sourced from accuracy of
past forecasts at di erent forecast horizons.
Our forecasts
Chart 46 shows our latest nowcasts and also howthey have tracked against the o cial data both
before and after the recent revisions to the GDP series.
Our nowcasts do a much better job of tracking the
revised estimates of GDP compared to the rst
estimates.
Last week’s data, con rmed that growth continued into the 2nd quarter of 2018 picking up over the rst
three months.
As we have discussed before, quarterly results for Scotland can be relatively volatile given the size of the economy.
The latest results are therefore broadly consistent with our expectations for growth in 2018 that we
rst made back in 2017.
On balance, we believe that – setting aside any risks from the Brexit negotiations going awry – Scotland should be on track to grow at a broadly similar rate to last year (if not slightly faster). (Table 4)
Turning to our forecasts for the next three years, as in the past, we report a central forecast but also uncertainty bands that set out a likely range within which we predict Scottish economic growth will lie. It is important to note that such bands are based upon historical variations in our ‘normal’ forecasting performance. Looking ahead, the potential for a ‘no-deal’ Brexit outcome is clearly not a ‘normal’ event. Should this occur, an entirely new set of forecasts will be required. But with so much uncertainty over what this could mean – politically and economically – we have not published such an estimate at this stage. An update will be provided in December. Overall, our base forecasts are very similar to June. (Table 4 and Chart 47)
Table 5: FAI forecast Scottish GDP growth (%) 2018 to 2020
2018 2019 2020
GDP 1.3% 1.4% 1.4%
Production 1.5% 1.6% 1.5%
Construction 1.0% 1.1% 1.0%
Services 1.2% 1.4% 1.3%
Table 6: Latest growth forecasts for the UK economy 2018 2019 2020 Bank of England 1.5 1.8 1.7 OBR 1.5 1.3 1.3 NIESR 1.4 1.7 1.7 European Commission 1.5 1.2 -IMF 1.4 1.5 -Oxford Economics 1.3 1.4 2.0 ITEM Club 1.3 1.5 1.7 CBI 1.5 1.3
-Source: HM Treasury, Bank of England, OBR
Chart 48: FAI GDP forecasts by sector, 2018 – 2020
0.0% 0.4% 0.8% 1.2% 1.6% 2.0% 2018 2019 2020 G ro w th
GVA Production Construction Services
Source: Fraser of Allander Institute
Table 7: FAI Labour Market forecasts to 2020
2018 2019 2020
Employee jobs 2,495,250 2,521,950 2,547,550
% employee job
growth over year 1.0% 1.0% 1.0% ILO unemployment 111,400 114,150 118,900
Rate (%)1 4.2% 4.2% 4.3%
Source: Fraser of Allander Institute Absolute numbers are rounded to the nearest 50.
1 Rate calculated as total ILO unemployment divided by total of economically active population aged 16 and over.
Our central forecast is for growth of 1.3% in 2018 followed by growth of 1.4% in 2019 and 2020. In short, we believe that the Scottish economy will grow this year, will quicken slightly over the forecast horizon, but growth will remain below trend.
Our latest forecasts for Scotland put us slightly behind the Bank of England’s forecast for the UK economy but ahead of the OBR’s UK forecast. (Table 5). Whilst we do not forecast the UK economy directly, on balance, we believe that Scotland will do well to match UK growth over the next few years.
A no-deal outcome would signi cantly lower our
forecasts as businesses adjust to this new normal. With nominal earnings growth expected to continue
to pick-up, and provided that this outpaces in ation,
household spending should see some modest gains.
Investment activity is likely to remain under pressure as Brexit-uncertainty continues to cast a shadow over growth ambitions. This element of our forecast carries the greatest risk and has the greatest potential to be negatively hit should a ‘no-deal’ outcome become a reality.
Net exports and tourism are on track to continue to
bene t from the low value of Sterling.
As in recent years, services should make the greatest contribution to overall growth. However, we also expect the outlook for manufacturing to continue to be more positive, particularly as optimism in the North Sea supply chain continues to improve.
Building on recent growth, professional and business services are placed to do better. And with major new public investment in the pipeline, the construction sector should continue to see a more sustained outlook.
We expect unemployment to rise slightly toward a level consistent with more medium-term trends. So any reported rise in unemployment in the coming months should pose little concern. (Table 6)
Policy context
Tackling regional economic inequalities
Tackling regional economic disparities has been a priority of successive governments in both the UK and Scotland.
The UK Government’s Industrial Strategy is their latest attempt, with regional growth 1 of 5 ‘foundations of success’. Here in Scotland, ‘cohesion’ – or its new term ‘regional inclusive growth’ – has been a feature of the Scottish Government’s Economic Strategy since 2007. It is hard to disagree that a country will be economically stronger if every region has the
opportunity to ful l its potential.
However, Scottish and UK policy history is littered with well-intentioned – but ultimately ill-fated – attempts to narrow the gap in economic performance between regions. Many of the challenges are deep-rooted and structural, whilst attempts to tackle them throw-up challenging
trade-o s and ptrade-olitical risks.
Regional inequalities in Scotland and the
UK
Much has been written about the unbalanced nature of the UK economy.
Scotland performs relatively well despite that context. Our onshore GDP per head was just below £25k in 2016 - 3rd behind London and the South East.
Chart 49: GVA per head across the UK (2016)
5,000 10,000 15,000 20,000 25,000 30,000 35,000 40,000 45,000 50,000 G V A p e r h e a d ( £ , 2 0 1 6 ) Source: ONS
What is stark is the variation in economic
performance by UK region. GVA per head in London is over 70% higher than the UK average. (Chart 49) Looking at the more disaggregated data the disparity is even greater. It is clear that the UK, or
more speci cally one part of London, stands as an
outlier in Europe. (Chart 50)
Chart 50: GVA per head, difference between richest and poorest
parts of EU countries (NUTS2 regions, 2016)
0 20,000 40,000 60,000 80,000 100,000 120,000 140,000 160,000 180,000 B e lg iu m B u lg a ri a C z e c h R e p u b li c D e n m a rk G e rm a n y E s to n ia Ir e la n d G re e c e S p a in F ra n c e C ro a ti a It a ly C y p ru s L a tv ia L it h u a n ia L u x e m b o u rg H u n g a ry M a lt a N e th e rl a n d s Au s tri a P o la n d P o rt u g a l R o m a n ia S lo v e n ia S lo v a k ia F in la n d S w e d e n U n it e d K in g d o m G D P p e r p e rs o n ( p u rc h a s in g p o w e r s ta n d a rd ) Range
Source: Eurostat & FAI Calculations
One might expect the dominance of London to have
waned following the nancial crisis. If anything it
has increased, widening UK interregional disparities. But before we think that this is just a London or UK phenomenon, the same data also reveals the scale of regional inequality in Scotland. (Chart 51)
Chart 51: GVA per head Scotland’s NUTS 2 regions (2016)
5,000 10,000 15,000 20,000 25,000 30,000 35,000 40,000 45,000 G D P p e r h e a d b y r e g io n
Scottish NUTS 3 Regions Scottish Average UK Average
GVA per head in Edinburgh is nearly 2.5 times higher than in East and North Ayrshire. And over time, the gap has widened. GVA per head in the capital has nearly doubled since devolution, with growth in East and North Ayrshire around half that rate.
This translates into widening economic and social outcomes across Scotland. In North Ayrshire for example, around a third of children are in
households classi ed as being in relative poverty.
And back in 2007, the Scottish Government established a target to narrow the gap in
employment between the three ‘best‘ performing and the three ‘worst’ performing local authorities in Scotland.
As the chart below highlights, a decade later, the gap remains largely the same. (Chart 52)
Chart 52: Difference in employment rate for the three best and
worst performing Local Authorities (2004 – 2017)
0% 10% 20% 30% 40% 50% 60% 70% 80% 90% 100% 2004 2005 2006 2007 2008 2009 2010 2011 2012 2013 2014 2015 2016 2017 E m p lo y m e n t ra te s
Three worst performing Local Authorities Three best performing Local Authorities
Source: Scottish Government
The Centre for Regional Inclusive Growth
This summer the Scottish Government launched its Centre for Regional Inclusive Growth.
So far this is a website. It pulls together local information and statistics. But the Centre does not
(yet) o er any fresh insights into how to tackle the
questions that have underpinned this policy area for decades.
Indeed, on policy solutions, evaluation of current programmes or plans for new investment, it is silent. The website points to Regional Partnerships which are to come forward with new ideas but there is little detail on what resource will be made available and how ‘asks’ to central government will be acted upon. Perhaps we will see more in the upcoming Budget.
Policy opportunities and challenges with
Regional Inclusive Growth
So one cannot help follow recent UK and Scottish Government initiatives and ask the question – “so what happens next?” It is hard not to be sceptical over any hope that current initiatives will tackle the wide and deep-rooted variations in economic performance across Scotland.
Narrowing regional inequalities is not easy. The challenges are complex and – often – deep-rooted. Firstly, there are a great many structural factors why some parts of the country lag behind.
For example, the industrial mix of regions varies
signi cantly. Many of the challenges that parts of
west central Scotland face can be traced to the rapid de-industrialisation of the 1970s and 1980s and a reliance on relatively low value service industries. Social deprivation and health barriers often act as self-reinforcing barriers to economic prosperity. Geography also plays a part, with much of Scotland subject to the challenges of rurality and remoteness. Parts of our cities struggle with poor housing stock and wider basic infrastructure.
The make-up of a region’s population can also act as
a signi cant drag on long-term growth. Some of the
most fragile parts of the country are on track to lose population over the next few years. (Chart 53)
Chart 53: Projected population growth in Local Authorities in
Scotland, 2016-2026 -6 -4 -2 0 2 4 6 8 10 12 14 16 N a h -E il e a n a n S ia r In v e rc ly d e Arg y ll & B u te N o rt h Ay rs h ire D u m fr ie s & G a llo w a y S Ay rs h ir e W D u n b a rt o n s h ir e E Ay rs h ir e S h e tl a n d C la c k m a n n a n s h ir e O rk n e y D u n d e e N L a n a rk s h ir e H ig h la n d A n g u s F if e Bo rd e rs R e n fr e w s h ir e S L a n a rk s h ir e A b e rd e e n G la s g o w M o ra y F a lk ir k St irl in g Pe rt h & Ki n ro s s E D u n b a rt o n s h ir e W L o th ia n A b e rd e e n s h ir e E R e n fre w s h ire E d in b u rg h E L o th ia n M id lo th ia n P ro je c te d P o p u la ti o n G ro w th 2 0 1 6 -2 0 2 6
Natural change Migration Population change
Secondly, local areas often lack the tools to turnaround their economic performance (beyond limited interventions at the margins). Many of the
levers that will make a di erence – jobs, health
and well-being, population, digital and transport connectivity – are national responsibilities. Indeed, a quick glance at the diagnostic results from the Centre’s pilot study for North Ayrshire poses the question, “what realistic levers do local
policymakers have to e ect change in these areas?”
(Chart 54)
At the same time, local government budgets have been squeezed putting pressure on local government jobs and wages. As local authorities prioritise statutory responsibilities, it is no surprise that many have scaled back support for economic development.
Chart 54: Prioritisation matrix for North Ayrshire
Intermediate and High-level skills
Jobs density Basic digital skills
Health and well-being
Childcare Entry-level skills/Work-readiness Sector composition Migration and Population decline Business-specific skills and entrepreneurship Digital connectivity Business premises Aspirations Housing Digital innovation People to jobs (transport) Goods to market (transport) 4 5 6 7 8 9 10 11 12 0 5 10 15 20 25 D e liv e ra b ili ty Impact
Source: Scotland’s Centre for Regional Inclusive Growth
Interestingly, the mechanism for funding local authorities has not changed much over time, and certainly not since regional inclusive growth has risen up the policy agenda. Perhaps that needs to change?
Thirdly, there is often a basic tension at the heart of national economic policy over where resources are targeted, particularly in a world of tight public spending.
On the one hand, prioritising policy e orts at areas
of economic strength – like the strong parts of our cities – can create spill-overs, promote international
competitiveness and lead to national bene ts. But
on the other hand, it is arguably only by shifting resources to areas in economic need that can one realistically expect gaps to be narrowed.
We have seen this played out in recent months, most visibly in the case of North Ayrshire.
The decision to locate the new Medicines Manufacturing Innovation Centre (MMIC) close to Glasgow Airport might make sense from an agglomeration and connectivity perspective. From an inclusive growth perspective, it passed up an opportunity to support private sector activity and the creation of skilled jobs - as part of an Ayrshire Growth Deal – in an area of the country where such investment is rarely undertaken and much needed. The decision to locate the new Social Security Agency in Dundee was another such example. On this occasion, despite North Ayrshire being clearly
identi ed as scoring best for ‘inclusive growth’ it
was passed over by national policy makers because it was felt that the local authority might struggle to attract people to work there (despite transport links improving).
Anyone can agree or disagree with such a decision, and few would argue with the importance of
ensuring that the new Social Security Agency
performs e ectively from day one. But it arguably
highlights that even the Scottish Government itself – the key advocate of regional inclusive growth – often
nds it di cult to back-up its vision with investment
and funding support.
Finally, and an issue we have raised in previous commentaries, is that in attempting to be ‘all-things-to-all-people’, the policy landscape can become complex and cluttered.
Currently, we have a patchwork of 32 local
authorities, various City-Region Deals, a new suite of Regional Partnerships, not to mention the large number of strategies and programmes many of which have their own regional dimension (including 32 Single Outcome Agreements).
Coordinating such activity across boundaries,
di erent tiers of government (and governance) – often of di erent political hues – inevitably makes
Summary
Delivering regional inclusive growth is not easy.
Regional disparities re ect decades of social and
economic change, as well as the basic geography of Scotland.
The Scottish Government should be commended for pushing it up the policy agenda.
Ultimately, however, tackling regional inequalities
will only be achieved by investing signi cantly in
Scotland’s more fragile economic communities,
nding out what works (and what does not) and
prioritising some areas of the country over others whatever the impact on wider economic and political objectives.
Otherwise, we run the risk of continuing to talk about these issues while regional inequalities continue to widen.
N
A world leading
business school
on your doorstep
www.strath.ac.uk/fraser
Briefing event for Scotland’s Budget: 2018 report
‘Scotland’s Budget: 2018’ will once again provide an authoritative and independent analysis of Scotland’s devolved public finances ahead of the Scottish Government’s Draft Budget for 2019-20.
It will set out the choices and challenges facing the Finance Secretary and discuss some of the key policy issues of the day.
The publication of the report will be accompanied by a briefing event in Edinburgh.
Strathclyde Business School is an enterprising, pioneering institution of
global standing within a leading international technological university.
Our Department of Economics is home to the Fraser of Allander Institute
(FAI), one of Scotland’s leading independent economic research institutes.
8th
Nov
13th
Nov
Sign up
Understanding the Scottish Economy
1 day course
Identifying and interpreting changes in economic conditions can give businesses and public sector organisations an edge.
But for many, accessing clear and impartial information on how the economy is tracking can be anything but
straightforward. This 1 day CPD event aims to help.
Upon completion of the programme, you will be better able to follow economic developments and be able to relate them to your organisation’s day-to-day work.
25
Fraser of Allander Institute
Reappraising Scotland’s exports and their geographies:
Brexit and beyond
Ronald V. Kalafsky, University of Tennessee and Ross Brown, University of St Andrews
Abstract
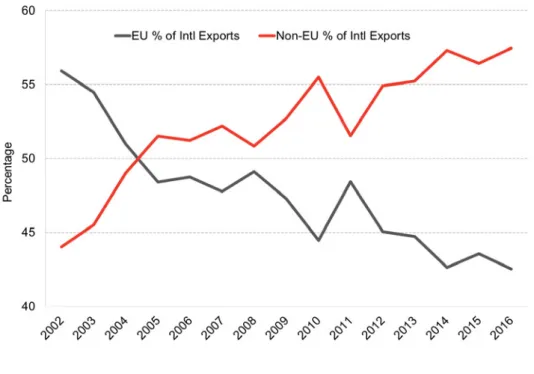
Firms internationalise to expand and diversify their sales, while policymakers see exports as a means of promoting productivity and economic growth. Exports therefore receive an increasing amount of attention given these positive attributes. Within this context, this paper presents data on the geographies and dynamics of Scotland’s export patterns. It shows that Scottish exports are highly concentrated within a small number of global markets, with Scottish firms exhibiting a decreasing reliance on exports to the European Union. Only a small minority of Scottish SMEs export and the majority of these firms derive less than a quarter of their sales from international markets. These lines of enquiry are presented within the context of the impending departure of the UK from the European Union and what this might mean for Scotland’s exporters. The paper ends with some indicative policy recommendations.
I Introduction
Policymakers understandably direct a fair amount of attention to exporting, given its potential for jobs, innovation and economic growth (Wright et al, 2007; Love and Roper, 2015). Underscoring this interest, a seminal paper on firm-level exporting motivations suggests that the policy-led support for exports, regardless of location, stems from the understanding that, “exports are good, and exporters are good firms; thus helping domestic firms export is good policy” (Bernard and Jensen, 2004, p. 561). Understandably therefore, trade policy has often been at the centrepiece of industrial policies within modern economies (Rodrik et al, 2004). Accordingly, a healthy amount of attention is paid to exporters and their dynamics at various scales. From a firm-level perspective, exporting offers the potential to expand beyond domestic or regional markets – markets that, in some cases, which may be in decline or offer diminished growth prospects. From a national perspective, exporting offers countries the ability to enhance their growth prospects. That said, the relationship between exporting and economic growth are
26
far from unequivocal (Mookerjee, 2006). The effects of exporting are often dependent on the
national milieu in which trade takes place and includes the composition of exports in terms of
individual products and services and even the destinations to which exports are sent. Clearly, the topic merits more attention and study.
This topic is particularly salient to Scotland, as a small, open economy with a limited domestic market. Accordingly, recent policy papers have examined the export dynamics of Scotland, finding that exports are critically important especially for some key sectors (Slow et al, 2015; Hamilton and Richmond, 2017). What these studies also suggest is that Scotland often lags much of the rest of the United Kingdom in key measures such as the number of firms engaging in exporting. This is reflected by fact that just 70 firms account for some 50% of Scotland’s total exports1.
Figure 1Export intensities for Scotland and the United Kingdom (exports as a percentage of GDP)
Source: Scottish Government 2018a; Scottish Government 2018b; World Bank 2018a. Calculations by Authors
As a starting point in this analysis, Figure 1 provides export intensities for Scotland since 2002 relative to the UK as a whole. Exports as a percentage of GDP are approximately a third lower in Scotland compared to the UK. Note the drop in exporting from 2002 to 2006, attributable to the
27
Fraser of Allander Institute
winding down of the predominantly foreign-owned, export-intensive (‘Silicon Glen’) electronics sector during this period. And while Scotland’s export intensity has rebounded since this and the ensuing global financial crisis, it has not returned to the levels seen in 2002.
At the outset, then, this suggests there is a significant and continuous “export gap” between Scotland and the rest of the UK. This weak export performance may in turn be partly attributable to the country’s weaker growth and productivity performance relative to the UK as a whole. It also raises questions about the international markets that Scottish exporters are serving and what insights such patterns might provide on the future export trajectories of Scotland. In line with this, the next section provides an examination of these export geographies.
II Scotland’s export geographies
There is a growing amount of research on the markets to which firms export and how these are selected, largely because of how these geographies might help to provide an understanding of export strategies and innovation. A large body of evidence points to firms exporting to nearby, familiar, or long-time markets – a pattern that is especially salient for small-and-medium-sized firms (SMEs) (Bernard, et al, 2007; Defever, et al, 2015). That is, exporters tend to minimize risks and costs by accessing geographically proximate markets or those markets with which they or associated firms have some familiarity or affinity. Indeed, this is reflected in the famous “Uppsala model” which is used to depict how firms select geographically proximate foreign markets with low levels of “psychic distance” (Johanson and Vahlne, 2007).
Within this context, what is considered to be a nearby, or for that matter, a distant market? Ghemawat (2001) neatly categorised distance (in terms of international business) into four distinct categories: geographical, cultural, administrative, and economic. The reason that these types of factors are mentioned is that in many ways, they are germane to Scotland’s export performance and to understanding its export geographies. What these frameworks suggest is that Scottish firms, especially less resourceful SMEs, typically favour neighbouring markets with low levels of geographical and physic distance.
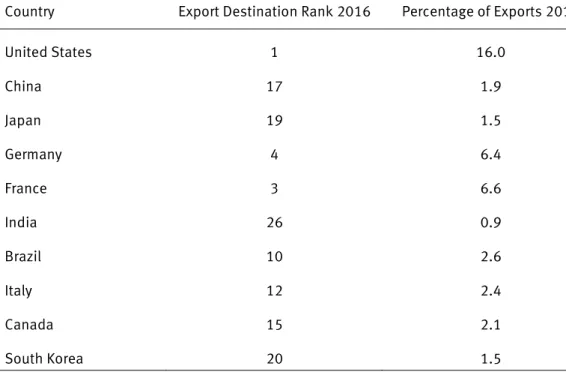
Figure 2 provides an examination of the leading destinations for Scottish exports in 2016. Note that the United States is far and away the leading destination, accounting for 16% of total Scottish exports. Notably, the second leading export destination, the Netherlands, accounts for less than half of that (i.e. 7.1%). The reasons why firms choose (or do not choose) specific