University of Tennessee, Knoxville
Trace: Tennessee Research and Creative
Exchange
Masters Theses Graduate School
5-2015
ANALYSIS OF FLAMMABILITY LIMITS AND
GAS PROPERTIES OF A SOLID ROCKET
MOTOR TEST IN A HIGH ALTITUDE TEST
FACILITY
Richard Scott Kirkpatrick
University of Tennessee - Knoxville, [email protected]
This Thesis is brought to you for free and open access by the Graduate School at Trace: Tennessee Research and Creative Exchange. It has been accepted for inclusion in Masters Theses by an authorized administrator of Trace: Tennessee Research and Creative Exchange. For more information, please [email protected].
Recommended Citation
Kirkpatrick, Richard Scott, "ANALYSIS OF FLAMMABILITY LIMITS AND GAS PROPERTIES OF A SOLID ROCKET MOTOR TEST IN A HIGH ALTITUDE TEST FACILITY. " Master's Thesis, University of Tennessee, 2015.
To the Graduate Council:
I am submitting herewith a thesis written by Richard Scott Kirkpatrick entitled "ANALYSIS OF FLAMMABILITY LIMITS AND GAS PROPERTIES OF A SOLID ROCKET MOTOR TEST IN A HIGH ALTITUDE TEST FACILITY." I have examined the final electronic copy of this thesis for form and content and recommend that it be accepted in partial fulfillment of the requirements for the degree of Master of Science, with a major in Aerospace Engineering.
Trevor M. Moeller, Major Professor We have read this thesis and recommend its acceptance:
Gregory D. Power, Montgomery L. Smith
Accepted for the Council: Dixie L. Thompson Vice Provost and Dean of the Graduate School (Original signatures are on file with official student records.)
ANALYSIS OF FLAMMABILITY LIMITS AND GAS PROPERTIES OF A SOLID ROCKET MOTOR TEST IN A HIGH ALTITUDE TEST FACILITY
A Thesis Presented for the Master of Science
Degree
The University of Tennessee, Knoxville
Richard Scott Kirkpatrick May 2015
ii
Dedication
This thesis is dedicated to my wife, Sarah Kirkpatrick, for providing love and support throughout my graduate studies. I also dedicate this thesis to my mother and father for providing encouragement throughout my studies.
iii
Acknowledgements
The Author wishes to express his sincere thanks to everyone that supported his thesis work. Thanks to UTSI for providing me an excellent opportunity to further my knowledge in aerospace engineering. Thanks to my thesis advisor, Dr. Moeller, for providing feedback and support for my thesis work. Thanks to my committee members, Dr. Monty Smith and Dr. Greg Power, for providing their time to serve as my thesis committee members. Thanks to Brent Bates and Andrew Redmon for providing me the training on how to perform the J-6 Facility Exhaust Gas Analysis and the support of my thesis work. Thanks to Randy Quinn for providing feedback on my computer program and my thesis. Thanks to Bart Stewart for setting a positive work environment and encouraging me to take initiative on my thesis work. Thanks to Chris Smith and Mackie Snipes for reviewing my thesis for public release. Thanks to all my friends, family and wife for providing support and encouragement throughout this whole process.
iv
Abstract
The testing of solid and liquid rocket propulsion systems in a confined test facility often produces explosive or flammable gases which must be safely handled. Often inert gases such as nitrogen are used to lower the molar fraction of oxygen to low enough levels to minimize the probability of an explosion or deflagration. For this thesis, the chemical composition of these rocket exhaust gases mixed with air were used to determine the flammability limits of the gas mixture. Using the ideal gas law and the conservation of mass, the exhaust gas composition and gas properties such as pressure, temperature, volume and mole fractions inside the test facility were calculated. This exhaust gas composition along with La Chatelier's law was applied to an air-free basis for calculating the flammability limits of the rocket exhaust gas in air. Using Test Driven Development and Object Oriented Programming, a computer program using the Python programming language was created with a Graphical User Interface (GUI) to automate these calculations. This program was validated using existing analytical techniques developed at the Arnold Engineering Development Complex (AEDC). The results from the Python program agree well, a maximum of 1.4% difference, with the validated AEDC techniques.
v
Table of Contents
Chapter 1 Introduction ... 1
1.1 Overview and Purpose of Thesis ... 1
1.2 Background ... 2
1.2.1 Flammability Limits of Rocket Exhaust Gas in Air ... 2
1.2.2 Altitude Simulation for Rocket Propulsion Systems ... 3
1.2.3 Overview of Exhaust Gas Handling Operations for the J-6 Test Facility ... 6
1.2.4 Summary of Research ... 9
Chapter 2 Analytical Methods ... 10
2.1 Overview of Analyses ... 10
2.2 Gas Properties Calculations ... 12
2.3 Flammability Limits of the Rocket Exhaust Gas in Air ... 18
Chapter 3 Program Methodology... 23
3.1 Background ... 23
3.2 Programming Techniques ... 24
3.3 Software Capabilities ... 25
Chapter 4 Results and Discussion ... 30
4.1 Introduction ... 30
4.2 Results and Discussion ... 30
Chapter 5 Conclusions and Further Work ... 43
5.1 Conclusions ... 43
vi
Bibliography ... 45 Vita ... 49
vii
List of Tables
Table 1. Dry Air Composition at 14.7 psia and 60 °F ... 14
Table 2. Upper and Lower Flammability Limits of Gases ... 19
Table 3. Example of Rocket Motor Exhaust Composition ... 27
Table 4. Rocket Motor Parameters ... 33
Table 5. Comparison of Predictions inside the J-6 Test Facility for the Prefire Operation Test Phase ... 37
Table 6. Comparison of Mole Fractions of the Gas inside the J-6 Test Facility at T-0 ... 38
Table 7. Comparison of Mole Fractions of the Dry Gas inside the J-6 Test Facility at T-0 ... 38
viii
List of Figures
Figure 1. Arnold Engineering Development Complex's J-6 Rocket Test Facility ... 4
Figure 2. Flammability Limits of Hydrogen and Nitrogen Mixed with Air ... 7
Figure 3. Control Volume of the J-6 Test Facility ... 13
Figure 4. Flammability Limits in Air ... 19
Figure 5. GUI for J-6 Facility Analysis Program ... 25
Figure 6. Screenshot of the Prefire Operations Tab ... 28
Figure 7. Screenshot of the Postfire Operations Tab ... 29
Figure 8. Schematic of a Rocket Motor with an Exhaust Diffuser ... 31
Figure 9. Rocket Motor Chamber Pressure ... 32
Figure 10. Rocket Motor Exhaust Mass Flow Rate ... 33
Figure 11. Pie Chart of the Rocket Exhaust Composition in Mole Percentages ... 34
Figure 12. Rocket Exhaust Gas Flammability Limits in Air before the Motor Firing ... 35
Figure 13. Flammability Limits of the Gas inside the J-6 Test Facility at Postfire ... 39
ix
Nomenclature
A area, in2CV control volume
CS control surface
L limit (reference to upper or lower flammability limit)
Isp specific impulse, sec
m mass, lbm
n number of moles, mol
⃗ normal vector
MW molecular weight, lbm/mol
t time, sec
P pressure, psia
Pvsat water vapor saturation pressure, psia
Ru universal gas constant, 1545.348 ft-lbf/R-mol
T temperature, °F
V volume, ft3
w mass flow rate, lbm/sec
⃗⃗⃗⃗⃗ fluid velocity, ft/sec
X mole fraction
Δt change in time, sec
ρ fluid density, lbm/ft3 Subscripts
x
fac facility
H2O water
N2 nitrogen
(s) specie or constituent of interest
1
Chapter 1
Introduction
1.1
Overview and Purpose of Thesis
It is often stated in the aerospace testing community, “Test as you fly. Fly like you test.”, meaning that testing should replicate the flight like conditions and vice versa. Ground testing of rocket propulsion systems is vital to ensure their safety and reliability. The testing of these systems comes with inherent risks associated with the flammable and often explosive rocket fuel mixtures.
At the Arnold Engineering Development Complex (AEDC) in Tennessee, solid
propellant rocket propulsion systems are tested at the J-6 Solid Rocket Motor High Altitude Test Facility. When these rocket motors are tested at J-6, the rocket exhaust gases must be properly handled to prevent an explosion.
For this thesis, the chemical composition of these rocket exhaust gases mixed with air were used to determine the flammability limits of the gas mixture. Using the ideal gas law the and conservation of mass, the exhaust gas composition and gas properties such as pressure, temperature, volume and mole fractions inside the test facility were calculated. This exhaust gas composition along with La Chatelier's law was applied to an air-free basis for calculating the flammability limits of the rocket exhaust gas in air. Using Test Driven Development and Object Oriented Programming, a computer program using the Python programming language was created with a Graphical User Interface (GUI) to automate these calculations.
2
1.2
Background
1.2.1 Flammability Limits of Rocket Exhaust Gas in Air
Rocket motors usually operate at an oxidizer/fuel ratio less than stoichiometric to achieve a higher exhaust gas temperature which improves the performance of the rocket motor, or more specifically, the specific impulse, Isp. When a rocket propulsion system is fired, its propellant is
converted to a gas through thermodynamic and chemical processes. The products of this process often contain gases that can be either flammable or explosive. In many situations, hydrogen and carbon monoxide gas can be produced after a rocket firing1.
Hydrogen gas can be dangerous if not properly handled due to its flammability and explosiveness. Hydrogen gas mixed with air is extremely flammable over a wide range of levels (4 % - 75 % by volume), and it takes a very low amount of energy to ignite hydrogen air
mixtures. After hydrogen is ignited, it can trigger either a deflagration (subsonic propagation) or detonation (supersonic propagation), with the severity of the resultant pressure from the
detonation increasing up to 8 times in magnitude in a closed volume2.
If a rocket motor is tested at a test facility that operates in an open environment, or more specifically sea-level conditions, these gases often do not produce an explosive or flammable hazard due the large volume reservoir of the atmosphere that dilutes the exhaust to a safe level; although in certain cases, afterburning of the exhaust gases can occur and must be considered. However, if these rocket motors are tested inside a closed or semi-closed control volume, these gases must be handled with care as the non-inert gases can be ignited when mixed with air.
For combustion to occur in the rocket exhaust gas mixture, there must be an ignition source, oxidizer and fuel present in the gas mixture. The ratios of combustible gases must be at
3
appropriate concentrations for combustion to occur. In addition, the ignition source must be energetic enough to initiate combustion. Eliminating the fuel source for rocket motor testing is not practical for obvious reasons in that the propellant formulations cannot be changed.
Minimizing ignition sources is highly encouraged but can be very difficult, as a hydrogen and air mixture requires a minimum ignition energy of only 0.017 mJ to ignite3. Thus, it is often
common to use an inert gas such as nitrogen to reduce the oxygen content levels low enough to reduce the probability of combustion.
1.2.2 Altitude Simulation for Rocket Propulsion Systems
The topic of this thesis is being applied to the Arnold Engineering Development
Complex’s (AEDC) J-6 Solid Rocket Motor High Altitude Test Facility. Thus, it is important to provide some background information about the J-6 Test Facility.
Typical high-altitude test facilities consist of a test cell, exhaust diffuser, ejector system, and facility pumping systems. Some examples of these altitude test facilities for rocket
propulsion systems include Arnold Engineering Development Complex's (AEDC) J-6 test facility (Fig. 1)4 and NASA Stennis Space Center's A-3 test facility5.
For an altitude simulated test of a rocket propulsion system, the rocket test system is mounted in the test cell and fires directly into the exhaust diffuser. Typically exhaust diffusers are equipped with an ejector system that is operated either by steam or air. This steam ejector system helps induce a low pressure environment for the test cell, and also helps the rocket nozzle flow to become properly established, a.k.a. started. Through the use of momentum exchange or Newton’s 2nd
Law, the momentum of the steam lowers the pressure inside the test cell. Steam ejectors also act as a check valve or quick operating pneumatic valve during engine shutdown to
4
prevent the rapid transient of flow back into the test cell6. This phenomenon is often referred to as “blowback” in the test community and is caused by the high pressure differential between the test cell and downstream test area.
An operation of a high-altitude test facility for rocket propulsion systems may be as follows:
1. Since the steam-ejector diffuser must operate at a low enough back pressure to become
started, pumping devices such as staged steam ejector or turbomachinery are used to lower the pressure inside the test facility. This pressure requirement is based on the operating pressure of the steam-ejector diffuser system and the specific rocket propulsion system.
5
2. The steam ejector is turned on and thus further reduces the pressure of the rocket test cell.
3. After the ejector system reaches steady-state, the rocket engine is ignited.
4. The rocket propulsion firing ends. The steam ejector continues to fire to prevent a rapid pressure transient due to the pressure differential between the rocket test cell and downstream area.
5. Ejector pressure is gradually reduced to equalize the test cell pressure with the test facility pressure or ambient pressure.
AEDC’s J-6 test facility operates under a closed volume approach meaning that all of its exhaust gas products are collected inside the test facility’s Dehumidification Chamber
downstream of the diffuser/ejector before they are released to the environment. Other facilities such as NASA Stennis Space Center’s A-3 test stand operate under an open control volume, and thus send their exhaust gases directly to the surrounding environment.
Operating under a closed volume approach for altitude simulation has pros and cons. The advantages include, but are not limited to, the ability to treat exhaust gases before releasing them to the environment and the capability of using pumping devices such as axial compressors to assist the ejector in simulating low pressure conditions. The disadvantages include the
requirement of a facility, which can often be very large, to contain the gases and the confinement of potentially explosive gases in a closed volume. By confining these gases inside a facility, the associated risk with explosive gases is much greater than operating in an open environment. However with proper test practices, these explosive gases can be handled safely. As mentioned
6
previously, most test facilities, including AEDC’s J-6 test facility, use nitrogen as an inert gas to reduce the associated risk.
When firing a rocket motor, the J-6 test facility must also account for the facility gas pressure since the steam ejectors are only able to operate in a range of back pressures. If the pressure inside the facility becomes too high, the steam ejector and rocket exhaust flow into the diffuser can become “unstarted”. This is highly undesirable since “started” flow is required to simulate the low pressure conditions and to prevent the “blowback”.
1.2.3 Overview of Exhaust Gas Handling Operations for the J-6 Test Facility
At AEDC, the J-6 Test Facility has three methods for the safe handling of exhaust gas products for solid rocket motor testing. These three methods are “too inert to burn”, “too fuel rich to burn” and a “combination of too inert to burn and too fuel rich to burn”.
The flammability limits of hydrogen and nitrogen mixed in air are shown in Figure 2 and were derived from the United States Bureau of Mines7. For the too inert to burn region, the ratio of inert gas to flammable gas of approximately 16.5 by volume is required for the gas mixture to be too inert to burn. For this mode of operation, nitrogen gas is added to the test facility prior to motor firing to ensure that the gases remain in the too inert to burn zone. Since the J-6 test facility has about 5.0 million ft3 of volume, the required amount of nitrogen needed results in a gas pressure that remains below the breakdown pressure of the steam ejector. In addition, the pressures also remain below atmospheric, which is required since the J-6 test facility cannot contain these gases above atmospheric pressures8.
As can be seen from Figure 2, any addition of air into the test facility would still keep the too inert to burn along as the gas remains in this too inert to burn region. This mode of operation
7
is typically reserved for smaller rocket motors, which is typically less than 32,000 lbm of
propellant for the J-6 test facility. The removal of exhaust gases from the J-6 test facility can be completed by opening the J-6 test facility air in-bleed valves, and then using the test facility exhaust fans to vent the exhaust products directly to atmosphere8.
Figure 2. Flammability Limits of Hydrogen and Nitrogen Mixed with Air [7]
For the larger rocket motors that require the “too fuel rich to burn” operation, the required amount of nitrogen needed to make the rocket motor exhaust gas “too inert to burn” would increase the test facility pressure above atmospheric pressure. As shown in Figure 2, the oxygen content must be below 5% (AEDC uses 4% to ensure a safety factor of 1.2) for the gas to be
8
nonflammable. If air was to be added to the facility in sufficient quantities, the gas would pass through the flammable zone and thus an explosion or deflagration is highly possible. Thus, it is highly desirable for the air inleakages, the amount of air that is leaked from the atmosphere into the test facility, to be as low as practically possible8.
Unlike the “too inert to burn” operation, these exhaust gases cannot be mixed with large amounts of air since the gas mixture would pass through the flammable zone. Instead, the removal of exhaust gases through AEDC’s Engine Test Facility’s A/B Exhaust Plant is used. Nitrogen gases are used to lower the oxygen content at the exhaust plant below 4% to ensure that the plant remains safe. For more details on how these operations are conducted, the reader is advised to see Reference 8.
Finally, the “combination of too inert to burn and too fuel rich to burn” operation is used for motors that fall between the too inert to burn and too fuel rich to burn operation. For this operation, the exhaust products are initially too fuel rich immediately after the rocket motor firing. However, the pressure inside the facility remains low enough after the rocket firing that enough nitrogen can be added to make the gases too inert to burn while maintaining the pressure below atmospheric pressure. This allows the exhaust gases to be sent directly back to the
atmosphere in a similar manner to the too inert to burn operation.
For this thesis, the following guidelines of the resultant pressure from the combination of the rocket motor exhaust gases will be used for determining the required inerting operations:
9
Too Inert to Burn: Pfac ≤ 5.25 psia
Combination of Too Fuel Rich to Burn and Too Inert to Burn: 5.25 psia < Pfac < 14.7 psia
Too Fuel Rich to Burn: Pfac ≥ 14.7 psia
It should be noted that these pressures are simply guidelines established at AEDC for determining the required type of operation for handling rocket exhaust products inside the J-6 test facility. Typically, solid rocket motor exhaust composition does not vary significantly from motor to motor so these guidelines can be used. The flammability limits of each rocket motor’s exhaust products mixed with air are used to establish these requirements.
1.2.4 Summary of Research
The required analysis for determining the flammability limits and the gas properties of the rocket exhaust gas mixed with air will be presented. The gas properties, which include the pressure, temperature, volume, water vapor saturation pressure and species concentration, were calculated using the ideal gas law and the conservation of mass equations. After the mole fractions of the gas mixture were calculated, the flammability limits of the gas can be calculated using La Chatelier’s law for an air free basis. A computer program was written using the Python programming language. A Graphical User Interface (GUI) was developed to provide an easy to user interface to potential users of the software. This Python program can display the results of the gas properties and the flammability limits for various phases of the test operations. All of these results were validated using an existing and validated AEDC analytical tool. The results between the Python program and AEDC’s analytical tool agree very well with the maximum difference between the results being 1.4%.
10
Chapter 2
Analytical Methods
For this chapter, the analytical techniques for this research topic will be discussed. It is important to discuss some introductory and background topics before proceeding into the detailed calculations.
As mentioned in Chapter 1, solid rocket motor exhaust gases in a confined facility are often treated with gaseous nitrogen in order to make the gas mixture non-flammable. The techniques for determining the amount of nitrogen for inerting a combustible gas mixture is a well understood field mostly due to the work of the U.S. Bureau of Mines (USBM) in the early 1900’s.
Founded in 1910, the USBM was formed after numerous catastrophic mine disasters. Many of these disasters involved explosions of flammable gases. Thus, much research was pursued to better understand the physics of flammable gases. It was not until September 1995 that the USBM was closed, after the US Congress voted to close USBM and to transfer certain functions to other Federal agencies9. Many of the analyses presented in this thesis can be contributed to valuable work from the USBM and its affiliates.
2.1
Overview of Analyses
Before the gas control volume and flammability limits analyses can proceed, the motor manufacturers must provide detailed information about their rocket motor. This information includes the propellant composition, the nozzle geometry, the mass of the propellant and the predicted motor performance curves, which include the chamber pressure, exhaust mass flow and
11
motor thrust. The next step is to predict the rocket exhaust gas properties which include the species concentration (mole fractions and mass fractions), the static temperature, T0, ratio of
specific heats, γ, and so forth. It is common for the motor manufacturer to provide the predicted nozzle exit properties; however, if they do not provide this information, AEDC will use NASA’s chemical equilibrium performance code SP-27310 to predict the exhaust properties. Most of AEDC’s analyses using SP-273 assume equilibrium composition upstream of the nozzle exit and frozen flow downstream of the nozzle exit.
After the exhaust properties have been predicted, the control volume calculations can begin. The control volume calculations predict the facility pressure, temperature, volume, species concentrations and masses, and water vapor saturation pressure. The mass flow rates entering the test facility due to the air leaks from the atmosphere into the test facility, also referred to as air inleakage, rocket motor firing, nitrogen inerting and water cooling are
considered; in addition, the mass flow rate leaving the facility due to the AEDC’s exhaust pumps is considered. Finally, the flammability limit calculations can commence once the species concentration and species masses are determined.
It is important to note that these calculations outlined in this thesis do not include all the facility analyses required before firing a rocket motor. Additional analyses include the predicted test cell pressure during the rocket motor firing and the amount of water, liquid nitrogen, gaseous nitrogen, and steam that will be used. However, it is the intention of the author to include these analyses in future program upgrades.
12
2.2 Gas Properties Calculations
The gas properties calculations of the rocket exhaust gas mixture with air are required before proceeding with the flammability limit calculations. The species concentrations, or mole fractions, are used to calculate the flammability limits. In addition, the facility pressure
predictions are needed to ensure that the facility pressure does not exceed atmospheric pressure since the test facility cannot contain the gases above atmospheric pressure. The facility pressure calculation is also useful for ensuring that the flow inside the exhaust diffuser will remain started
since the rocket flow will breakdown if the maximum allowable backpressure is exceeded. For the control volume calculation, a one dimensional, isentropic, ideal and uniformly mixed gas and unsteady state control volume are assumed. Using the Reynold’s Transport Theorem, the equation to represent the conservation of mass in a moving control volume can be derived (Eq. 1),
∫ ∫ ⃗⃗⃗⃗⃗ ⃗ (1)
where msys is the mass of the fluid in the control volume, t is the time, CV is the control
volume, CS is the control surface, ρ is the fluid mass density, ⃗⃗⃗⃗⃗ is the velocity vector of the fluid, ⃗ is the normal vector to the control surface of interest, and A is the area of the control surface11.
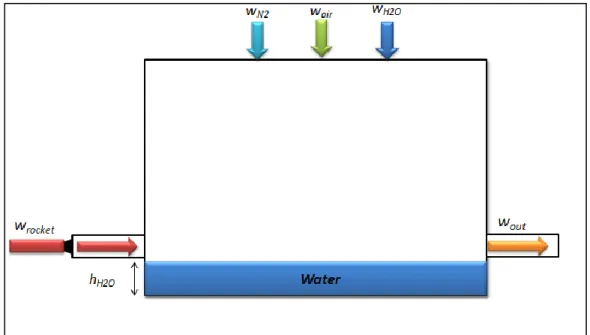
For this analysis, the control volume of interest will be the test cell, exhaust gas diffuser, the saturation cooler and the Dehumidification Chamber. Fig. 2 provides a diagram to represent the control volume.
13
The control volume analysis for the J-6 test facility must account for the mass flow rates of the nitrogen, air inleakage, cooling water, and rocket exhaust gas entering the facility, and the mass flow rate leaving due to the exhaust pumps. In addition, the height of water, hH2O,
accumulated in the test facility must be accounted for since it is significant enough to vary the facility volume which affects the facility pressures. This necessitates the moving control volume in this analysis.
Figure 3. Control Volume of the J-6 Test Facility
Using Eq. 1, the control volume equation for the test facility can be represented by Eq. 2
14
where mcvis the mass of the gas inside the control volume, is the density of the gas and
w is the mass flow rates of the nitrogen, air inleakage, cooling water, rocket and the exhaust pumps.
For this case, the initial mass, minitial, of the gas inside the control volume can be
determined by assuming dry air at 14.7 psia and 60 °F. The air is assumed to be dry for inerting calculations since the oxygen molar fraction is higher for dry air versus non-dry air. Thus, the worst case scenario for inerting requirements must be considered for safety precautions. Table 1 lists the composition for dry air for these conditions12.
As can be seen from Table 1, nitrogen and oxygen are the main compounds found in dry air. The actual gas composition of dry air does contain other constituents such as neon, helium, methane and others. However, for this analysis, we assume that these compounds are not present since their amounts are much smaller when compared to argon, carbon dioxide, nitrogen and oxygen.
Table 1. Dry Air Composition at 14.7 psia and 60 °F [12] Specie
Molecular Weight (lbm/lbm-mol)
Mole Fraction Mass Fraction
Argon (Ar) 39.948 0.00932 0.01286
Carbon Dioxide (CO2) 44.0098 0.00030 0.00046
Nitrogen (N2) 28.01348 0.78088 0.75524
Oxygen (O2) 31.9988 0.20950 0.23144
15
Assuming saturated conditions at 60 °F, the mole fractions for the species in standard air at 14.7 psia can be calculated with Eq. 3
(3)
where is the pressure of the gas inside the test facility, X(s)is the mole fraction of the
compound of interest, and Pvsatis the water vapor saturation pressure.
Using a polynomial 5th order curve fit from data obtained from Keenan13, Eq. 4 can be derived for the water vapor saturation pressure as a function of temperature,
(4)
where T is the temperature in °F and the units of pressure is psia.
Eq. 3 gives the mole fractions for argon, carbon dioxide, nitrogen, and oxygen but since we are assuming saturated conditions for calculating the test facility pressure, the water vapor content must also be considered; recall that a dry gas will be assumed for the inerting
calculations. The mole fraction for water vapor can be represented by Eq. 5
(5)
Once the mole fractions of the species are determined, the amount of moles for each species must be calculated. For all of the species besides water, the amount of moles per specie can be calculated using the ideal gas law
16
(6)
where Vfac is the volume of the gas inside the test facility, Ru is the universal gas constant,
and Tfac is the temperature of the gas inside the test facility.
Using a standard periodic table to determine the molecular weights of the specie, Eq. 7 can be used to calculate the masses of the specie
(7)
where MW(s) is the molecular weight (lbm / lbm-mol) of the specie, and n(s) is number of
moles of the specie.
Equations 3 – 7 provide a foundation for many of the remaining control volume
calculations. As mentioned, they are very useful for determining the initial conditions of the gas inside the test facility.
Once the initial conditions of the test facility are known, the effects of mass flow rates of the nitrogen, air inleakage, water cooling, rocket exhaust gas and exhaust pumps on the gas properties can be determined.
Assuming that wN2, wH2O, wrocket, woutand wair are all known, the new amount of mass of
the gas inside the control volume can be calculated by Eq. 8
(8)
The water mass flow rate from the cooling water, wH2O,is not considered since it is
17
Dehumidification Chamber. This assumption holds valid as long as the gas inside the test facility remains saturated. The calculation of the water vapor saturation pressure from Eq. 4 ensures that this assumption is valid.
Since the water flow rates are high enough to significantly affect the volume, the volume of the gas must be recalculated for every time step. The equation for calculating the facility’s volume at a particular point in time is
(9)
where is the density of the water. Since the water is assumed to remain in liquid
form and reach the bottom of the J-6 Dehumidification Chamber, the total mass of the gas inside the test facility remains is not affected by equation 9. However, the pressure does increase as due to the decreased volume of the gas.
Assuming saturated conditions at the test facility’s gas temperature, the mole count of the water vapor can be calculated by Eq. 10.
(10)
Using the total amount of moles of the specie and the ideal gas law, the new facility pressure then can be calculated by Eq. 11
∑
(11)
18
2.3 Flammability Limits of the Rocket Exhaust Gas in Air
Using the information from the gas properties calculations, the flammability limits analysis can be presented. While there are many different flame characteristics which include flame temperature and flame velocity, the flammability limits are the most important to be considered for this analysis.
The flammability (or deflagration) limits define the extreme compositional limits that will support a flame if an external ignition source is provided. Flammability limits depend on the flammable product and oxygen volume percentage levels, amount of inert products, temperature and pressure of the gas14. An example of a flammability limit plot is shown in Figure 3.
This plot was taken from data from the U.S. Bureau of Mines7and shows the upper and lower flammability limits of various gases in air. The first part of the label (before the hyphen) is the fuel whereas the second part of the label is the inert product. For example, H2-N2 is hydrogen as the flammable gas paired with nitrogen as the inert gas.
The Upper Flammability Limit (UFL) and the Lower Flammability Limit (LFL) are the upper and lower part of the curves or the triangular area, respectively. Any area above the curve is said to be too fuel rich to burn, whereas the area below the curve is too fuel lean to burn. The area to the right of the curve is known as too inert to burn. Finally, the area inside triangular area is known as the flammability region, which is what should be avoided for safe testing operations.
For many specific compounds or species such as hydrogen or carbon monoxide, the upper and lower flammability limits have been determined when mixed with air at atmospheric pressure and room temperature15, 16or other inert gases such as gaseous nitrogen or carbon
19
dioxide. Table 2 gives a list of the upper and lower flammability limits in percent by volume of some common gases.
Figure 4. Flammability Limits in Air [7]
Table 2. Upper and Lower Flammability Limits of Gases at Room Temperature and Atmospheric Pressure[15, 16]
Gas Lower Flammability Limit Upper Flammability Limit
Carbon Monoxide (CO) 12.5% 74.0%
Methane (CH4) 5.0% 15.0%
20
For this analysis, it will be assumed that the flammability limits are not affected by the gas pressures and temperatures. This assumption can be considered valid since previous studies have determined that pressure and temperature effects on the flammability limits are negligible unless the pressure is above 10 atm or the temperature is above 200 °F16.
By using this experimental data and Le Chatelier’s law17, one can determine the upper and lower flammability limits of a gas mixture in air.
The expression of La Chatelier’s law for calculating the upper and lower flammability limits of a gas is defined as
(12)
where L is the limit of the mixture of combustible gas, p1, p2, p3, .., pn are the mole
fractions of each combustible gas present in the original mixture, and L1, L2, L3, …, Ln are the
limits of the each combustible gas present in the original mixture17. For this equation to be valid, the summation of the proportions of each gas must add up to be 1.0.
An example provided of the use of La Chatelier’s law is provided by Jones7. Suppose you are given the composition of natural gas defined in Table 3.
Using Eq. 12, the lower flammability limit of the gas mixture is
21
Generally, this formula is considered accurate for most scenarios. For mixtures of hydrogen, carbon monoxide, and methane, taken two at a time or all together, the flammability limits can be calculated with approximate accuracy18. There are situations where the La
Chatelier’s law predictions can be much different from actual data. For example, the prediction of the lower and upper flammability limits for vapors, such as ether or acetone, are not very accurate due primarily to a phenomenon known as a cool flame19; a cool flame is a type of flame that has a maximum temperature about 752 °F20. Thus, one must be careful when using La Chatelier’s law for calculating the flammability limits of a gas.
Table 3. Composition of Natural Gas with Lower Flammability Limits [7]
Gas Percent by Volume Lower Flammability Limit
Methane 80% 5.3%
Ethane 15% 3.22%
Propane 4% 2.37%
Butane 1.0% 1.86%
This formula can be extended to calculate the flammability limits of a rocket exhaust gas mixture in air. The U.S. Bureau of Mines outlines the procedure as follows7:
1. The composition of the mixture is first recalculated on an air-free basis; the amount of each gas is expressed as a percentage of the total air-free mixture.
22
2. A somewhat arbitrary dissection of the air-free mixture is made into simple mixtures, each of which contains only one flammable gas and part or all of the nitrogen or carbon dioxide.
3. The limits of each mixture thus dissected are read from tables or curves. 4. The limits of the air-free mixture are calculated using La Chatelier’s law.
Thus, this formula can be used to calculate the amount of nitrogen gas required to make the gas nonflammable.
23
Chapter 3
Program Methodology
3.1 Background
In Chapter 2, the analytical techniques were discussed that involved the calculations of the gas properties and flammability limits of the rocket exhaust gas. For Chapter 3, the computer program that was developed to automate these calculations will be discussed. Even though the focus of this thesis is the underlying physics and validation of the computer program, it will be worthwhile to discuss the techniques used for developing the computer program. It will be especially important to the end users of the software.
The Python programming language was used to develop an analytical tool for analyzing the rocket exhaust gas properties and flammability limits inside AEDC’s J-6 rocket test facility. Python is an interpreted, objected-oriented, high-level programming language with dynamic semantics. Its high-level built in data structures, combined with dynamic typing and dynamic binding, make it very attractive for rapid programming development, as well as for use as a scripting or glue language to connect existing components21.
Python was chosen as the programming language of choice for this thesis because of its ease of use, quick development, readability, extensive library support and Graphical User Interface (GUI) support. While Python is not considered the fastest of computer programming languages, none of the previous calculations involve intensive computations22. Languages such as Java or C++, which are faster programming languages than Python, were not used. In addition, Python’s support of dynamic typing was considered a very strong point for this
24
program development. Dynamic typing is the process of verifying the type safety of a program at runtime. For example, programming languages such as C++ or Java require that the user specify the data types for variables (int, char, float) whereas Python does not require this. While the use of dynamic typing does reduce the computational speeds due to compiler optimization routines, this allows for quicker development for the user23.
3.2 Programming Techniques
Test Driven Development, which is an evolutionary approach to software development which combines test-first development where you write just enough production code to fulfill that test and refactoring24, was used throughout the software development. Test Driven Development was found to be highly useful for this software development effort because it supported the rapid validation of software changes and helped with the design of program modules. Objected-Oriented Programming (OOP) was also employed. OOP was used for software development because it supports modularity, maintainability and the ease of adding additional features to the code.
Software configuration management was done via TortoiseSVN. TortoiseSVN is easy to use Revision control / version control / source control software for windows. It is based on ApacheTM Subversion (SVN)®25.
Code documentation was continuously written as the code was developed. Every module or program includes a specification which defines the purpose of the module, required inputs and expected output. The code also has inline program comments throughout the code. This thesis also serves the purpose of providing code documentation, specifically for the underlying physics and software validation.
25
Peer reviews were conducted with potential end users. Their feedback was used to help improve the software’s features.
QtDesigner©
for Python
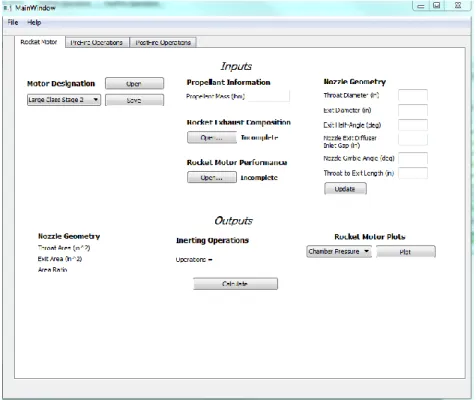
26 was used to develop a GUI, allowing the user to easily interface with the program. Fig. 4 shows a screen shot of the GUI for this program.3.3 Software Capabilities
While most of the software capabilities will be discussed in Chapter 4, it will be worthwhile to give a brief overview of the software’s capabilities.
The purpose of this software is to provide AEDC engineers with the ability to automate the control volume and flammability limit calculations rocket motor testing inside the J-6 test facility.
26
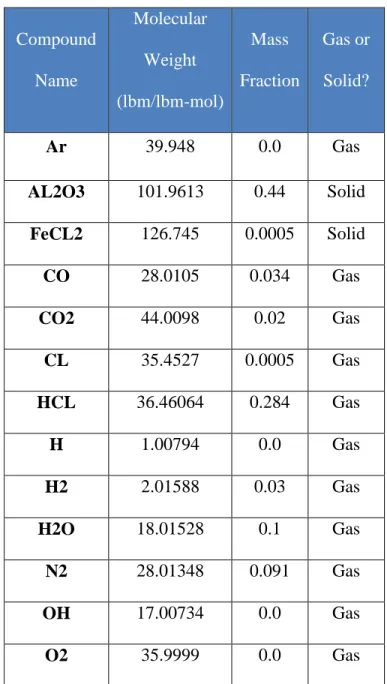
The first tab on the GUI of the J-6 facility analysis program, as shown in Fig. 5, is used for defining the rocket motor parameters. The user defines the mass of the propellant, rocket motor exhaust composition, predicted motor performance and the nozzle geometry. Comma separated value (CSV) files are used for defining the motor propellant composition and the motor performance curves. Table 3 gives an example of a CSV file that defines the rocket motor exhaust composition for a fictional rocket motor. Note that the first row, which labels the
columns, is not used in the CSV file. For the motor performance CSV file, the user must specify the time (1st column, sec), chamber pressure (2nd column, psia) and mass flow rate leaving the nozzle (3rd column, lbm/sec). Once all this information is provided to the program, the user can display the motor performance curves (chamber pressure and mass flow rate), mole and mass fraction pie charts and the flammability limit graph of the rocket motor. Examples of these will be given in Chapter 4. In addition, the user can also determine the type of inerting operations that are required for that specific motor. The three inerting operations that are used are “too inert to burn”, “too fuel rich to burn” and “a combination of too inert to burn and too fuel rich to burn”, which were discussed in Chapter 1.
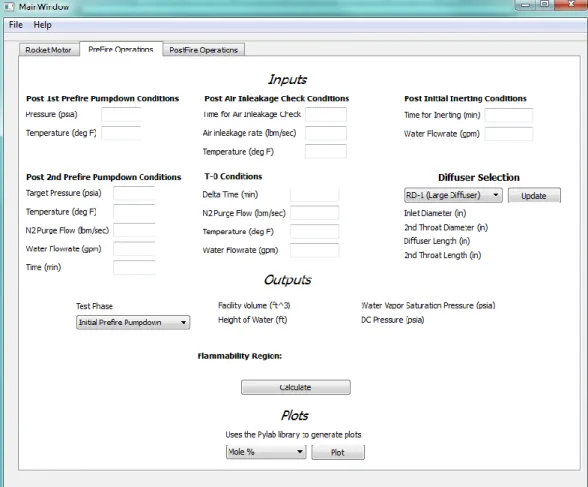
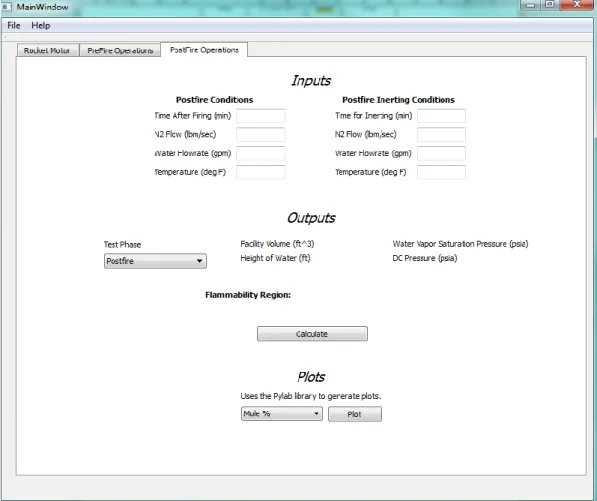
Once all the information is provided for the rocket motor, the gas properties and flammability calculations can proceed by selecting the PreFire or PostFire Operation tabs. AEDC defines the prefire operations as the operations that take place before the motor is fired, and the postfire operations as the operations that take place after the rocket motor has been fired. Figures 5 and 6 show a screenshot of the PreFire Operations and PostFire Operations tabs, respectively.
27
Table 3. Example of Rocket Motor Exhaust Composition
Compound Name Molecular Weight (lbm/lbm-mol) Mass Fraction Gas or Solid? Ar 39.948 0.0 Gas AL2O3 101.9613 0.44 Solid FeCL2 126.745 0.0005 Solid CO 28.0105 0.034 Gas CO2 44.0098 0.02 Gas CL 35.4527 0.0005 Gas HCL 36.46064 0.284 Gas H 1.00794 0.0 Gas H2 2.01588 0.03 Gas H2O 18.01528 0.1 Gas N2 28.01348 0.091 Gas OH 17.00734 0.0 Gas O2 35.9999 0.0 Gas
For each of these tabs, the user defines the facility parameters for various stages of the test operations. These parameters can include the facility pressure, temperature, water flow rates, air inleakage rates and nitrogen flow rates. In addition, the user can also select three
28
different sized rocket diffusers based on the size of the rocket motor. Once this information is entered, the user can display J-6 test facility parameters which include the facility pressure, height of the water inside the Dehumidification Chamber, amount of volume of the gas inside the J-6 Dehumidification Chamber, the water vapor saturation pressure and flammability zone. In addition, one can display pie charts for the mole and mass fraction percentages and the resulting flammability limits. Examples of this will be given in Chapter 4.
29
30
Chapter 4
Results and Discussion
4.1
Introduction
This chapter will discuss the analytical results from the Python computer program that was created for this thesis. Although the program was validated using the specifications of a rocket motor that was tested at AEDC, these data will not be presented due to public release concerns. Generic and fictional motor performance and motor exhaust gas composition data will be used in this thesis to validate this program. The analytical results will be validated using an existing, validated analytical tool developed at AEDC1.
4.2
Results and Discussion
As mentioned in the previous chapter, the Python computer program requires specific knowledge about the rocket motor to begin the analysis. This information includes thepredicted exhaust composition at the rocket nozzle exit, the rocket motor performance curves (the chamber pressure and mass flow rates as a function of time), the propellant mass and the nozzle geometry. The nozzle geometry includes the throat diameter, dth, exit diameter, dne, exit half-angle, αne,
nozzle exit diffuser inlet gap, Ld, nozzle gimbal angle, θne, and the throat to exit length, Ln.
Figure 7 shows a schematic of a rocket motor that defines these geometric parameters.
Fictional rocket motor performance curves were used to validate the Python computer program. These motor performance curves are shown in Figures 8 and 9 and the motor
1 This analytical tool developed at AEDC is not listed in any AEDC publications but is based on techniques
discussed in this thesis. If you are interested in this tool and are a DoD employee or DoD contractor, please contact the author for more information.
31
parameters are listed in Table 4. It is important to note that these motor performance parameters were not checked for physical feasibility. However, their information still can be used to
validate the program since the program is not dependent on accurate motor performance predictions.
Once these motor parameters are defined on the 1st tab of the Python computer program, the user can then display the rocket motor plots which include the rocket exhaust gas mole fractions, rocket exhaust gas mass fractions, the motor performance curves and the flammability limit curves. In addition, the user can also determine the required inerting operations that need to be used for the rocket motor.
32
Figure 10 shows the resultant pie chart for the rocket exhaust gas mole fractions. For this generic rocket motor example, we can see that hydrogen (H2) is the dominant compound in terms of mole fractions for the rocket exhaust composition. This is common in solid rocket motors since a higher fuel ratio helps improve the specific impulse of the motor1. Other compounds such as aluminum oxide (Al2O3), carbon monoxide (CO), hydrogen chloride (HCl), and water (H2O) also make up a strong portion of the composition.
33
Figure 10. Rocket Motor Exhaust Mass Flow Rate
Table 4. Rocket Motor Parameters
Parameter Value
Propellant Mass (lbm) 60000.0
Throat Diameter (in) 8.0
Exit Diameter (in) 70.0
Exit Half-Angle 11.0°
Nozzle Exit Diffuser Inlet Gap 10.0
Nozzle Gimbal Angle 5.0°
34
Figure 11. Pie Chart of the Rocket Exhaust Composition in Mole Percentages
Figure 12 shows the upper, lower and stoichiometric flammability limit curves of the rocket exhaust gas inside the J-6 test facility. As expected the curve has a wide flammability region due to the large amount of hydrogen gas present in the rocket exhaust gas. This curve shows that an inert to flammable mole ratio of approximately 11.0 is required to be in the too-inert-to burn region. The upper flammability limit (UFL) peaks at approximately 75% whereas the lower flammability limit (LFL) has a minimum value of 8%. Thus, any gas with an inert to flammable mole ratio of less than 11.0 and a flammable and inert gas ratio to air between 8% and 75% is considered flammable; otherwise the gas is considered non-flammable. This plot will be
Ar 0.00% CO2 1.96% N2 9.05% O2 0.00% CO 25.72% H2 30.02% H2O 6.40% BI 0.00% CL 0.04% H 0.00% HCL 16.60% OH 0.00% FeCL2 0.03% PO 0.00% PO2 0.00% AL3O3(a) 10.17%
35
necessary to ensure that gas inside the test facility remains outside this flammable region throughout the entire test operations.
Figure 12. Rocket Exhaust Gas Flammability Limits in Air before the Motor Firing
The Python program predicts that the resultant pressure from the combination of the rocket exhaust gases and the required amount of nitrogen will result in a pressure of 16.04 psia, and thus will require the “too fuel rich to burn” operations. This agrees with AEDC’s historical experience which shows that solid motors that have more than 32,000 lbm of propellant will require the “too fuel rich to burn” operations defined in Chapter 1.
After the rocket motor parameters have been defined, the next step is to input the prefire test operation parameters. The prefire operations tab requires that the user input various
36
parameters that define various phases of the prefire operations. The test phases in the prefire operations include:
Post 1st Prefire Pumpdown: phase of test operations that occur after the Engine Test Facility (ETF) A/B Exhaust Plant pumps down the J-6 test facility
Post Air Inleakage Check: test phase used for determining the amount of air inleakage inside the J-6 test facility
Post Initial Inerting: test phase that occurs when Liquid Nitrogen (LN2) and Gaseous Nitrogen (GN2) are added to the test facility for inerting purposes
Post 2nd Prefire Pumpdown: test period for when the ETF A/B Exhaust Plant pumps down the test facility again after the post initial inerting phase. This operation is only required for the “too fuel rich to burn” operation.
T-0: test phase that occurs from T-8 min to the motor firing.
The parameters that can be defined for these phases include the test facility pressure, temperature, air inleakage rate, nitrogen flow rates, time per phase and cooling water flow rates. Table 5 compares the predicted conditions inside the J-6 test facility from the Python program to the existing AEDC analytical tool.
Overall, the predictions from the J-6 analysis program agree very well with AEDC’s existing analytical tool. The largest difference occurs in the test facility gas pressure prediction, which disagrees by approximately 0.849%.
As stated in Chapter 3, the program can also calculate the gas composition for each of the test phases. The program can display the mole fractions of the gas assuming dry and non-dry gas conditions. Tables 6 - 7 show these predictions from the analysis program compared with
37
AEDC’s existing analytical tool. The mole fraction prediction for the dry gas at T-0 shows that the nitrogen gas makes up the largest percentage of all the gases. This is to be expected since large amounts of nitrogen are needed to make the gas non-flammable because of the large amounts of hydrogen present in the gas mixture.
Table 5. Comparison of Predictions inside the J-6 Test Facility for the Prefire Operation Test Phase Parameter Python Program Predictions AEDC Analysis Predictions Difference Gas Volume 4,670,300.3 ft3 4,670,289.24 ft3 2.368 x 10⁻⁴ % Height of Water 4.13 ft 4.13 ft 0.0 %
Water Saturation Pressure 0.596 psia 0.596 psia 0.0 %
Pressure 1.426 psia 1.414 psia 0.849%
Figure 13 shows the predicted flammability limit plots for the postfire predictions from the Python program and compares it with the existing AEDC analytical method. For the Python program, the predictions for the mole ratio of inert to flammable gas and the amount flammable and inert gas in air are 0.797 and 94.23%, respectively; the AEDC analytical tool predicts the mole ratio of inert to flammable gas and the amount flammable and inert gas in air are 0.798 and 94.22%, respectively. These results are in very good agreement with each other. As can be seen from Figure 13, the gas mixture inside the test facility is predicted to be too fuel rich. This is expected since the test operation requires the gas mixture to be too fuel rich to burn.
38
Now that the predictions of the gas properties and the flammability limits of gas during prefire test operations have been presented, the predictions from the postfire test operations can be presented. For the postfire test conditions, there are two test phases that are defined. These test phases are:
Table 6. Comparison of Mole Fractions of the Gas inside the J-6 Test Facility at T-0
Compound Python’s Prediction of Mole Fraction % AEDCs Analytical Tool’s Prediction of Mole Fraction % Difference Ar 0.1% 0.1% 0.0% CO2 0.0% 0.0% 0.0% N2 55.2% 55.8% 1.075% O2 2.0% 2.0% 0.0% H2O 42.8% 42.2% 1.4%
Table 7. Comparison of Mole Fractions of the Dry Gas inside the J-6 Test Facility at T-0
Compound Python’s Prediction of Mole Fraction % AEDCs Analytical Tool’s Prediction of Mole Fraction % Difference Ar 0.2% 0.2% 0.0% CO2 0.0% 0.0% 0.0% N2 96.4% 96.4% 0.0% O2 3.4% 3.4% 0.0%
Postfire: the time during test operations immediately after the rocket motor has completed its firing
Postfire Inerting: the time during test operations after the nitrogen flow has been initiated
39
The parameters that can be defined for the postfire predictions include the time per test phase, nitrogen flow rates, cooling water flowrates and the gas temperature. Table 6 compares the conditions inside the J-6 Test Facility from the Python program with AEDC’s analytical method.
Figure 13. Flammability Limits of the Gas inside the J-6 Test Facility at Postfire
As indicated in Table 8, the results of the predictions of the conditions of the J-6 test facility during postfire test operations are in good agreement. The largest difference that occurs is in the pressure inside the J-6 test facility which is 0.051%.
40
Tables 9 – 10 compare the predictions of the mole fractions of the gas inside the J-6 test facility from the Python program to AEDC’s analytical tool. As expected, the results show that the nitrogen gas makes up the largest amount (78.7%) of the gas mixture inside the test facility. This is as expected since a large amount of nitrogen gas is needed to make the gas nonflammable because of presence of hydrogen and carbon dioxide. With the digits rounded to the nearest tenth decimal point, all of the differences between the predicted mole fractions for the non-dry and dry gas during post fire test operations are 0.0%.
Figure 14 shows the results of the flammability limits of the exhaust gas during postfire test operations. With the results rounded to nearest tenth, the inert to flammable mole ratio and flammable and inert gas in air percentage disagree by 0.0% and 0.3%, respectively. The
differences between Figures 13 and 14 show the effects of adding nitrogen to the J-6 test facility, which was shown in Figure 2 of Chapter 1. As nitrogen gas is added to the test facility, the mole ratio of inert to flammable gas is increased, and thus the point moves to the right.
Table 8. Gas Properties Predictions Comparison for the Postfire Operation Test Phase
Parameter Python Program
Predictions AEDC Analysis Predictions Difference Gas Volume 4,150,984.7 ft3 4,150,942 ft3 1.029 x 10⁻³ % Height of Water 15.74 ft 15.74 ft 0.0 %
Water Saturation Pressure 0.363 psia 0.363 psia 0.0 %
41
Table 9. Comparison of Mole Fractions of the Gas inside the J-6 Test Facility at Postfire Inerting
Compound Python’s Prediction of Mole Fraction % AEDCs Analytical Tool’s Prediction of Mole Fraction % Difference Ar 0.0% 0.0% 0.0% CO2 0.6% 0.6% 0.0% N2 78.7% 78.7% 0.0% O2 0.7% 0.7% 0.0% CO 7.5% 7.5% 0.0% H2 8.8% 8.8% 0.0% H2O 3.8% 3.8% 0.0%
Table 10. Comparison of Mole Fractions of the Dry Gas inside the J-6 Test Facility at Postfire Inerting
Compound Python’s Prediction of Mole Fraction % AEDCs Analytical Tool’s Prediction of Mole Fraction % Difference Ar 0.0% 0.0% 0.0% CO2 0.6% 0.6% 0.0% N2 81.8% 81.84% 0.0% O2 0.7% 0.7% 0.0% CO 7.8% 7.8% 0.0% H2 9.1% 9.1% 0.0%
42
43
Chapter 5
Conclusions and Further Work
5.1
Conclusions
The Python program that was developed for analyzing the gas properties and the flammability limits of the gas inside the J-6 test facility proved to be a valid and useful tool based on comparisons with AEDC’s validated analytical tool. Comparisons were made between the predicted gas properties, which included the gas pressure, gas volume, height of water inside the J-6 Dehumidification Chamber, and the water vapor saturation pressure, for a fictional solid rocket motor. These predictions were made for T-0 test phase and the postfire inerting test phase. The maximum difference of 1.4% was between the predicted water vapor mole fraction at T-0. While actual test data or rocket motors cannot be used to validate this Python program for this thesis because of public release concerns, AEDC’s analytical tool has been accepted as a validated analytical tool for these calculations. Thus, all results should be acceptable for
engineering purposes.
This program was developed using Test Driven Development and Object Oriented Programming. All program modules that were written included a unit test that was validated anytime there were software changes. In addition, all the code was sufficiently commented with both code specifications and inline comments. TortoiseSVN25was used as a software
configuration management tool. With additional upgrades and validation, this software will be a very useful tool for analyzing the rocket exhaust gases inside the J-6 test facility.
44
5.2
Further Work
As mentioned in previous chapters, this software currently does not have all the desired capabilities that are needed for rocket motor testing analysis at AEDC. One such feature is the calculation of the test cell pressure during the rocket motor firing. This analysis requires the use of the Method of Characteristics (MOC) and 1D compressible isentropic equations. Future upgrades to this software will include this capability.
Another feature that is desirable for this software is the ability to automate the calculations of the test facility’s consumable schedules; the consumable schedules are the required amount of flow rates as a function of time for the steam, gaseous nitrogen, liquid nitrogen and cooling water. This feature will be included in future software upgrades.
Since much of AEDC’s test data and rocket motor manufacturers data is distribution limited, this thesis did not use this information to validate this program. However, future work in the non-public domain will include additional validation using both real test data and rocket motors. This will help to ensure that the Python program represents physical reality.
The software is expected to be maintained periodically throughout its life. All changes will be documented using both written reports and TortoiseSVN25. Detailed user guides will also be written for using the software.
45
Bibliography
46
1. Sutton G. P., Biblarz, O., Rocket Propulsion Elements, 8th ed., John Wiley & Sons, Inc., 2010.
2. Robbins, Scott, et. al., Hydrogen Gas Safety, Los Alamos National Laboratory, August 2000.
3. Pratt, T. H., “Electrostatic Ignitions of Fires and Explosions”, Center for Chemical Process Safety of the American Institute of Chemical Engineers, pp. 44, 2000.
4. National Rocket Propulsion Testing Alliance, http://rockettest.nasa.gov/nrpta/teststandcapabilities.asp
5. Ryan, J. E., “An Overview of Follow-On Testing Activities of the A-3 Subscale Diffuser Test Project”, 45th AIAA/SAE/ASME/ASEE Joint Propulsion Conference, Denver, CO, August 2009, AIAA 2009-5009.
6. Taylor, D. and Toline, F. R., “Summary of Exhaust Gas Ejector-Diffuser Research”, Arnold Engineering Development Center, October 1968, AEDC-TR-68-84.
7. Jones, G. W, “Inflammability of Mixed Gases”, Bureau of Mines, Tech. Paper 450, 1929, pp. 38.
8. Hiers, R. S., Pruitt, D. W., and Smith L., “Efficiencies Gained from Converting to a “Too Inert to Burn” Facility Inerting Technique in the J-6 Large Rocket Altitude Test Facility”,
Arnold Engineering Development Center, Arnold AFB, TN.
9. Powell, F. W., The Bureau of Mines: Its History, Activities, and Organization, New York: D. Appleton and Company, 1922.
47
10. Gordon, S. and McBride, B. J., “Computer Program for Calculation of Complex
Chemical Equilibrium Compositions, Rocket Performance, Incident and Reflected Shocks, and Chapman-Jouguet Detonations”, NASA Lewis Research Center, March 1976.
11. Munson, B. R., Young, D. F., and Okiishi, T. H., Fundamentals of Fluid Mechanics, 5th ed., John Wiley & Sons, Inc., Danvers, MA, 2006.
12. Mackenzie, F.T. and J.A. Mackenzie (1995), “Our changing planet”, Prentice-Hall, Upper Saddle River, NJ, pp. 288 - 307.
13. Keenan, Joseph H. and Keyes, Frederick G., "Thermodynamic Properties of Steam", John Wiley & Sons, Inc., New York, 1936.
14. Cohen, N., “Flammability and Explosion Limits of H2 and H2/CO: A Literature Review”, Aerospace Corporation, El Segundo, CA, September 1992
15. Gas Data Book, 7th ed., Matheson Gas Products, 2001.
16. Zabetakis, M. G., “Flammability Characteristics of Combustible Gases and Vapors”, U.S. Bureau of Mines Bulletin 627, 1924.
17. Le Chatelier, H., and O. Boudouard, “Limits of Flammability of Gaseous Mixtures”, Bull., Soc. Chim. (Paris), V. 19, 1898, pp. 483 – 488
18. Coward, H. F., Carpenter, C. W., and Payman, W., “The Dilution Limits of
Inflammability of Gaseous Mixtures. III. The Lower Flammability Limits of Some Mixed Inflammable Gases with Air. IV. The Upper Limits of Some Gases, Singly and Mixed, in Air”, Journal of Chemistry, Vol. 115, 1919, pp. 27 – 36.
48
19. “Limits for the Propagation of Flame in Vapour-Air Mixtures II. – Mixtures of More than One Vapor and Air at Ordinary Temperature and Pressure”, Journal of Chemistry, Vol. 121, 1922, pp. 2561 – 2577.
20. Lindström, B.; Karlsson, J.A.J.; Ekdunge, P.; De Verdier, L.; Häggendal, B.; Dawody, J.; Nilsson, M.; Pettersson, L.J. (2009). "Diesel fuel reformer for automotive fuel cell applications". International Journal of Hydrogen Energy 34 (8): 3367. doi:10.1016/j.ijhydene.2009.02.013 21. Python Software Foundation, [https://www.python.org/doc/essays/blurb/. Accessed 03/03/2015]
22. Fulgham, B., Gouy, I., “Which programs are fastest?”, Computational Speed Reference [http://benchmarksgame.alioth.debian.org/u64/which-programs-are-fastest.html. Accessed: 03/03/2015]
23. Guttag, J. V., “Introduction to Computation and Programming Using Python”, Massachusetts Institute of Technology, 2013.
24. Beck, K., “Test Driven Development: By Example”, 2003.
25. The TortoiseSVN Team, “About TortoiseSVN”, [http://tortoisesvn.net/about.html. Accessed 03/03/2015].
26. Riverbank Computing Limited, “PyQt 4.11.3 Reference Guide”, [http://pyqt.sourceforge.net/Docs/PyQt4/index.html#. Accessed 03/03/2015]
49
Vita
Richard Scott Kirkpatrick was born in Benton, Illinois and was raised in Mulkeytown, Illinois. He enrolled at Mississippi State University in 2005 for a Bachelor’s of Science in Aerospace Engineering and graduated in 2010. After being awarded his Bachelor’s degree, he accepted a job offer at Arnold Engineering Development Complex as a Test Engineer and Test Manager for the J-6 Solid Rocket High Altitude Test Facility. While employed at Arnold
Engineering Development Complex, Richard pursued a Master’s of Science degree in Aerospace Engineering at University of Tennessee Space Institute. During his free time, Richard enjoys spending time with his wife, Sarah Kirkpatrick, playing guitar, photography, martial arts, playing chess, computer programming and tinkering with electronics.
![Figure 1. Arnold Engineering Development Complex's J-6 Rocket Test Facility [4]](https://thumb-us.123doks.com/thumbv2/123dok_us/9612949.2839907/16.918.183.741.525.943/figure-arnold-engineering-development-complex-rocket-test-facility.webp)
![Figure 2. Flammability Limits of Hydrogen and Nitrogen Mixed with Air [7]](https://thumb-us.123doks.com/thumbv2/123dok_us/9612949.2839907/19.918.138.788.310.758/figure-flammability-limits-hydrogen-nitrogen-mixed-air.webp)
![Table 1. Dry Air Composition at 14.7 psia and 60 °F [12]](https://thumb-us.123doks.com/thumbv2/123dok_us/9612949.2839907/26.918.103.790.723.1008/table-dry-air-composition-psia-f.webp)
![Figure 4. Flammability Limits in Air [7]](https://thumb-us.123doks.com/thumbv2/123dok_us/9612949.2839907/31.918.137.787.231.700/figure-flammability-limits-in-air.webp)
![Table 3. Composition of Natural Gas with Lower Flammability Limits [7]](https://thumb-us.123doks.com/thumbv2/123dok_us/9612949.2839907/33.918.221.698.522.734/table-composition-natural-gas-lower-flammability-limits.webp)