© Global Society of Scientific Research and Researchers http://ijcjournal.org/
Comparing the Performance of Machine Learning
Algorithms for Human Activities Recognition using
WISDM Dataset
Ya Min
a*, Yin Yin Htay
b, Khin Khin Oo
ca,bUniversity of Computer Studies, Lashio, Myanmar c
University of Computer Studies, Magway, Myanmar
a
Email: yamin1977lso @gmail.com
b
Email: [email protected]
c
Email: [email protected]
Abstract
Human activity recognition is an important area of machine learning research as it has much utilization in different areas such as sports training, security, entertainment, ambient-assisted living, and health monitoring and management. Studying human activity recognition shows that researchers are interested mostly in the daily activities of the human. Mobile phones are used to be more than luxury products, it has become a kind of urgent need for a fast-moving world with rapid development. Nowadays mobile phone is well equipped with advanced processor, more memory, powerful battery and built-in sensors. This provides an opportunity to open up new areas of data mining for activity recognition of human’s daily living. In this paper, we tested experiment using Tree based Classifiers (Decision Tree, J48, JRIP, and Random Forest) and Rule based algorithms Classifiers (Naive Bayes and AD1) to classify six activities of daily life by using Weka tool. According to the tested results Random Forest classifier is more accurate than other classifiers.
Keywords: Human activity recognition; machine learning; data mining; tree based classifier; rule based classifier; accuracy.
1.Introduction
Human Activity recognition (HAR) is the root of many applications, such as those which deal with personal biometric signature, advanced computing, health and fitness monitoring, and elder-care, etc [2, 7].
--- * Corresponding author.
The input of HAR models is the reading of the raw sensor data and the output is the prediction of the user's motion activities. The HAR system becomes an emerging discipline in the area of pervasive computing in the intelligent computing applications [3]. According to the World Health Organization (WHO), the number of diabetic patients among the world population drastically increases from time to time (WHO, 2016). In the world, the first time it is happening that the proportion of older persons (60 years or older) increases in the proportion of young (below 15). For the first time in history, the number of older persons in the world will exceed the number of young by year 2050. Such ageing population need care. Activity recognition is a significant research area can provide a solution to such problem. This area has many applications in healthcare, elder care, user interfaces, smart environments, and security. Image and video based human activity recognition has been studied since a long time but they have limitation of mostly require infrastructure support, for example, the installation of video cameras in the monitoring areas. There are alternative approaches are available such as a body worn sensors or a smart phone which have built-in sensors to recognize the human activity of daily living. But a normal human can't wear so many sensors on the body excluding a patient. Nowadays Smart phones become the heart of the human world. Smartphone shows its presence in a large and the rapidly growing world's market. In fact, it was observed that since the fourth quarter of 2010 smart phone sales have surpasses those of PCs and it is continuously increasing in Fig 1[15]. Today's smartphone is well equipped with powerful sensors and long lasting battery with small in size provides an opportunity for data mining research and applications in human activity recognition using mobile phones. Some existing works have explored human activity recognition using data from accelerometer sensors. Many researches received very good accuracy by using tri-axial accelerometer for activity recognition the daily [1].
Figure 1: the number of smartphone users worldwide from 2014 to 2020 (in billions) [15]
Since the last decade, many researchers are employed in recognizing an activity of daily living [5]. But still there has been a slight practical effort has been done in the area of applications by using mobile devices. Because of the direct sensor readings used in HAR, this system is efficient for medical health care, military purposes, etc. some possible application domains by using human activity recognition are shown in the Table 1
Table 1: A Possible Application domain by using HAR [4]
In this paper, we have focused on using machine learning classifier algorithms on data from the built-in sensors of smartphone to recognize the activities of daily life of users are performing while carrying it in a pocket to evaluate the accuracy of the different classifiers.
2.Sensor Approaches
There are two types of sensors to recognize the human activities; using external or wearable sensors. In the past, the sensors were settled in predetermined points of interest, therefore the detecting of activities is essentially based on the interaction of the users with the sensors [3]. One of the examples of external sensors applications is the intelligent home, which has a capability to identify the complicated activities, eating, taking a shower, washing dishes, etc., because they depend on data that is collected from various sensors which are placed in specific objects. Those objects are supported by peoples’ interaction with them (e.g., stove, faucet, washing machine, etc.). However, there is no useful response if the user is out of the sensor area or the activities of the user do not need to interact with those objects. Moreover, the composition and servicing of sensors require high costs. Also, some of the extensive researches have been focused on the recognition of activities and gestures from video sequences [8, 9]. This is most appropriate for security and interactive applications. Microsoft developed the Kinect game console that let the user interact with the game using the gestures without any controller devices. However, there are some issues in video sequences of HAR such as [3]:
• The privacy, as no one wants to be always monitored and recorded by cameras.
• The pervasiveness, it is difficult to attach the video recording devices to the target of individuals in order to collect the images of their entire body during daily living activities.
• Video processing techniques are comparatively costly and consuming time.
The above-mentioned limitations motivate to use a wearable sensor in HAR. Where the measured attributes almost depend on the following: environmental variables (such as temperature and humidity), movement of the user (such as using GPS or accelerometers), or physiological signals (such as heart rate or electrocardiogram). These data are indexed over the time dimension. Accelerometer sensors sense the acceleration event from mobile phone, WII remote or wearable sensors. The raw data stream from the accelerometer is the acceleration
of each axis in the units of g-force. The raw data is represented in a set of 3D space vectors of acceleration. A time stamp can also be returned together with the three axes readings. Most of the existing accelerometers provide a user interface to configure the sampling frequency so that the user have to choose the best sampling rate which match his needs. There are many causes that encourage developing new techniques for enhancing the accuracy under more factual conditions. However, the first works on HAR date back to the late 90’s [10].
3.Challenges Face HAR System Designers
Any HAR system design relies on the activities to be recognized. The activities kinds and complexity are able to affect the quality of the recognition. Some of challenges which face researches are (1) how to select the attributes to be measured, (2) how constructing the system with portable, unobtrusive, and inexpensive data acquisition, (3) how extracting the features and designing the inference methods, (4) how collecting the data in the real environment, (5) how recognizing activities of the new users without the need of re-training the system, and (6) how can be implemented in the mobile devices which meeting energy and processing limitations [11].
4.Offline versus Online HAR Systems
The recognition of human activity could be done using offline or online techniques. Whenever online processing is not necessary for the application, the offline processing can always be used. For example, if the tracking of person’s daily routine is the goal such as in, the data was collected during the day by using the sensors and then it could be uploaded to a server at the end of the day. The data can be processed offline for classification purposes only [11]. However, some of the applications such as fitness coach where the user applies the given program which contains on a set of activities with sequence and duration. It is widely required to identify what the user is currently doing; therefore it requires using online technique [12]. Another application can be the recruitment for participatory sensing applications. For instance, the application aimed to collect the information from users during walking in a specific location in the city. Thus, online recognition of activities becomes significant. Some researches on human activities, which work on offline recognition, are using machine learning tools such as WEKA [13]. Nowadays, some of clouding systems are being used for online recognition [14].
5.Data Collection
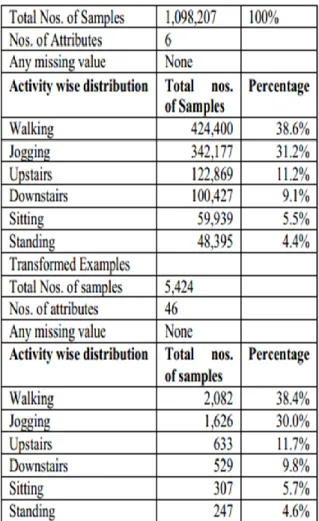
In this paper, we have uses a standard HAR dataset which is publicly available from the WISDM group. Android smartphone based application was used to collect data. Each user was asked to take the smartphone in a front leg pocket and performed five different activities in supervised condition which were walking, jogging, walking upstairs, walking downstairs, sitting, and standing. While performing these activities, the sampling rate for accelerometer sensor was kept of 20Hz. WISDM HAR dataset consists the accelerometer's raw time series data and detail descriptions are shown in the Table 2 [16].
Table 2: WISDM Dataset Description
5.1. Face Detection
Before applying the classifier algorithm, it is necessary to transform the raw sensor's data. The raw accelerometer's signal consists of a value related each of the three axes. To accomplish this J.R. Kwapisz and his colleagues [16] has segmented into 10-second data without overlapping. This is because he considered that 10seconds data consist of sufficient recreations that consist of 200 readings. Then they have generated features that were based each segment data of 200 raw accelerometer readings. A total 43 features are generated. All these are variants are based on six extraction methods. Average, Standard Deviation, Average Absolute Difference and Time between Peaks for each axis are extracted. Apart from these Average Resultant Acceleration and Binned Distribution is also extracted.
5.2. Classification
In this paper for classification of human activity of daily living, we have used the classifiers available in the Weka tool. In this paper, we have presented the performance comparison for different classifiers such as Decision Tree, J48, Random Forest, JRIP, Naive Bayes and AD1 algorithms.
5.3. Performance Measure
During this experimentation following performance measures has been used. The Overall accuracy is used to summarize the overall classification performance for all classes. It is defined as follows:
• Overall accuracy=TP/ (TP+FP+FN+TN) • Precision=TP/ (TP+FP)
• Recall=TP/ (TP+FN) • Specificity=TN/ (TN+FP)
• F-Measure = (2 * Precision * Recall) / (Precision + Recall)
• MCC = TP * TN – FP * FN / √ ((TP +FP) * (TP + FN) * (TN + FP) * (TN + FN))
6.Experimental Results
The experiments are performed by the following steps.
• Acquisition of standard WISDM HAR Dataset for Human Activity Recognition through a mobile device which is available in public domain.
• Partitioning dataset into training, testing and cross validation by using 10-fold cross-validation. • Examination of each classification model on 10-fold cross validation.
• Comparative analysis on the basis of performance measures such as, classification accuracy, TP rate, FP rate, minimum
• RMSE, F-measure, precision, recall and ROC.
• We used experiment environment from weka in determining mean and standard deviation performance of a classification algorithm on a WISDM dataset.
• We choose decision tree classifiers, experiment type has been chosen as 10-fold cross-validation in which WISDM dataset is divided into 10 parts (folds) and compare their results with meta classifier Adaptive Boosting. The confidence kept at 0.05.
Finally, we used Weka experimenter to evaluate the performance of the classifiers mentioned in an earlier section on standard WISDM dataset. Each classifier is trained and tested using 10-fold cross validation with 10 times' repetition.
6.1. Face Detection
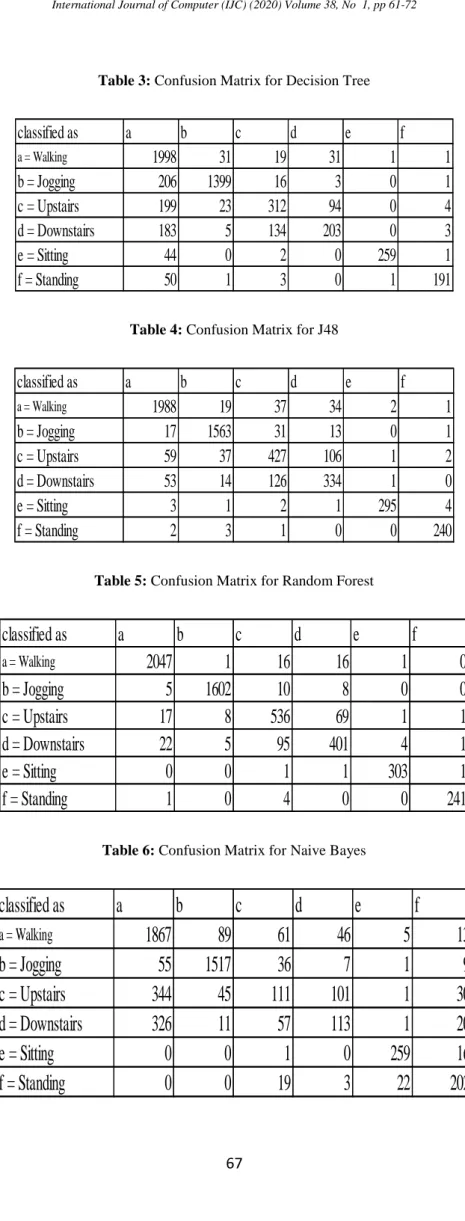
The Confusion Matrix for Decision Tree, J48, Random Forest, JRIP, Naive Bayes and AD1 are shown in the Table 3 to Table 8.
Table 3: Confusion Matrix for Decision Tree
Table 4: Confusion Matrix for J48
Table 5: Confusion Matrix for Random Forest
Table 6: Confusion Matrix for Naive Bayes
classified as
a
b
c
d
e
f
a = Walking1998
31
19
31
1
1
b = Jogging
206
1399
16
3
0
1
c = Upstairs
199
23
312
94
0
4
d = Downstairs
183
5
134
203
0
3
e = Sitting
44
0
2
0
259
1
f = Standing
50
1
3
0
1
191
classified as
a
b
c
d
e
f
a = Walking1988
19
37
34
2
1
b = Jogging
17
1563
31
13
0
1
c = Upstairs
59
37
427
106
1
2
d = Downstairs
53
14
126
334
1
0
e = Sitting
3
1
2
1
295
4
f = Standing
2
3
1
0
0
240
classified as
a
b
c
d
e
f
a = Walking
2047
1
16
16
1
0
b = Jogging
5
1602
10
8
0
0
c = Upstairs
17
8
536
69
1
1
d = Downstairs
22
5
95
401
4
1
e = Sitting
0
0
1
1
303
1
f = Standing
1
0
4
0
0
241
classified as
a
b
c
d
e
f
a = Walking
1867
89
61
46
5
13
b = Jogging
55
1517
36
7
1
9
c = Upstairs
344
45
111
101
1
30
d = Downstairs
326
11
57
113
1
20
e = Sitting
0
0
1
0
259
16
f = Standing
0
0
19
3
22
202
Table 7: Confusion Matrix for AD1
Table 9: Confusion Matrix for JRIP
According to the experiment, upstairs and downstairs are more confuse in Decision Tree, J48, JRIP, Naïve Bayes and AD1 classifiers. But, the Random Forest classifier, there is sitting is having more confusion with standing and walking in Table 5.
6.2. Face Detection
The performance criteria for classifiers are as shown in Table 9 to Table 14.
Table 10: Performance Criteria for Decision Tree
classified as
a
b
c
d
e
f
a = Walking
2020
3
23
35
0
0
b = Jogging
6
1591
14
14
0
0
c = Upstairs
63
16
416
136
1
0
d = Downstairs
82
7
84
355
0
0
e = Sitting
0
1
3
0
296
6
f = Standing
2
0
2
9
0
233
classified as
a
b
c
d
e
f
a = Walking
1956
16
60
44
2
3
b = Jogging
26
1570
21
7
1
0
c = Upstairs
155
20
336
115
4
2
d = Downstairs
147
14
86
281
0
0
e = Sitting
1
0
2
8
286
9
f = Standing
2
0
3
3
9
229
Class
TP RateFP RatePrecisionRecall F-MeasureMCC ROC Area PRC Area
Walking
0.96 0.204 0.746
0.96
0.839 0.735
0.963
0.927
Jogging
0.861 0.016 0.959 0.861
0.907 0.873
0.981
0.963
Upstairs
0.494 0.036 0.642 0.494
0.558 0.514
0.9
0.61
Downstairs
0.384 0.026 0.613 0.384
0.473 0.444
0.889
0.522
Table 11: Performance Criteria for J48
Table 12: Performance Criteria for Random Forest
Table 13: Performance Criteria for Naïve Bayes
Table 14: Performance Criteria for AD1
Class
TP RateFP Rate PrecisionRecall F-MeasureMCC
ROC Area PRC Area
Walking
0.955
0.04
0.937
0.955
0.946
0.912
0.972
0.951
Jogging
0.962
0.02
0.955
0.962
0.958
0.94
0.98
0.948
Upstairs
0.676
0.041
0.684
0.676
0.68
0.638
0.86
0.609
Downstairs
0.633
0.031
0.684
0.633
0.657
0.623
0.868
0.58
Sitting
0.964
0.001
0.987
0.964
0.975
0.974
0.985
0.965
Standing
0.976
0.002
0.968
0.976
0.972
0.97
0.99
0.971
Weighted Avg.
0.895
0.029
0.892
0.895
0.893
0.866
0.953
0.876
Class
TP RateFP Rate PrecisionRecall F-MeasureMCC
ROC Area PRC Area
Walking
0.984
0.013
0.978
0.984
0.981
0.969
0.998
0.998
Jogging
0.986
0.004
0.991
0.986
0.989
0.984
1
0.999
Upstairs
0.848
0.026
0.81
0.848
0.828
0.805
0.988
0.919
Downstairs
0.759
0.019
0.81
0.759
0.784
0.762
0.986
0.897
Sitting
0.99
0.001
0.981
0.99
0.985
0.984
1
0.999
Standing
0.98
0.001
0.988
0.98
0.984
0.983
1
0.997
Weighted Avg.
0.947
0.011
0.947
0.947
0.947
0.936
0.996
0.979
Class
TP RateFP Rate PrecisionRecall F-MeasureMCC
ROC Area PRC Area
Walking
0.897
0.217
0.72
0.897
0.799
0.662
0.912
0.856
Jogging
0.934
0.038
0.913
0.934
0.923
0.89
0.978
0.969
Upstairs
0.176
0.036
0.389
0.176
0.242
0.2
0.824
0.0335
Downstairs
0.214
0.032
0.419
0.214
0.283
0.248
0.807
0.323
Sitting
0.944
0.006
0.906
0.944
0.925
0.92
0.998
0.972
Standing
0.821
0.017
0.697
0.821
0.754
0.744
0.988
0.646
Weighted Avg.
0.757
0.103
0.719
0.757
0.726
0.654
0.92
0.774
Class
TP RateFP Rate PrecisionRecall F-MeasureMCC ROC Area PRC Area
Walking
0.971 0.046
0.93 0.971
0.95 0.918
0.994
0.992
Jogging
0.979 0.007 0.983 0.979
0.981 0.973
0.999
0.998
Upstairs
0.658 0.026 0.768 0.658
0.709 0.676
0.969
0.811
Downstairs
0.672
0.04 0.647 0.672
0.659 0.622
0.961
0.677
Sitting
0.967
0 0.997 0.967
0.982 0.981
1
0.998
Standing
0.947 0.001 0.975 0.947
0.961 0.959
1
0.993
Weighted Avg.
0.906 0.027 0.905 0.906
0.905 0.883
0.99
0.943
Table 15: Performance Criteria for JRIP
It also observed from the Table 10 to Table 14 clearly that the performance of random forest is much better than the other classifier in terms of various performance measures. It has been observed from the above table 10 to table 14 and that the detailed performance for each class in the case of Random Forest Classifier is in terms of TP rate, FP rate, precision, recall f-measure, MCC, ROC and PRC, it better than all other classifiers.
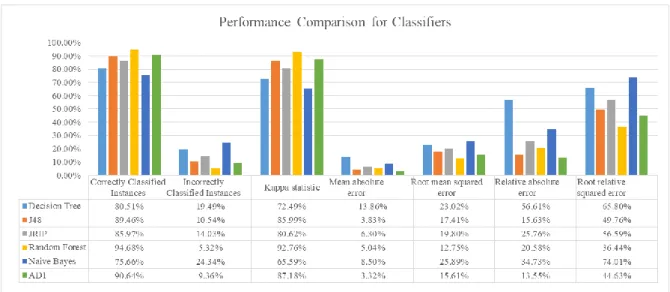
Figure 2: performance comparison for classifiers
While observing the Fig 2 it shows that the performance measure like Cohen's kappa statistic is 0.9276 (92.76%) which indicate random forest is able to classify activities as it is nearer to 1. Mean Absolute Error (MAE) which is average of absolute error which is nearer to zero. But it is not minimum among all classifiers. Root Mean Square Error, which is the good measure of accuracy of classifier is less among all classifiers. Similarly, root relative squared error is also lees among all classifiers. Coverage cases for random forest classifier is best among all.
Class
TP RateFP Rate PrecisionRecall F-MeasureMCC ROC Area PRC Area
Walking
0.94 0.099 0.855
0.94
0.896 0.828
0.944
0.866
Jogging
0.966 0.013 0.969 0.966
0.968 0.954
0.9856
0.978
Upstairs
0.532 0.036 0.661 0.532
0.589 0.546
0.876
0.576
Downstairs
0.532 0.036 0.614 0.532
0.57 0.529
0.858
0.529
Sitting
0.935 0.003 0.947 0.935
0.941 0.937
0.976
0.934
Standing
0.931 0.003 0.942 0.931
0.937 0.934
0.97
0.911
Weighted Avg.
0.86
0.05 0.852
0.86
0.854 0.815
0.943
0.839
7.Conclusion
This paper is presented our experimental work of various classifiers on the WISDM dataset. The performance of the classifiers is compared in above section. We illustrated that while keeping smartphone in pocket, it is very easy to recognize activity of daily alive with the help of built-in sensors. We further demonstrated that by using a suitable classifier, recognition rate can improve in most of the activities. We found recognition rate for each activity is more than 75%. According to experiments, the accuracy of Random Forest is 94.68%. So Random Forest classifier is better accuracy than other classifiers in Human Activities Recognition (HAR) System.
Acknowledgements
The authors thank teachers who give knowledge about how to read papers and write papers.
References
[1]. Khan, Adil Mehmood and Lee, Young-Koo and Lee, Sungyoung Y and Kim, Tae-Seong [2010] A triaxial accelerometer-based physical-activity recognition via augmented-signal features and a hierarchical recognizer, Information Technology in Biomedicine, IEEE Transactions;14:5–1166. [2]. Zhao, K.; Du, J.; Li, C.; Zhang, C.; Liu, H.; Xu, C. Healthy: A Diary System Based on Activity
Recognition Using Smartphone. In Proceeedings of the 2013 IEEE 10th International Conference on Mobile Ad-Hoc and Sensor Systems (MASS), Hangzhou, China, 14–16 October 2013; pp. 290–294. [3]. Oscar. D. Lara and M. A. Labrador, "A Survey on Human Activity Recognition using Wearable
Sensors," in IEEE Communications Surveys & Tutorials, vol. 15, no. 3, pp. 1192-1209, Third Quarter 2013.
[4]. J. W. Lockhart, T. Pulickal, and G. M. Weiss, “Applications of mobile activity recognition,” in Proceedings of the 2012 ACM Conference on Ubiquitous Computing - UbiComp ’12, 2012, p. 1054. [5]. S. Gallagher, “Smartphone Sensor Data Mining for Gait Abnormality Detection,” Fordham University,
New York, 2014.
[6]. T. van Kasteren, G. Englebienne, and B. Krse, “An activity monitoring system for elderly care using generative and discriminative models,” J. Personal and Ubiquitous Computing, 2010.
[7]. Slim S.O., Atia A., Mostafa MS.M. (2016) An Experimental Comparison Between Seven Classification Algorithms for Activity Recognition. In The 1st International Conference on Advanced Intelligent System and Informatics (AISI2015), November 28-30, 2015, Beni Suef, Egypt. Advances in Intelligent Systems and Computing, vol 407. Springer, Cham.
[8]. P. Turaga, R. Chellappa, V. Subrahmanian, and O. Udrea, “Machine recognition of human activities: A survey,” IEEE Trans. Circuits Syst.Video Technol., vol. 18, no. 11, pp. 1473–1488, 2008.
[9]. J. Candamo, M. Shreve, D. Goldgof, D. Sapper, and R. Kasturi, “Understanding transit scenes: A survey on human behavior-recognition algorithms,” IEEE Trans. Intell. Transp. Syst., vol. 11, no. 1, pp. 206– 224, 2010.
[10]. M. Ahad, J. Tan, H. Kim, and S. Ishikawa, “Human activity recognition: Various paradigms,” in International Conference on Control, Automation and Systems, pp. 1896–1901, 2008.
[11]. E. Kim, S. Helal, and D. Cook, “Human activity recognition and pattern discovery,” IEEE Pervasive Computing, vol. 9, no. 1, pp. 48–53, 2010.
[12]. Jun Yang. 2009. Toward physical activity diary: motion recognition using simple acceleration features with mobile phones. In Proceedings of the 1st international workshop on Interactive multimedia for consumer electronics (IMCE '09). ACM, New York, NY, USA, 1-10.
[13]. Shoaib, M.; Bosch, S.; Incel, O.D.; Scholten, H.; Havinga, P.J. "Fusion of smartphone motion sensors for physical activity recognition". Sensors 2014, 14, 10146–10176.
[14]. N P. Kumari, M. López-Benítez, G. M. Lee, T. S. Kim and A. S. Minhas, "Wearable Internet of Things from human activity tracking to clinical integration," 2017 39th Annual International Conference of the IEEE Engineering in Medicine and Biology Society (EMBC), Seogwipo, 2017, pp. 2361-2364.
[15]. http://www.statista.com/statistics/330695/number-ofsmartphone-users-worldwide/
[16]. J. R. Kwapisz, G. M. Weiss, and S. a. Moore, “Activity recognition using cell phone accelerometers,” ACM SIGKDD Explor. Newsl., vol. 12, no. 2, p. 74, 2011
![Figure 1: the number of smartphone users worldwide from 2014 to 2020 (in billions) [15]](https://thumb-us.123doks.com/thumbv2/123dok_us/9731144.2854656/2.892.268.625.647.902/figure-number-smartphone-users-worldwide-billions.webp)
![Table 1: A Possible Application domain by using HAR [4]](https://thumb-us.123doks.com/thumbv2/123dok_us/9731144.2854656/3.892.283.595.151.389/table-a-possible-application-domain-by-using-har.webp)