University of Pennsylvania
ScholarlyCommons
Statistics Papers Wharton Faculty Research
2011
Adaptive Thresholding for Sparse Covariance
Matrix Estimation
T. Tony Cai
University of Pennsylvania
Weidong Liu
University of Pennsylvania
Follow this and additional works at:http://repository.upenn.edu/statistics_papers
Part of theStatistics and Probability Commons
This paper is posted at ScholarlyCommons.http://repository.upenn.edu/statistics_papers/499
For more information, please [email protected]. Recommended Citation
Cai, T., & Liu, W. (2011). Adaptive Thresholding for Sparse Covariance Matrix Estimation.Journal of the American Statistical Association, 106(494), 672-684.http://dx.doi.org/10.1198/jasa.2011.tm10560
Adaptive Thresholding for Sparse Covariance Matrix Estimation
AbstractIn this article we consider estimation of sparse covariance matrices and propose a thresholding procedure that is adaptive to the variability of individual entries. The estimators are fully data-driven and demonstrate excellent performance both theoretically and numerically. It is shown that the estimators adaptively achieve the optimal rate of convergence over a large class of sparse covariance matrices under the spectral norm. In contrast, the commonly used universal thresholding estimators are shown to be suboptimal over the same parameter spaces. Support recovery is discussed as well. The adaptive thresholding estimators are easy to implement. The numerical performance of the estimators is studied using both simulated and real data. Simulation results demonstrate that the adaptive thresholding estimators uniformly outperform the universal thresholding estimators. The method is also illustrated in an analysis on a dataset from a small round blue-cell tumor microarray experiment. A supplement to this article presenting additional technical proofs is available online.
Keywords
Frobenius norm, optimal rate of convergence, spectral norm, support recovery, universal thresholding
Disciplines
Adaptive Thresholding for Sparse Covariance Matrix
Estimation
Tony Cai
1and Weidong Liu
1,2Abstract
In this paper we consider estimation of sparse covariance matrices and propose a thresholding procedure which is adaptive to the variability of individual entries. The estimators are fully data driven and enjoy excellent performance both theoretically and numerically. It is shown that the estimators adaptively achieve the optimal rate of convergence over a large class of sparse covariance matrices under the spectral norm. In contrast, the commonly used universal thresholding estimators are shown to be sub-optimal over the same parameter spaces. Support recovery is also discussed. The adaptive thresholding estimators are easy to implement. Numerical performance of the estimators is studied using both simulated and real data. Simulation results show that the adaptive thresholding estimators uniformly outperform the universal thresholding estimators. The method is also illustrated in an analysis on a dataset from a small round blue-cell tumors microarray experiment. A supplement to this paper which contains additional technical proofs is available online.
Keywords: Adaptive thresholding, Frobenius norm, optimal rate of convergence, sparse
covariance matrix, spectral norm, support recovery, universal thresholding.
1Department of Statistics, The Wharton School, University of Pennsylvania, Philadelphia, PA
19104, [email protected]. The research was supported in part by NSF FRG Grant DMS-0854973.
1
Introduction
Let X = (X1, . . . , Xp) be a p-variate random vector with covariance matrix Σ0. Given
an independent and identically distributed (i.i.d.) random sample {X1, . . . ,Xn} from the
distribution of X, we wish to estimate the covariance matrix Σ0 under the spectral norm.
This covariance matrix estimation problem is of fundamental importance in multivariate analysis with a wide range of applications. The high dimensional setting, where the di-mension p can be much larger than the sample size n, is of particular current interest. In such a setting, conventional methods and results based on fixed p and large n are no longer applicable and new methods and theories are thus needed. In particular, the sample covariance matrix Σn= (ˆσij)p×p := 1 n−1 n X k=1 (Xk−X¯)(Xk−X¯)T, (1) where ¯X = n−1Pn
k=1Xk, performs poorly in this setting and structural assumptions are
required in order to estimate the covariance matrix consistently.
In this paper we focus on estimating sparse covariance matrices. This problem has been considered in the literature. El Karoui (2008) and Bickel and Levina (2008) proposed thresholding of the sample covariance matrixΣn and obtained rates of convergence for the
thresholding estimators. Rothman, Levina and Zhu (2009) considered thresholding of the sample covariance matrix with more general thresholding functions. Cai and Zhou (2009 and 2010) established the minimax rates of convergence under the matrix ℓ1 norm and the
spectral norm. Wang and Zou (2010) considered estimation of volatility matrices based on high-frequency financial data.
A common feature of the thresholding methods for sparse covariance matrix estimation proposed in the literature so far is that they all belong to the class of “universal thresholding rules”. That is, a single threshold level is used to threshold all the entries of the sample covariance matrix. Universal thresholding rules were originally introduced by Donoho and
Johnstone (1994 and 1998) for estimating sparse normal mean vectors in the context of wavelet function estimation. See also Antoniadis and Fan (2001). An important feature of problems considered there is that noise is homoscedastic. In such a setting, universal thresholding has demonstrated considerable success in nonparametric function estimation in terms of asymptotic optimality and computational simplicity.
In contrast to the standard homoscedastic nonparametric regression problems, sparse covariance matrix estimation is intrinsically a heteroscedastic problem in the sense that the entries of the sample covariance matrix could have a wide range of variability. Although some universal thresholding rules have been shown to enjoy desirable asymptotic proper-ties, this is mainly due to the fact that the parameter space considered in the literature is relatively restrictive which forces the covariance matrix estimation problem to be an essentially homoscedastic problem.
To illustrate the point, it is helpful to consider an idealized model where one observes
yi =µi+γizi, zi iid
∼ N(0,1) 1≤i≤p (2)
and wishes to estimate the mean vectorµwhich is assumed to be sparse. If the noise levels
γi are bounded, say by B, then the universal thresholding rule ˆµi = yiI(|yi| ≥B√2 logp)
performs well asymptotically over a standard ℓq ball Θq(s0) defined by
Θq(s0) ={µ∈IRp :
p
X
j=1
|µj|q≤s0}. (3)
In particular, Θ0(s0) is a set of sparse vectors with at most s0 nonzero elements. Here the
assumption that γi are bounded by B is crucial. The universal thresholding rule simply
treats the heteroscedastic problem (2) as a homoscedastic one with all noise levels γi =B.
It is intuitively clear that this method does not perform well when the range of γi is large
and it fails completely without the uniform boundedness assumption on the γi’s.
matri-ces was considered in Bickel and Levina (2008) and Rothman, Levina and Zhu (2009): Uq :=Uq(s0(p)) = n Σ:Σ≻0, max i σii ≤K, maxi p X j=1 |σij|q ≤s0(p) o
for some 0≤q <1, where Σ≻0 means thatΣ is positive definite. Here each column of a covariance matrix in Uq(s0(p)) is assumed to be in theℓq ball Θq(s0(p)). Define
θij :=Var((Xi−µi)(Xj −µj)), (4)
where µi = EXi. It is easy to see that in the Gaussian case, σiiσjj ≤ θij ≤ 2σiiσjj.
The condition maxiσii ≤ K for all i ensures the variances of the entries of the sample
covariance matrix to be uniformly bounded. Bickel and Levina (2008) proposed a universal thresholding estimator ˆΣu = (ˆσiju), where
ˆ
σiju = ˆσijI{σˆij ≥λn}, (5)
and showed that with a proper choice of the threshold λn the estimator ˆΣu achieves a
desirable rate of convergence under the spectral norm. Rothman, Levina and Zhu (2009) considered a class of universal thresholding rules with more general thresholding functions than hard thresholding. Similar to the idealized model (2) discussed earlier, here a key assumption is that the variances σii are uniformly bounded by K which is crucial to make
the universal thresholding rules well behaved. A universal thresholding rule in this case essentially treats the problem as if all σii=K when selects the threshold λ.
For heteroscedastic problems such as sparse covariance matrix estimation, it is arguable more desirable to use thresholds that capture the variability of individual variables instead of using a universal upper bound. This is particularly true when the variances vary over a wide range or no obvious upper bound on the variances is known. A more natural and effective approach is to use thresholding rules with entry-dependent thresholds which automatically adapt to the variability of the individual entries of the sample covariance
matrix. The main goal of the present paper is to develop such an adaptive thresholding estimator and study its properties.
In this paper we introduce an adaptive thresholding estimator ˆΣ⋆ = (ˆσ⋆
ij)p×p with
ˆ
σ⋆ij =sλij(ˆσij), (6)
where sλ(z) is a general thresholding function similar to those used in Rothman, Levina
and Zhu (2009) and will be specified later. The individual thresholds λij are fully
data-driven and adapt to the variability of individual entries of the sample covariance matrix
Σn. It is shown that the adaptive thresholding estimator ˆΣ ⋆
enjoys excellent properties both asymptotically and numerically. In particular, we consider the performance of the estimator ˆΣ⋆ over a large class of sparse covariance matrices defined by
Uq⋆ :=Uq⋆(s0(p)) = n Σ:Σ≻0, max i p X j=1 (σiiσjj)(1−q)/2|σij|q ≤s0(p) o (7) for 0 ≤ q < 1. In comparison to Uq(s0(p)), the columns of a covariance matrix in Uq⋆
are required to be in a weighted ℓq ball, instead of a standard ℓq ball, with the weight
determined by the variance of the entries of the sample covariance matrix. A particular feature of U⋆
q is that it no longer requires the variances σii to be uniformly bounded and
allows maxiσii → ∞. Note that Uq(s0(p)) ⊆ Uq⋆(K1−qs0(p)), so the parameter space Uq⋆
contains the uniformity class Uq as a subset. The parameter space Uq⋆ can also be viewed
as a weighted ℓq ball of correlation coefficients. See Section 3.1 for more discussions.
It will be shown in Section 3 that ˆΣ⋆ achieves the optimal rate of convergence
s0(p)
logp n
(1−q)/2
over the parameter space U⋆
q(s0(p)). In comparison, it is also shown that the best universal
thresholding estimator can only attain the rate s20−q(p) lognp(1−q)/2
over U⋆
q(s0(p)), which
The choice of the regularization parameters is important in any regularized estimation problem. The thresholds λij used in (6) are based on an estimator of the variance of the
entries ˆσij of the sample covariance matrix. More specifically, λij are of the form
λij =δ
s
ˆ
θijlogp
n (8)
where ˆθij are estimates of θij defined in (4) and δ is a tuning parameter. The value of δ
can be taken as fixed at δ = 2, or it can be empirically chosen through cross validation. Theoretical properties of the resulting covariance matrix estimators using both methods are investigated. It is shown that the estimators attain the optimal rate of convergence under the spectral norm in both cases. In addition, support recovery of a sparse covariance matrix is also considered.
The adaptive thresholding estimators are easy to implement. Numerical performance of the estimators is investigated using both simulated and real data. Simulation results show that the adaptive thresholding estimators perform favorably in comparison to existing methods. In particular, they uniformly outperform the universal thresholding estimators in the simulation studies. The procedure is also applied to analyze a dataset from a small round blue-cell tumors microarray experiment (Khan et al., 2001).
The paper is organized as follows. Section 2 introduces the adaptive thresholding proce-dure for sparse covariance matrix estimation. Asymptotic properties are studied in Section 3. It is shown that the adaptive thresholding estimator is rate-optimal over U⋆
q, while
the best universal thresholding estimator is proved to be suboptimal. Section 4 discusses data-driven selection of the thresholds using cross validation and establish asymptotic op-timality of the resulting estimator. Numerical performance of the adaptive thresholding estimators is investigated by simulations and by an application to a dataset from a small round blue-cell tumors microarray experiment in Section 5. Section 6 discusses methods based on the sample correlation matrix. The proofs are given in Section 7.
2
Adaptive thresholding for sparse covariance matrix
In this section we introduce the adaptive thresholding method for estimating sparse co-variance matrices. To motivate our estimator, consider again the sparse normal mean estimation problem (2). If the noise levels γi’s are known or can be well estimated, a goodestimator of the mean vector is the hard thresholding estimator ˆµi =yiI{|yi| ≥γi√2 logp}
or some generalized thresholding estimator with the same thresholds γi√2 logp.
Similarly, for sparse covariance matrix estimation, a more effective thresholding rule than universal thresholding is the one which adapts to the variability of the individual entries of the sample covariance matrix. Define θij as in (4). Then, roughly speaking,
estimation of a sparse covariance matrix is similar to the mean vector estimation problem based on the observations
1 n n X k=1 (Xki−µi)(Xkj −µj) =σij + r θij n zij, 1≤i, j ≤p (9)
with zij being asymptotically standard normal. This analogy provides a good motivation
for our adaptive thresholding procedure. If the θij were known, a natural thresholding
estimator would be (ˆσo ij)p×p with ˆ σo ij =sλo ij(ˆσij) with λ o ij = 2 r θijlogp n , (10)
where sλ(z) is a thresholding function. Comparing to the universal thresholding rule in
Bickel and Levina (2008), the variance factors θij in the thresholds make the thresholding
rule entry-dependent and leads to a more flexible estimator. In practice, θij are typically
unknown, but can be well estimated. We propose the following estimator of θij:
ˆ θij = 1 n n X k=1 h (Xki−X¯i)(Xkj−X¯j)−σˆij i2 , X¯i =n−1 n X k=1 Xki.
This leads to our adaptive thresholding estimator of the covariance matrix Σ0,
ˆ
where λij :=λij(δ) =δ s ˆ θijlogp n . (12)
Hereδ >0 is a regularization parameter. It can be fixed atδ= 2 or can be chosen through cross validation. Good choices of δ will not affect the rate of convergence, but will affect the numerical performance of the resulting estimators. Selection of δ is thus of practical importance and we will discuss it further later.
The analogy between the sparse covariance estimation problem and the idealized mean estimation problem (9) gives a good motivation for the adaptive thresholding estimator defined in (11) and (12), but of course the matrix estimation problem is not exactly equiv-alent to the mean estimation problem (9) as noise is not exactly normal or iid and the loss is the spectral norm, not a vector norm or the Frobenius norm. We shall make our technical analysis precise in Sections 3 and 7.
In the present paper, we consider simultaneously a class of thresholding functionssλ(z)
that satisfy the following conditions:
(i). |sλ(z)| ≤c|y| for all z, y satisfy |z−y| ≤λ and some c >0;
(ii). sλ(z) = 0 for |z| ≤λ;
(iii). |sλ(z)−z| ≤λ, for all z ∈IR.
These three conditions are satisfied, for example, by the soft thresholding rule sλ(z) =
sgn(z)(z −λ)+ and the adaptive lasso rule sλ(z) = z(1− |λ/z|η)+ with η ≥ 1, as called
in Rothman, Levina and Zhu (2009). We shall present a unified analysis of the adaptive thresholding estimators with the thresholding function sλ(z) satisfying the above three
conditions. It should be noted that Condition (i) excludes the hard thresholding rule. However, all of the theoretical results in this paper hold for the hard thresholding estimator
under similar conditions. Here Condition (i) is in place only to make the technical analysis in Section 7 work in a unified way for the class of thresholding rules. The results for the hard thresholding rule require slightly different proofs.
Rothman, Levina and Zhu (2009) proposed generalized universal thresholding estima-tors
ˆ
Σg = (ˆσgij)p×p, where ˆσijg = ¯sλn(ˆσij)
and ¯sλ(z) satisfies (ii), (iii) and |s¯λ(z)| ≤ |z|, which is slightly weaker than (i). Similar
general universal thresholding rules were introduced and studied by Antoniadis and Fan (2001) in the context of wavelet function estimation. We should note that the generalized universal thresholding estimators ˆΣg suffer the same shortcomings as those of ˆΣu, and like
ˆ
Σu they are sub-optimal over the class Uq⋆.
3
Theoretical properties of adaptive thresholding
We now consider the asymptotic properties of the adaptive thresholding estimator ˆΣ⋆(δ) defined in (11) and (12). It is shown that the estimator ˆΣ⋆(δ) adaptively attains the optimal rate of convergence over the collection of parameter spaces U⋆q(s0(p)).
We begin with some notation. Define the standardized variables
Yi = (Xi−µi)/(Var(Xi))1/2,
where µi =EXi, and let Y= (Y1, . . . , Yp).Throughout the paper, denote |a|2=
q Pp
j=1a2j
for the usual Euclidean norm of a vector a= (a1, . . . , ap)T ∈IRp. For a matrixA= (aij)∈
IRp×q, define the spectral norm kAk
2 = sup|x|2≤1|Ax|2, the matrix ℓ1 norm kAkL1 =
max1≤j≤qPpi=1|ai,j|, and the Frobenius norm kAkF =
q P
i,ja2ij. For two sequences of
real numbers {an} and {bn}, write an = O(bn) if there exists a constant C such that
3.1
Rate of convergence
It is conventional in the covariance matrix estimation literature to divide the technical analysis into two cases according the the moment conditions on X.
(C1). (Exponential-type tails)Suppose that logp=o(n1/3) and there exists some
η >0 such that
EexptY2
i
≤K1 <∞ for all |t| ≤η and i. (13)
Furthermore, we assume that for some τ0 >0,
min
ij
Var(YiYj)≥τ0. (14)
(C2). (Polynomial-type tails) Suppose that for some γ, c1 > 0, p ≤ c1nγ, and for
some ǫ >0
E|Yi|4γ+4+ǫ ≤K1 for all i. (15) Furthermore, we assume that (14) holds.
Remark 1 Note that (C1) holds with τ0 = 1 in the Gaussian case where X ∼N(µ,Σ0).
To this end, letρij be the correlation coefficient ofYiandYj. We can then writeYi =ρijYj+
q
1−ρ2
ijY, where Y ∼N(0,1) is independent of Yj. So we have Var(YiYj) = 1 +ρ2ij ≥1.
Hence (14) holds with τ0 = 1.
The follow theorem gives the rate of convergence over the parameter space U⋆
q under
the spectral norm for the thresholding estimator ˆΣ⋆(δ).
Theorem 1 Let δ≥2 and 0≤q <1.
(i). Under (C1), we have, for some constant CK1,δ,c,q depending only on δ, c, q and K1,
inf Σ0∈Uq⋆ PkΣˆ⋆(δ)−Σ0k2 ≤CK 1,δ,c,qs0(p) logp n 1−q 2 ≥1−O((logp)−12p−δ+2). (16)
(ii). Under (C2), (16) holds with probability greater than 1−O((logp)−1/2p−δ+2+n−ǫ/8).
Although U⋆
q is larger than the uniformity class Uq, the rates of convergence of ˆΣ ⋆
(δ) over the two classes are of the same order s0(p)(logp/n)(1−q)/2.
Theorem 1 states the rate of convergence in terms of probability. The same rate of convergence holds in expectation with some additional mild assumptions. By (16) and some long but elementary calculations (see also the proof of Lemma 4), we have the following result on the mean squared spectral norm.
Proposition 1 Under (C1) andp≥nξfor someξ > 0, we have forδ≥7+ξ−1,0≤q <1,
and some constant C > 0,
sup Σ0∈Uq⋆ EkΣˆ⋆(δ)−Σ0k2 2 ≤Cs20(p) logp n 1−q . (17)
Remark 2 Cai and Zhou (2010) established the minimax rates of convergence under the
spectral norm for sparse covariance matrix estimation over Uq. It was shown that the
optimal rate over Uq iss0(p)(logp/n)(1−q)/2. SinceUq(s0(p))⊆ Uq⋆(K1−qs0(p)), this implies
immediately that the convergence rate attained by the adaptive thresholding estimator over U⋆
q in Theorem 1 and (17) is optimal.
Remark 3 The estimator ˆΣ⋆(δ) yields immediately an estimate of the correlation matrix
R0 = (rij)1≤i,j,≤p which is the object of direct interest in some statistical applications.
Denote the corresponding estimator of R0 by ˆR
⋆ (δ) = (ˆr⋆ ij)1≤i,j,≤p with ˆr⋆ij = ˆσ⋆ij/ p ˆ σiiσˆjj.
A parameter space for the correlation matrices is the following ℓq ball:
R⋆q :=R⋆q(s0(p)) = n R:R≻0, max i p X j=1 |rij|q≤s0(p) o . (18)
Then Theorem 1 holds for estimating the correlation matrix R0 by replacing ˆΣ
⋆ (δ), Σ0 and U⋆ q with ˆR ⋆ (δ),R0 and R⋆q, respectively.
Note that the covariance matrix Σ0 can be written as Σ0 =D1/2R0D1/2, where D=
diag(Σ0). The covariance matrix can thus be viewed as a weighted version of the correlation
matrix with weights {(σiiσjj)1/2}. Correspondingly, the parameter space Uq⋆ in (7) can be
viewed as the weighted version of R⋆
q given in (18) with the same weights,
Uq⋆ := n Σ:Σ≻0, max i p X j=1 (σiiσjj)1/2|rij|q ≤s0(p) o .
3.2
Support recovery
A closely related problem to estimating a sparse covariance matrix under spectral norm is the recovery of the support of the covariance matrix. This problem has been considered, for example, in Rothman, Levina and Zhu (2009). For support recovery, it is natural to consider the parameter space
¯ U0 := ¯U0(s0(p)) = n Σ: max i p X j=1 I{σij 6= 0} ≤s0(p) o ,
which assumes that the covariance matrix has at most s0(p) nonzero entries on each row.
Define the support of Σ0 = (σij0) by Ψ = {(i, j) : σ0ij 6= 0}. The following theorem
shows that the adaptive thresholding estimator ˆΣ⋆(δ) recovers the support Ψ exactly with high probability when the magnitudes of nonzero entries are above certain threshold.
Theorem 2 Suppose that Σ0 ∈U¯0. Let δ≥2 and
|σ0ij|>(2 +δ+γ)
r
θijlogp
n for all (i, j)∈Ψ and some γ >0. (19)
If either (C1) or (C2) holds, then we have inf
Σ0∈U¯0
Psupp( ˆΣ⋆(δ)) = supp(Σ0)→1.
Similar support recovery result was established for the generalized universal thresholding estimator in Rothman, Levina and Zhu (2009) under the condition maxiσii0 ≤Kand a lower
Following Rothman, Levina and Zhu (2009), the ability to recover the support can be evaluated via the true positive rate (TPR) in combination with the false positive rate (FPR), defined respectively as T P R= #{(i, j) : ˆσ ⋆ ij 6= 0 and σij 6= 0} #{(i, j) :σij 6= 0} and F P R= #{(i, j) : ˆσ ⋆ ij 6= 0 and σij = 0} #{(i, j) :σij = 0} .
It follows from Theorem 2 directly that P(F P R= 0)→1 andP(T P R= 1) →1 under the conditions of the theorem.
The next result shows thatδ= 2 is the optimal choice for support recovery in the sense that a thresholding estimator with any smaller choice ofδwould fail to recover the support of Σ0 exactly with probability going to one. We assume Xsatisfies the following condition
which is weaker than the Gaussian assumption.
(C3) Suppose that E[(Xi−µi)2(Xj−µj)(Xk−µk)] = 0, E[(Xi−µi)(Xj −µj)(Xk−µk)(Xl−µl)] = 0 if σ0 j1j2 = 0 for allj1 6=j2 ∈ {i, j, k, l}. Theorem 3 Letλij =τ q ˆ θijlogp
n with 0< τ <2. Suppose that (C1) or (C2) holds. Under
(C3) and p= exp(o(n1/5)), if s
0(p) =O(p1−τ1) with some τ2/4< τ1 <1 and p→ ∞, then
inf Σ0∈U¯0
Psupp( ˆΣ⋆(τ))6= supp(Σ0)→1.
Remark 4 The condition p = exp(o(n1/5)) is used in the proof to make sure the
covari-ances of the samples {Xn}can be well approximated by normal vectors. It can be replaced
by p= exp(o(n1/3)) if X is a multivariate normal population.
3.3
Comparison with universal thresholding
It is interesting to compare the asymptotic results for adaptive thresholding estimator ˆΣ⋆(δ) with the known results for universal thresholding estimators. We begin by comparing the
rate of convergence of ˆΣ⋆(δ) with that of the universal thresholding estimator ˆΣuintroduced
in Bickel and Levina (2008) in the case of polynomial-type tails. Suppose that (C2) holds. Bickel and Levina (2008) showed that
kΣˆu−Σ0k2 =OP s0(p) p1/(1+γ+ǫ/2) n1/2 1−q (20) forΣ0 ∈ Uq. Clearly, the convergence rate given in Theorem 1 for the adaptive thresholding
estimator is significantly faster than that in (20). We next compare the rates over the class U⋆
q, 0 ≤ q < 1. For brevity, we shall focus
on the Gaussian case X ∼N(µ,Σ0). The following theorem gives the lower bound of the
universal thresholding estimator.
Theorem 4 Assume thatn5q ≤p≤exp(o(n1/3))and8≤s
0(p)<min{p1/4,4(n/logp)1/2}. We have, as p→ ∞, inf λn sup Σ0∈Uq⋆ PkΣˆg−Σ0k2 > 3 64s 2−q 0 (p) logp n (1−q)/2 →1 (21)
and hence for large n,
inf λn sup Σ0∈Uq⋆ EkΣˆg−Σ0k2 2 ≥ 1 512s 4−2q 0 (p) logp n 1−q . (22)
The rate in (21) is slower than the optimal rates0(p)(logp/n)(1−q)/2 given in (16) when
s0(p)→ ∞asp→ ∞. Therefore no universal thresholding estimators can be minimax-rate
optimal under the spectral norm over U⋆
q if s0(p)→ ∞.
If we assume the mean of X is zero and ignore the term ¯X in Σn, then the universal
thresholding estimators given in Bickel and Levina (2008) and Rothman, Levina and Zhu (2009) use the sample mean of the samples {XkiXkj; 1≤k≤n}to identify zero entries in
the covariance matrix. The support of these estimators depends on the quantitiesI{|σˆij| ≥
λn}. In the high dimensional setting, the sample mean is usually unstable for non-Gaussian
applications such as in finance and genomics. For our estimator, instead of the sample mean, we use the Student t statistic ˆσij/θˆ1ij/2 to distinguish zero and nonzero entries. Our
support recovery depends on the quantities I{|σˆij|/θˆ1ij/2 ≥ 2
p
logp/n} which are more stable than I{|ˆσij| ≥ λn}, since t statistic is much more stable than the sample mean; see
Shao (1999) for the theoretical justification.
4
Data-driven choice of
δ
Section 3 analyzes the properties of the adaptive thresholding estimator with a fixed value of δ. Alternatively, δ can be selected empirically through cross validation (CV). In Bickel and Levina (2008) the value of the universal thresholding level λn is not fully specified
and the CV method was used to select λn empirically. They obtained the convergence
rate under the Frobenius norm for an estimator that is based only on partial samples. Theoretical analysis on the rate of convergence under the spectral norm is still lacking. In this section, we first briefly describe the CV method for choosing δ and then derive the theoretical properties of the resulting estimator under the spectral norm.
Divide the sample {Xk; 1 ≤ k ≤ n} into two subsamples at random. Let n1 and
n2 =n−n1 be the two sample sizes for the random split satisfying n1 ≍n2 ≍n, and let
ˆ
Σv1, ˆΣv2 be the two sample covariance matrices from the vth split, for v = 1, . . . , H, where
H is a fixed integer. Let ˆΣ⋆v1 (δ) and ˆΣ⋆v2 (δ) be defined as in (11) from the vth split and ˆ R(δ) = 1 H H X v=1 kΣˆ⋆v1 (δ)−Σˆv2k2F.
Let aj =j/N, 0≤j ≤4N be 4N + 1 points in [0,4] and take
ˆ
δ = ˆj/N, where ˆj = arg min
0≤j≤4N
ˆ
R(j/N),
whereN >0 is a fixed integer. If there are severalj attain the minimum value, ˆj is chosen to be the smallest one. The final estimator of the covariance matrix Σ0 is given by ˆΣ
⋆
Theorem 5 Suppose X∼N(µ,Σ0) with Σ0 ∈ U0 and miniσii0 ≥ τ0 for some τ0 >0. Let
s0(p) =O((logp)γ) for some γ <1 and nξ ≤p≤exp(o(n1/3))for some ξ > 0. We have
inf Σ0∈U0 PkΣˆ⋆(ˆδ)−Σ0k2 ≤Cs0(p)logp n 1/2 →1.
Remark 5 The assumption that N is fixed is not a stringent condition since we only
considerδbelonging to the fixed interval [0,4]. Moreover, we will only focus on the matrices in U0 due to the complexity of the proof. Extending to the case N → ∞with certain rate
and more general Σ0 is possible. However, it requires far more complicated proof and will
not be discussed in the present paper.
Remark 6 The condition s0(p) = O((logp)γ) used in the theorem is purely for technical
reasons and we believe that it is not essentially needed and can be weakened. This condition is not stringent when p= exp(nα) and it becomes restrictive if p=O(nα).
Similar to the fixedδ case, we also consider support recovery with the estimator ˆΣ⋆(ˆδ).
Proposition 2 Suppose the conditions in Theorem 5 hold. For Σˆ⋆(ˆδ), we have
F P R=OP(s0(p)/p)→0.
Moreover, sinceδˆ≤4, we haveT P R= 1 with probability tending to one if the lower bound in (19) holds with 2 +δ being replaced by 6.
5
Numerical Results
The adaptive thresholding procedure presented in Section 2 is easy to implement. In this section, the numerical performance of the proposed adaptive thresholding estimator ˆΣ⋆(δ) is studied using Monte Carlo simulations. Both methods for choosing the regularization
parameter δ are considered and their performance are compared with that of universal thresholding estimators. The adaptive thresholding estimator is illustrated in an analysis on a dataset from a small round blue-cell tumors microarray experiment.
5.1
Simulation
The following two types of sparse covariance matrices are considered in the simulations to investigate the numerical properties of the adaptive thresholding estimator ˆΣ⋆(δ) .
• Model 1 (banded matrix with ordering). Σ0 = diag(A1,A2), whereA1 = (σij)1≤i,j≤p/2,
σij =
1−|i10−j|
+,A2 = 4Ip/2×p/2. Σ0 is a two-block diagonal matrix. A1 is a banded
and sparse covariance matrix. A2 is a diagonal matrix with 4 along the diagonal.
• Model 2 (sparse matrix without ordering). Σ0 = diag(A1,A2), whereA2 = 4Ip/2×p/2,
A1 =B+ǫIp/2×p/2,B = (bij)p/2×p/2with independentbij = unif(0.3,0.8)×Ber(1,0.2).
Here unif(0.3,0.8) is a random variable taking value uniformly in [0.3,0.8]; Ber(1,0.2) is a Bernoulli random variable which takes value 1 with probability 0.2 and 0 with probability 0.8; and ǫ= max(−λmin(B),0) + 0.01 to ensure that A1 is positive
defi-nite.
Under each model, n = 100 independent and identically distributed p-variate random vectors are generated from the normal distribution with mean 0 and covariance matrix Σ0,
for p= 30,100,200. In each setting, 100 replications are used. We compare the numerical performance between the adaptive thresholding estimators ˆΣ⋆(ˆδ) and ˆΣ⋆2 ≡ Σˆ⋆(2) and with the universal thresholding estimator ˆΣg of Rothman, Levina and Zhu (2009). Here
ˆ
δ is selected by five fold cross-validation in Section 4, ˆΣ⋆2 is the adaptive thresholding estimator with fixed δ = 2. The thresholding level λn in ˆΣg is selected by five fold
cross-validation method used in Bickel and Levina (2008). For each procedure, we consider two types of thresholding functions, the hard thresholding and the adaptive lasso thresholding
sλ(z) = x(1− |λ/x|η) with η = 4. The losses are measured by three matrix norms: the
spectral norm, the matrix ℓ1 norm and the Frobenius norm. We report in Tables 1 and 2
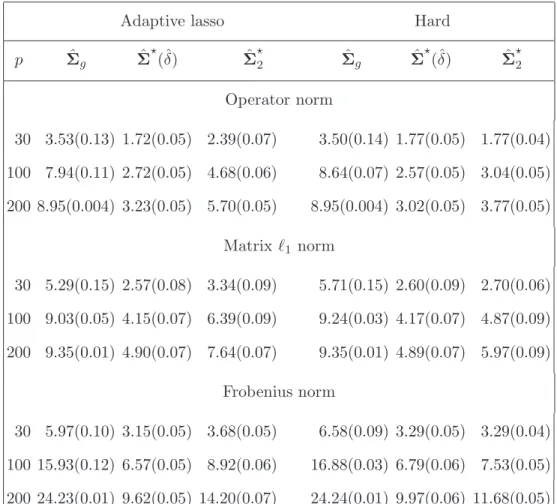
the means and standard errors of these losses. We also carried out simulations with the SCAD thresholding function for both universal thresholding and adaptive thresholding. The phenomenon is very similar. The SCAD adaptive thresholding also outperforms the SCAD universal thresholding. For reasons of space, the results are not reported here. Table 1: Comparison of average matrix losses for Model 1 over 100 replications. The standard errors are given in the parentheses.
Adaptive lasso Hard
p Σˆg Σˆ⋆(ˆδ) Σˆ⋆ 2 Σˆg Σˆ ⋆ (ˆδ) Σˆ⋆ 2 Operator norm 30 3.53(0.13) 1.72(0.05) 2.39(0.07) 3.50(0.14) 1.77(0.05) 1.77(0.04) 100 7.94(0.11) 2.72(0.05) 4.68(0.06) 8.64(0.07) 2.57(0.05) 3.04(0.05) 200 8.95(0.004) 3.23(0.05) 5.70(0.05) 8.95(0.004) 3.02(0.05) 3.77(0.05) Matrix ℓ1 norm 30 5.29(0.15) 2.57(0.08) 3.34(0.09) 5.71(0.15) 2.60(0.09) 2.70(0.06) 100 9.03(0.05) 4.15(0.07) 6.39(0.09) 9.24(0.03) 4.17(0.07) 4.87(0.09) 200 9.35(0.01) 4.90(0.07) 7.64(0.07) 9.35(0.01) 4.89(0.07) 5.97(0.09) Frobenius norm 30 5.97(0.10) 3.15(0.05) 3.68(0.05) 6.58(0.09) 3.29(0.05) 3.29(0.04) 100 15.93(0.12) 6.57(0.05) 8.92(0.06) 16.88(0.03) 6.79(0.06) 7.53(0.05) 200 24.23(0.01) 9.62(0.05) 14.20(0.07) 24.24(0.01) 9.97(0.06) 11.68(0.05)
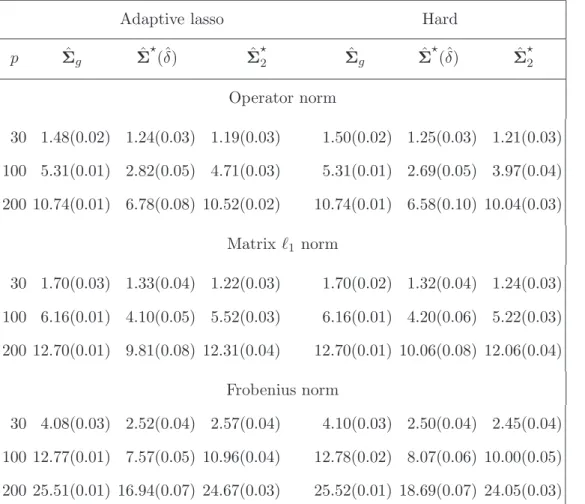
Table 2: Comparison of average matrix losses for Model 2 over 100 replications. The standard errors are given in the parentheses.
Adaptive lasso Hard
p Σˆg Σˆ⋆(ˆδ) Σˆ2⋆ Σˆg Σˆ⋆(ˆδ) Σˆ⋆2 Operator norm 30 1.48(0.02) 1.24(0.03) 1.19(0.03) 1.50(0.02) 1.25(0.03) 1.21(0.03) 100 5.31(0.01) 2.82(0.05) 4.71(0.03) 5.31(0.01) 2.69(0.05) 3.97(0.04) 200 10.74(0.01) 6.78(0.08) 10.52(0.02) 10.74(0.01) 6.58(0.10) 10.04(0.03) Matrix ℓ1 norm 30 1.70(0.03) 1.33(0.04) 1.22(0.03) 1.70(0.02) 1.32(0.04) 1.24(0.03) 100 6.16(0.01) 4.10(0.05) 5.52(0.03) 6.16(0.01) 4.20(0.06) 5.22(0.03) 200 12.70(0.01) 9.81(0.08) 12.31(0.04) 12.70(0.01) 10.06(0.08) 12.06(0.04) Frobenius norm 30 4.08(0.03) 2.52(0.04) 2.57(0.04) 4.10(0.03) 2.50(0.04) 2.45(0.04) 100 12.77(0.01) 7.57(0.05) 10.96(0.04) 12.78(0.02) 8.07(0.06) 10.00(0.05) 200 25.51(0.01) 16.94(0.07) 24.67(0.03) 25.52(0.01) 18.69(0.07) 24.05(0.03)
Under Model 1 and Model 2, both adaptive thresholding estimators ˆΣ⋆(ˆδ) and ˆΣ⋆2
uniformly outperform the universal thresholding rule ˆΣg significantly, regardless which
thresholding function or which loss function is used. Between ˆΣ⋆(ˆδ) and ˆΣ⋆2, ˆΣ⋆(ˆδ) performs better than ˆΣ⋆2 in general. Between the two thresholding functions, the hard thresholding rule outperforms the adaptive lasso thresholding rule for ˆΣ⋆2, while the difference is not significant for ˆΣ⋆(ˆδ). For both models, the behaviors of hard and adaptive lasso universal thresholding rules are very similar. They both tend to “over-threshold” and remove many nonzero off-diagonal entries of the covariance matrices.
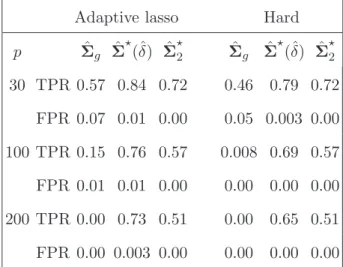
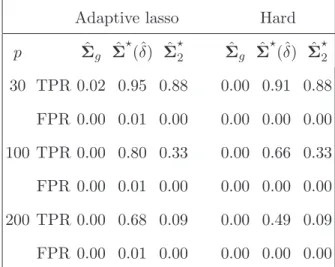
For support recovery, again both ˆΣ⋆(ˆδ) and ˆΣ⋆2 outperform ˆΣg. The values of TPR
and FPR based on the off-diagonal entries are reported in Tables 3 and 4. For Model 1, ˆ
Σg tends to estimate many nonzero off-diagonal entries by zero when p is large. To better
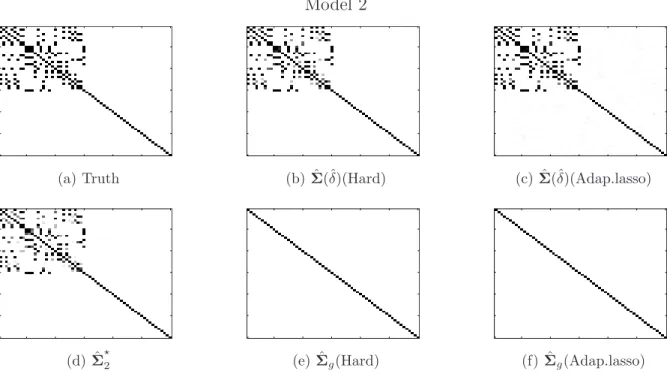
illustrate the recovery performance elementwise for the two models, the heat maps of the nonzeros identified out of 100 replications whenp= 60 are pictured in Figures 1 and 2. The heat maps suggest that the sparsity patterns recovered by ˆΣ⋆(ˆδ) and ˆΣ⋆2 have significantly better resemblance to the true model than ˆΣg.
Table 3: Comparison of support recovery for Model 1 over 100 replications.
Adaptive lasso Hard
p Σˆg Σˆ⋆(ˆδ) ˆΣ⋆ 2 Σˆg Σˆ ⋆ (ˆδ) ˆΣ⋆ 2 30 TPR 0.57 0.84 0.72 0.46 0.79 0.72 FPR 0.07 0.01 0.00 0.05 0.003 0.00 100 TPR 0.15 0.76 0.57 0.008 0.69 0.57 FPR 0.01 0.01 0.00 0.00 0.00 0.00 200 TPR 0.00 0.73 0.51 0.00 0.65 0.51 FPR 0.00 0.003 0.00 0.00 0.00 0.00
Table 4: Comparison of support recovery for Model 2 over 100 replications.
Adaptive lasso Hard
p Σˆg Σˆ⋆(ˆδ) ˆΣ⋆ 2 Σˆg Σˆ ⋆ (ˆδ) ˆΣ⋆ 2 30 TPR 0.02 0.95 0.88 0.00 0.91 0.88 FPR 0.00 0.01 0.00 0.00 0.00 0.00 100 TPR 0.00 0.80 0.33 0.00 0.66 0.33 FPR 0.00 0.01 0.00 0.00 0.00 0.00 200 TPR 0.00 0.68 0.09 0.00 0.49 0.09 FPR 0.00 0.01 0.00 0.00 0.00 0.00 Model 1 10 20 30 40 50 60 (a) Truth 10 20 30 40 50 60 (b) ˆΣ(ˆδ)(Hard) 10 20 30 40 50 60 (c) ˆΣ(ˆδ)(Adap.lasso) 10 20 30 40 50 60 (d) ˆΣ⋆ 2 10 20 30 40 50 60 (e) ˆΣg(Hard) 10 20 30 40 50 60 (f) ˆΣg(Adap.lasso)
Figure 1: Heat maps of the frequency of the zeros identified for each entry of the covariance matrix (when p= 60) out of 100 replications. White color is 100 zeros identified out of 100 runs, and black is 0/100.
Model 2 10 20 30 40 50 60 (a) Truth 10 20 30 40 50 60 (b) ˆΣ(ˆδ)(Hard) 10 20 30 40 50 60 (c) ˆΣ(ˆδ)(Adap.lasso) 10 20 30 40 50 60 (d) ˆΣ⋆ 2 10 20 30 40 50 60 (e) ˆΣg(Hard) 10 20 30 40 50 60 (f) ˆΣg(Adap.lasso)
Figure 2: Heat maps of the frequency of the zeros identified for each entry of the covariance matrix (when p= 60) out of 100 replications. White color is 100 zeros identified out of 100 runs, and black is 0/100.
5.2
Correlation analysis on real data
We now apply the adaptive thresholding estimator ˆΣ⋆(δ) to a dataset from a small round blue-cell tumors (SRBC) microarray experiment (Khan et al., 2001) and compare the ability of support recovery with that of the universal thresholding estimator ˆΣg. The estimator
ˆ
Σ⋆2 is not considered here since the simulation results in Section 5.1 show that ˆΣ⋆(ˆδ) outperforms ˆΣ⋆2 when the sample size is not large. The SRBC data set has been analyzed in Rothman, Levina and Zhu (2009) in which the universal thresholding rules were considered. To make the results comparable, we shall follow the same steps as those in Rothman, Levina and Zhu (2009).
The SRBC data has 63 training tissue samples, and 2308 gene expression values recorded for each sample. The original data has 6567 genes and was reduced to 2308 genes after an initial filtering; see Khan et al. (2001). The 63 tissue samples contain four types of tumors (23 EWS, 8 BL-NHL, 12 NB, and 20 RMS). As in Rothman, Levina and Zhu (2009), the genes were first ranked by the amount of discriminative information based on the F-statistic, F = 1 k−1 Pk m=1nm(¯xm−x¯)2 1 n−k Pk m=1(nm−1)ˆσm2 ,
where n = 63 is the sample size, k = 4 is the number of classes, nm, 1 ≤ m ≤ 4, are
the sample sizes of the four types of tumors, ¯xm and ˆσm are the sample mean and sample
variance of the class m, and ¯x is the overall sample mean. According to the F values, the top 40 and bottom 160 genes were chosen. The first 40 genes were also ordered according to the ordering given in Rothman, Levina and Zhu (2009). Based on the 200 genes, the performance of the two estimators ˆΣ⋆(ˆδ) and ˆΣg was considered. The tuning parameters
ˆ
δ and λn were selected by five fold cross validation. To this end, we need to divide the
63 samples into five groups of nearly equal sizes. As there are four types of tumors in the samples, we let the proportions of the four types of tumors in each group be nearly equal
so that each fold is a good representative of the whole. Three fold cross validation is also used in this way and the results are similar.
20 40 60 80 100 120 140 160 180 200
(a) ˆΣ(ˆδ) Hard (83.11% zeros)
20 40 60 80 100 120 140 160 180 200 (b) ˆΣ(ˆδ) AL (69.78% zeros) 20 40 60 80 100 120 140 160 180 200 (c) ˆΣg Hard (97.88% zeros) 20 40 60 80 100 120 140 160 180 200 (d) ˆΣg AL (97.88% zeros)
Figure 3: Heatmaps of the estimated supports.
Figure 3 plots the heat maps of ˆΣ⋆(ˆδ) with hard thresholding ( ˆΣ⋆(ˆδ) Hard), ˆΣg with
hard thresholding ( ˆΣg Hard), ˆΣ ⋆
(ˆδ) with adaptive lasso thresholding ( ˆΣ⋆(ˆδ) AL), ˆΣg with
adaptive lasso thresholding ( ˆΣg AL). ˆΣg AL and ˆΣg Hard result in very sparse estimators,
with 97.88% zero elements in off diagonal positions. The estimator ˆΣ⋆(ˆδ) AL is the least sparse one with 69.78% zeros, while ˆΣ⋆(ˆδ) Hard has 83.11% zeros. The ”over-threshold” phenomenon in the real data analysis is consistent with that observed in the simulations. The universal thresholding rule removes many nonzero off diagonal entries and results in an ”over-sparse” estimate, while adaptive thresholding with different individual levels results in a clean but more informative estimate of the sparsity structure.
6
Discussion
This paper introduces an adaptive entry-dependent thresholding procedure for estimating sparse covariance matrices. The proposed estimator ˆΣ⋆(δ) = (ˆσ⋆
ij) enjoys excellent
perfor-mance both theoretically and numerically. In particular, ˆΣ⋆(δ) attains the optimal rate of convergence over U⋆
q given in (7) while universal thresholding estimators are shown to be
sub-optimal. The main reason that universal thresholding does not perform well is that the sample covariances can have a wide range of variabilities. A simple and natural way to deal with the heteroscedasticity is to first estimate the correlation matrix R0 and then
renormalize by the sample variances to obtain an estimate of the covariance matrix. We shall discuss below two approaches based on this idea.
Denote the sample correlation matrix by ˆR= (ˆrij)1≤i,j≤p with ˆri,j = ˆσij/
p
ˆ
σiiσˆjj. An
estimate of the correlation matrix R0 can be obtained by thresholding ˆrij. Define the
universal thresholding estimator of the correlation matrix by ˆR(λn) = (ˆrijthr)p×p with
ˆ
rthrij = ˆrijI{|rˆij| ≥λn}
and the corresponding estimator of the covariance matrix by ˆΣR=D1n/2Rˆ(λn)D1n/2, where
Dn= diag(Σn). It is easy to see that a good choice of the thresholdλnisλn=C
p
(logp)/n
for some constant C > 0. It is however difficult to choose C because the choice depends on the unknown underlying distribution. Assuming the constant C is chosen sufficiently large, it can be shown that the resulting estimator ˆΣR attains the same minimax rate of
convergence. However, the estimator ˆΣR is less efficient than ˆΣ ⋆
(δ) for support recovery. In fact, ˆΣR is unable to recover the support of Σ0 exactly for a class of non-Gaussian
distributions of X. Denote by V(γ, δ, K1) the class of distributions F of X satisfying the
conditions of Theorem 2. Then it can be shown that for any γ > 0, δ ≥ 2 and some
K1 =K1(γ)>0, inf λn sup F∈V(γ,δ,K1) Psupp( ˆΣR)6= supp(Σ0)→1. (23)
The sample correlation coefficients ˆrij are not homoscedastic, although the range of
variabilities is smaller in comparison to that of sample covariances. This is in fact the main reason for the negative result on support recovery given in Equation (23). A natural approach to deal with the heteroscedasticity of the sample correlation coefficients is to first stabilize the variance by using Fisher’s z-transformation, then threshold and finally obtain the estimator by inverse transform. Applying Fisher’s z-transformation to each correlation coefficient yields ˆ Zij = 1 2ln 1 + ˆrij 1−rˆij .
When X is multivariate normal, it is well-known that ˆZij is asymptotically normal with
mean (1/2) ln((1 +rij)/(1−rij)) and variance 1/(n−3). The behavior of ˆZij in the
non-Gaussian case is more complicated. In general, the asymptotic variance of ˆZij depends on
EX2
iXj2 even whenrij = 0; see Hawkins (1989). Similar to the method of thresholding the
sample correlation coefficients discussed earlier, universally thresholding ( ˆZij)p×p is unable
to recover the support ofΣ0 exactly for a class of non-Gaussian distributions ofXsatisfying
the conditions in Theorem 2.
In conclusion, the two natural approaches based on the sample correlation matrix dis-cussed above are not as efficient as the entry-dependent thresholding method we proposed in Section 2. For reasons of space, we omit the proofs of the results stated in this section. We shall explore these issues in detail elsewhere.
7
Proofs
We begin by collecting a few technical lemmas which are essential for the proofs of the main results. The first lemma is an exponential inequality on the partial sums of independent random variables.
Lemma 1 Let ξ1,· · · , ξn be independent random variables with mean zero. Suppose that
there exists some t >0 and B¯n such that Pnk=1Eξk2et|ξk| ≤B¯n2. Then for 0< x≤B¯n,
P n X k=1 ξk ≥CtB¯nx ≤exp(−x2), (24) where Ct =t+t−1.
Proof of Lemma 1. By the inequality |es−1−s| ≤s2esmax(s,0), we have for any t≥ 0,
P n X k=1 ξk ≥CKB¯nx ≤ exp(−tCηB¯nx) n Y k=1 Eexp(tξk) ≤ exp(−tCηB¯nx) n Y k=1 (1 +t2Eξ2 ket|ξk|) ≤ exp−tCηB¯nx+ n X k=1 t2Eξ2 ket|ξk| .
Take t=η(x/B¯n). It follows that
P n X k=1 ξk ≥CηB¯nx ≤exp−ηCηx2+η2x2 = exp(−x2),
which completes the proof.
The second and third lemmas are on the asymptotic behaviors of the largest entry of the sample covariance matrix and ˆθij. The proof of Lemma 2 is given in Cai and Liu (2010).
Lemma 2 (i). Under (C1), we have for any δ≥2, ε >0 and M >0,
Pmax ij |ˆσij −σ 0 ij|/θˆ 1/2 ij ≥δ p logp/n=O(logp)−1/2p−δ+2, (25) Pmax ij {| ˆ θij −θij|} ≥εσii0σjj0 =O(p−M), (26) and Pmax i | ¯ Xi| ≥Cplogp/n=O(p−M) (27)
for some C > 0.
(ii). Under (C2), (25)-(27) still hold if we replace O(logp)−1/2p−δ+2 and O(p−M) with O(logp)−1/2p−δ+2+n−ǫ/8 and O(n−ǫ/8) respectively.
Lemma 3 Let X= (X1,· · · , Xp) be a mean zero random vector. Suppose that Cov(X) =
Ip×p, (C3) holds and p→ ∞. Then under (C1) or (C2), we have for any δ >0,
P max 1≤i<j≤p(nθij) −1 n X k=1 XkiXkj 2 ≥(4−δ) logp→1.
Proof of Lemma 3. We arrange the two dimensional indices {(i, j) : 1≤ i < j ≤ p} in
any ordering and set them as {(im, jm) : 1≤m≤p(p−1)/2 =:L}. Let
Ykm=θij−1/2XkimXkjm, Sm =n −1/2 n X k=1 Ykm, Am ={|Sm| ≥ p (4−δ) logp}, 1≤m ≤L. Define ¯Ykm = YkmI{|Ykm| ≤ δn p n/(logp)3} and ˆY km = ¯Ykm − EY¯km, where δn → 0
sufficiently slow. Then by (C1) or (C2) we have when n is large,
P max 1≤i<j≤p(nθij) −1 n X k=1 XkiXkj 2 ≥(4−δ) logp ≥P max 1≤m≤Ln −1 n X k=1 ˆ Ykm 2 ≥(4−2δ) logp−O(p−M +n−ǫ/8) ≥P max 1≤m≤Ln −1 n X k=1 ˆ Ykm 2
≥4 logp−log logp+x−O(p−M +n−ǫ/8). (28) for any M >0 and x <0. Set yn =√4 logp−log logp+x and
ˆ Am = n n−1/2 n X k=1 ˆ Ykm ≥yn o .
Then by Bonferroni’s inequality, we have for any fixed l,
P max 1≤m≤Ln −1 n X k=1 ˆ Ykm 2 ≥yn2≥ 2l X d=1 (−1)d−1 X 1≤i1<···<id≤L P d \ j=1 ˆ Aij . (29) Write ˆ Yk = ( ˆYki1,· · · ,Yˆkid), 1≤k ≤n.
By Theorem 1 in Zaitsev (1987), we have P|Nˆ|d,∞≥yn−δ1/2 n (logp)−1/2 +c1exp(−c2δn−1/2logp) ≥P n −1/2 n X k=1 ˆ Yk d,∞ ≥yn ≥P|Nˆ|d,∞≥yn+δ1/2 n (logp)−1/2 −c1exp(−c2δn−1/2logp), (30)
wherec1andc2are positive constant depending only ond,|·|d,∞means|a|d,∞ = min1≤i≤d|ai|
for a= (a1,· · · , ad), and ˆN is a d dimensional normal random vector with mean zero and
covariance matrix Cov( ˆYk). Set ˆ Bi±1,···,id = n |Nˆ|d,∞ ≥yn∓δn1/2(logp)−1/2 o .
We can check that kCov( ˆNk)−Id×dk2 =O(1/(logp)8). Let Zbe a standard d-dimensional
normal vector. Then we have PBˆ+ i1,···,id ≤ P|Z|d,∞≥yn−2δ1/2 n (logp)−1/2 +PkCov( ˆNk)−Id×dk2|Z|2 ≥δ1/2 n (logp)−1/2 = (1 +o(1))√1 2πp −2exp( −x/2)d+O(exp(−C(logp)2)). (31) Similarly we can get
PBˆ−
i1,···,id
≥(1−o(1))√1 2πp
−2exp(−x/2)d−O(exp(−C(logp)2)). (32)
Submitting (30)-(32) into (29), we can get lim n→∞ P max 1≤m≤Ln −1 n X k=1 ˆ Ykm 2 ≥y2n ≥ 2l X d=1 (−1)d−1√1 8πexp(−x/2) d /d! → 1−exp−√1 8π exp(−x/2) (33) as l→ ∞. Letting x→ −∞, we prove the lemma by (28) and (33).
Proof of Theorem 1. By (C1) or (C2), we have θij ≤ CK1σ
0
iiσ0jj. On the event
{maxij|σˆij − σij0| ≤ λij} ∩ {θˆij ≤ 2θij for all i, j}, we have by the conditions (i)-(iii)
on sλ(z) that p X j=1 |sλij(ˆσij)−σ 0 ij| = p X j=1 |sλij(ˆσij)−σ 0 ij|I{|σˆij| ≥λij}+ p X j=1 |σ0 ij|I{|σˆij|< λij} ≤2 p X j=1 λijI{|σij0| ≥λij}+ p X j=1 |sλij(ˆσij)−σ 0 ij|I{|σˆij| ≥λij,|σij0|< λij} + p X j=1 |σ0ij|I{|σij0|<2λij} ≤2 p X j=1 λ1ij−q|σ0ij|q+ (1 +c) p X j=1 |σij0|I{|σij0|< λij}+ p X j=1 |σij0|I{|σij0|<2λij} ≤Cq,c p X j=1 λ1ij−q|σij0|q ≤CK1,δ,c,qs0(p) logp n (1−q)/2 .
The proof follows from Lemma 2 and the fact kAk2 ≤ kAkL1 for any symmetric matrix.
Proof of Theorems 2 and 3. Theorem 2 follows from Lemma 2 immediately. We now
prove Theorem 3. For each 1 ≤ i ≤ p, let A1 be the largest subset of {1,· · · , p} such
that Xi is uncorrelated with {Xk, k ∈ A1}. Let i1 =argmin{|j −i| : j ∈ A1}. Then we
have |i1 −i| ≤ s. Also, Card(A1)≥ p−s. Similarly, let Al be the largest subset of Al−1
such that Xil−1 is uncorrelated with {Xk, k ∈Al} and il =argmin{|j−il−1| :j ∈ Al}. We
can see that |il −i| ≤ ls and Card(Al) ≥Card(Al−1)−s ≥ p−sl. Take l = [pτ2] with
τ2/4< τ
2 <min(τ2/3, τ1). Then Xi0, . . . , Xil are pairwise uncorrelated random variables,
where we set i0 = i. Clearly i1,· · · , il ∈ Bi = {j : σij0 = 0;j 6= i}. Without loss of
It suffices to show that for some ε0 >0, P max 1≤i<j≤l{λ −1 nij|ˆσij|}>1 +ε0 →1. (34)
Clearly, we can assume EX= 0 and Var(Xi) = 1 for 1 ≤i≤ l. By Lemma 2 and (14), we have minijλnij >0 with probability tending to one. By Lemma 2 it suffices to show that
for any 0< τ <2, An :=P max 1≤i<j≤l n (nθij)−1/2 n X k=1 XkiXkj o ≥τplogp→1. (35)
Sinceτ2logp≤(4−δ) loglfor 0< δ <4−τ2/τ
2and largen, (35) follows from Lemma 3.
Lemmas 4 and 5 below, proved in Cai and Liu (2010), are needed to prove Theorems 4 and 5.
Lemma 4 Suppose that X ∼ N(µ,Σ0) with Σ0 ∈ U¯0. Let s0(p) = O((logp)γ) for some
γ < 1 and nξ ≤ p ≤ exp(o(n1/3)) for some ξ > 0. Let δ > √2. Then there are at most
O(s0(p)) nonzero elements in each row of Σˆ
⋆ (δ). Furthermore, inf Σ0∈U¯0 PkΣˆ⋆(δ)−Σ0k2 ≤Cγ,δ,Mmax i σ 0 iis0(p) logp n 1/2 ≥1−O(p−M) (36)
for any M >0, where Cγ,δ,M is a constant depending only on γ, δ, M, and
sup Σ0∈U0 EkΣˆ⋆(δ)−Σ0k2 2 ≤Cs20(p) logp n (37)
for some constant C >0.
Lemma 5 Let λij =τ q ˆ θijlogp n with 0< τ < √
2. Under the conditions of Lemma 4,
Pmin i X j∈Bi I{|σˆij| ≥λnij(τ)} ≥p2ǫ0 →1 (38)
with any ǫ0 < (1−τ2/2)/2, where Bi = {j : σij0 = 0;j 6= i}. Hence for some constant
C > 0, inf Σ0∈U¯0 PkΣˆ⋆(τ)−Σ0k2 ≥Cmin i σ 0 iipǫ 0/2 s0(p) logp n 1/2 →1.
Proof of Theorem 4. To simplify the notation, we shall writes0 for s0(p). We construct
a matrixΣ0 ∈ Uq⋆. Lets1 = [(s0−1)1−q(logp/n)−q/2] + 1 and (X1,· · · , Xs1),Xs1+1,· · ·, Xp
be independent. Let σ0
ii=s0 for alli > s1, σii0 = 1 for 1≤i≤s1 and σ0ij = 4−1s0
p
logp/n
for 1 ≤i6=j ≤s1. Note thatσij0 = 0 fori6=j > s1. Sinces0 <4
p
n/logp,Σ0 is a positive
definite covariance matrix belonging to U⋆
q. Set Mn = (σij0)1≤i,j≤s1. We first suppose that
λn≤3−1σ0pp
p
2 logp/n. Lemma 5 yields
P p X j=s1+1 I{|σˆpj| ≥ √ 2 2 σ 0 pp r logp n } ≥p 2ǫ0 →1,
with any ǫ0 <3/8. Takeǫ0 = 7/20 and note thatp1/4 ≥s0,p1/10≥nq/2. By the inequality
|sλ(z)| ≥z−λ, inf λn≤3−1σ0 pp √ 2 logp/n sup U⋆ q PkΣˆg−Σ0k2 > √ 2 6 s 2 0(p) logp n (1−q)/2 →1. (39)
We next consider the case λn>3−1σpp0
p
2 logp/n. We have
kΣˆg−Σ0k2 ≥ kMˆ n−Mnk2,
where ˆMn= (ˆσijg)1≤i,j≤s1. As in Lemma 2, we can get for anyγ >0
P max 1≤i,j≤s1| ˆ σij −σij0| ≥ p 2γlogp/n≤Cs21(logp)−1/2p−γ.
Taking γ = 1, we have with probability tending to one, max1<i<j≤s1|σˆij| ≤ (4
−1s 0 +
√
2)plogp/n, which implies that ˆσijg = 0 for 1 ≤ i 6= j ≤ s1. Thus, with probability
tending to one, kMˆ n−Mnk2 ≥(4−1− √ 2s−01)s1s0 r logp n ≥ 3 64s 2−q 0 logp n (1−q)/2 .
This and (39) together imply (21).
Proof of Theorem 5 and Proposition 2. For brevity, we only consider the caseH = 1.
The proof for general H is similar. We first show that for any ε >0,
Since the random split is independent with the sample {X1,· · · ,Xn}, we can assume that
the two samples are{X1,· · · ,Xn1}and{Xn1+1,· · · ,Xn}. Let ˆΣ2 be the sample covariance
matrix from {Xn1+1,· · · ,Xn}and ˆΣ
⋆
1(δ) be defined as in (11) from{X1,· · ·,Xn1}. Define
ˆ
δo = ˆjo/N, where ˆjo= arg min
0≤j≤4N k ˆ Σ⋆1(j/N)−Σ0k2F. Set an=p−1kΣˆ ⋆ 1(ˆδ)−Σ0k2F and rn =p−1kΣˆ ⋆
1(ˆδo)−Σ0k2F. By the proof of Theorem 1, we
have PkΣˆ⋆
1(2)−Σ0kL1 ≤C1s0(p)(logp/n)
1/2→1 for someC
1 >0. Using the inequality
p−1kAk2
F ≤ |A|∞kAkL1 for anyp×p symmetric matrixAand the definition of ˆδo, we have
Prn ≤C2s0(p) logp/n→1 for some C2 >0. Note that E|(V,Σˆ2−Σ0)|2 ≤Cn−1
for any p×1 vector V with kVkF = 1. By the proof of Theorem 3 in Bickel and Levina
(2008) and the assumption that N is fixed, we can see that,
an≤OP 1 n1/2 a1n/2 +OP 1 n1/2 r1n/2+rn. (41)
Hence for some C3 >0,
Pan≤C3s0(p) logp/n→1. (42)
Note that by applying Lemma 5 to the samples {X1,· · · ,Xn1},
Pan≤C3s0(p) logp/n,ˆδ <√2−ε=o(1). This together with (42) shows that
Pδ <ˆ √2−ε≤Pδ <ˆ √2−ε, an≤C3s0(p) logp/n+o(1) =o(1),
and hence (40) holds. Since N is fixed, we have|σˆ−√2| ≥ε0 for some fixedε0 >0 which
depends on N. This together with (40) implies
for some ǫ >0. By Lemma 4, we see that with probability tending to one, for eachi, there are at most O(s0(p)) nonzero numbers of{|sλij(ˆσij)|;j ∈Bi} and by Lemma 2, they are of
order O(maxiσii0
p
logp/n). Let Ψi ={j : σ0ij 6= 0} and ˆΨi = {j : ˆσij⋆ 6= 0}. Then by the
conditions on sλ(z), we have kΣˆ⋆(ˆδ)−Σ0kL1 ≤max i X j∈Ψi∪Ψˆi |sλij(ˆσij)−σ 0 ij| ≤Cmaxi σii0s0(p) logp n 1/2 (44)
with probability tending to one. The proof of Theorem 5 is completed. Finally, Proposition 2 is proved by (43), Lemmas 2 and 4.
8
Supplemental materials
Additional proofs: A supplement to the main paper contains additional technical
argu-ments including the proofs of Lemmas 2, 4 and 5. (pdf file)
Acknowledgment
We thank the Associate Editor and two referees for their helpful comments which have led to an improvement of the presentation of the paper.
References
[1] Antoniadis, A. and Fan, J. (2001). Regularization of wavelet approximations. Journal of the American Statistical Association 96: 939-967.
[2] Cai, T. T. and Zhou, H. H. (2009). Minimax estimation of large covariance matrices under l1 norm. Technical Report.
[3] Cai, T. T. and Zhou, H. H. (2010). Optimal rates of convergence for sparse covariance matrix estimation. Technical Report.
[4] Cai, T. T. and Liu, W. (2010). Supplement to ”Adaptive thresholding for sparse covariance matrix estimation”. Technical Report.
[5] Bickel, P. and Levina, E. (2008). Covariance regularization by thresholding. Annals of Statistics 36: 2577-2604.
[6] Donoho, D. L. and Johnstone, J. M. (1994). Ideal spatial adaptation by wavelet shrink-age. Biometrika81: 425-455.
[7] Donoho, D. L. and Johnstone, J. M. (1998). Minimax estimation via wavelet shrinkage. Annals of statistics 26: 879-921.
[8] Hawkins, D. L. (1989). Using U statistics to derive the asymptotic distribution of Fisher’s Z statistic. Journal of the American Statistical Association 43: 235-237.
[9] El Karoui, N. (2008). Operator norm consistent estimation of large-dimensional sparse covariance matrices. Annals of Statistics 36: 2717-2756.
[10] Khan, J., Wei, J., Ringner, M., Saal, L., Ladanyi, M., Westermann, F., Berthold, F., Schwab, M., Antonescu, C. R., Peterson, C., and Meltzer, P. (2001). Classification and diagnostic prediction of cancers using gene expression profiling and artificial neural networks. Nature Medicine 7: 673-679.
[11] Rothman, A.J., Levina, E., and Zhu, J. (2009). Generalized thresholding of large covariance matrices. J. Amer. Statist. Assoc. 104: 177-186.
[12] Shao, Q.M. (1999). A Cram´er type large deviation result for Student’s t-statistic. Journal of Theoretical Probability 12: 385-398.
[13] Wang, Y. and Zou, J. (2010). Vast volatility matrix estimation for high-frequency financial data. Annals of Statistics 38: 943-978.
[14] Zaitsev, A. Yu. (1987). Estimates of the L´evy-Prokhorov distance in the multivariate central limit theorem for random variables with finite exponential moments. Theory Probab. Appl. 31: 203-220.