Performance and Load Testing
Real-World Test Results Show Why FlexPod
Datacenter powered by Intel® Xeon®
processors with Microsoft Private Cloud
and SQL Server 2014 Is a Premier
Integrated Platform for Mission-Critical
Performance and Scalability
Workload Tested Using
Iforium Gameflex Multivendor Casino
Platform
Contents
Executive Summary ... 3
The High Stakes of Online Gaming ... 3
The FlexPod Datacenter with Microsoft Private Cloud Challenge ... 3
Value of Real-World Testing ... 3
Results Highlights ... 3
Introduction ... 4
Iforium Gameflex Multivendor Casino Platform... 4
Audience ... 4
How FlexPod Datacenter with Microsoft Private Cloud Enables Mission-Critical Applications... 5
World-Class Performance ... 5
Scalability on Demand ... 5
Operational Efficiency ... 5
High Availability with Five 9s Performance ... 5
Optimized Productivity ... 6
Microsoft SQL Server 2014: New Features ... 6
Performance and Scalability Load Tests ... 6
What Is a Load Test? ... 6
Test Methodology ... 7
Operating System Configuration... 7
Hardware Configuration ... 8
Virtual Machine Configuration... Error! Bookmark not defined. Storage Configuration ... 8
Cisco and NetApp FlexPod Configuration ... 11
Load-Test Findings ... 12
Findings Overview ... 12
Detailed Key Indicators ... 13
Conclusion ... 21
Mission-Critical Real-World Workloads ... 21
Results Analysis ... 21
Table of
Contents
Integrated Solution ... 22
For More Information ... 23
Microsoft SQL Server 2014 Enterprise Edition ... 23
About Microsoft Visual Studio 2013 Ultimate Edition ... 23
About Cisco ... 23
About NetApp ... 23
About Iforium ... 23
Executive Summary
The High Stakes of Online Gaming
In the highly competitive world of online gaming, if your application and hardware platform are not performing at their highest levels, you will quickly find that your players will abandon you and that revenue will start to disappear. Gamers expect extremely fast speeds and no perceived latency in their user experience. If your site doesn’t provide this experience, they will find another site that does.
The FlexPod Datacenter with Microsoft Private Cloud Challenge
Given the high demands of online gaming and the need for very fast speeds for mission-critical gaming applications and databases, Cisco and NetApp contracted with Scalability Experts to put their FlexPod® Datacenter with Microsoft Private Cloud to the test with real-world workloads from gaming company Iforium. The purpose of the load test was to validate the FlexPod integrated solution as a premiere platform for the most demanding applications. For Iforium, the results exceeded expectations in all aspects. Read the results presented in this white paper. Whether your business is a gaming company, online retailer, financial institution, or manufacturing company, you will be impressed with the performance, scalability, and operational efficiency of FlexPod.
Value of Real-World Testing
Unlike tests that are run in a lab with simulated data, the Scalability Experts performance and scalability load-testing project used real-world workloads from a customer. Load testing, which differs from stress testing, allows the test user to measure business functions, for which the load-test tool then creates specific reports. Examples of metrics include completed sales transactions, administrative functions, and search response times—measurements that cannot normally be collected using operating system performance counters. Load testing also allows you to provision for a certain number of concurrent virtual users, which in turn answers the business question of how many users a software and hardware configuration can support when performing specific functions. If you are a customer running mission-critical applications, the test results in this document will give you realistic data points that reveal how your applications may perform on FlexPod.
Results Highlights
Test results verify that the FlexPod Datacenter with Microsoft Private Cloud and SQL Server 2014 solution is a premier platform for mission-critical applications:
World-class performance: Performance testing of up to 50,000 concurrent users was conducted. This testing revealed a steady linear progression with little degradation in the number of transactional spins and average page time, showing that the FlexPod solution accommodates even the largest enterprise systems.
Scalability: Load-test data was analyzed for average spins per second and average pages per second as concurrent users were incrementally added. This testing measured the throughput capability of the configured system and again demonstrated a steady linear progression, showing the predictable scalability of the platform.
Operational efficiency: Ramp up of concurrent users from 0 to 50,000 with graceful low latencies across the processor, memory, and I/O subsystems demonstrated the overall operational efficiency of FlexPod as an integrated solution that provides optimal performance
Introduction
Not all IT architectures provide equal capabilities, and if you need to run mission-critical applications, you need to choose a platform that has been tested and validated and that performs consistently in the real world. Unlike tests that are run in a lab with simulated data, the tests performed by Scalability Experts put the FlexPod integrated solution through its paces using real-world workloads. This document shows how the solution performed in these tests and demonstrates that FlexPod Datacenter with Microsoft Private Cloud is a premier mission-critical platform that offers exceptional performance, scalability, and overall efficiency. The test results show that:
Small, medium-size, and large enterprise applications can achieve excellent performance and scale with ease with the addition of new infrastructure components
Outstanding performance is achieved with Microsoft SQL Server 2014 on the FlexPod platform Overall IT risk and complexity is reduced by relying on pre-validated integrated solutions from
industry leaders Cisco, NetApp, and Microsoft
The testing and subsequent development and compilation of this document is a result of collaboration between Scalability Experts and Iforium, one of the UK’s leading online gaming companies, to showcase their Gameflex multivendor casino platform on FlexPod.
Iforium Gameflex Multivendor Casino Platform
Gameflex is Iforium’s innovative multivendor casino platform. It transparently aggregates premium online casino content from a range of global gaming vendors under a common single bonus and player loyalty scheme.
Gameflex is delivered through a set of flexible web APIs. This approach allows customers to create custom single-page mobile and web applications. The solution is backed by a complete back-office suite of management tools to increase the lifetime value of players.
Iforium’s customers demand the highest levels of uptime coupled with
the capability to scale to a high volume of concurrent online players. Low-latency web API response times are critical to delivery of an engaging player experience and increasing customer revenue. With the online gaming industry subject to increasing regulations, companies must have the flexibility to rapidly deploy a hardware solution in any jurisdiction.
Audience
The intended audience of this document includes software and hardware engineers, IT professionals and consultants, and companies running mission-critical applications that demand infrastructure that delivers performance, scalability, and IT efficiency with enterprise-level capabilities and always-on reliability.
Scalability Experts
is a
Triple Gold Microsoft
Partner and has achieved
numerous awards. It is a
globally recognized
consulting company
specializing in data
platforms, business
intelligence, and
infrastructure solutions.
How FlexPod Datacenter with Microsoft Private Cloud Enables
Mission-Critical Applications
FlexPod is an integrated computing, networking, and storage solution developed by Cisco and NetApp. Configurations for various workloads are published as Cisco®
Validated Designs or NetApp Validated Architectures and provide the foundation for effortless configuration and optimal sizing. The
solution is the basis for enterprise systems of all sizes that require high performance and rapid scalability.
World-Class Performance
Because FlexPod is built on a unified platform of computing, fabric, and storage technologies, high performance can be achieved at lower cost, allowing
companies to cost-effectively run mission-critical enterprise applications and databases. The results from online gaming performance and scalability tests reported in this document demonstrate world-class performance with room to grow. Intel Xeon®
processors help ensure that industry-standard performance is achieved.
Scalability on Demand
Standardized, pre-validated configurations provide the
capability to scale on demand with ease and flexibility. The test shows that small, medium-size, and large enterprise
applications can be scaled up simply by adding new components.
Operational Efficiency
The Cisco Unified Computing System™ (Cisco UCS®) powered
by Intel® Xeon® processors offers a state-of-the-art unified embedded management system for blade chassis and rack-mount servers, simplified operational training requirements, and reduced capital expenditures (CapEx) and operating expenses (OpEx) through a simple but powerful management suite. NetApp FAS systems reduce cost and complexity for virtualized infrastructure by meeting all your storage requirements with a single, highly scalable solution. The NetApp unified storage platform supports all protocols, so you no longer need to purchase separate systems to accommodate different storage needs.
High Availability with Five 9s Performance
The key to hardware reliability is a homogenous environment, removing the complexity of interconnect software and third-partyparty drivers. Reducing hardware complexity leads to less downtime, more consistent management, and reduced training requirements.
“The faster our spin times
and the faster our page
response times, the more
business we can do per
second enabling us to grow
faster and drive more
revenue. In our fast-paced
industry, a few milliseconds
difference in response time
can mean the gain or loss of
millions of dollars.”
The use of pre-validated hardware components also helps ensure an optimal hardware investment, allowing you to focus on your work.
The tests were run with the normal scheduled maintenance activities, which included database log backup operations and operational data updating, summing, etc.
Optimized Productivity
Simplified central management with pre-validated configurations optimizes system productivity, which helps optimize Microsoft SQL Server licensing expenditure. Cisco provides service profile templates for SQL Server, accelerating high-performance database system implementation.
FlexPod tight integration with Microsoft System Center 2012 R2 further improves ROI while enhancing productivity and management. In addition, data center power, cooling, and rack space costs are all reduced as a result of the unified hardware solution.
Microsoft SQL Server 2014: New Features
Some of the main new features of Microsoft SQL Server 2014 include updatable columnstore indexes, a new cardinality estimator, batch processing, and many online operational enhancements.
Performance and Scalability Load Tests
What Is a Load Test?
The best way to understand how an application and hardware configuration will behave in the real world is through the use of load tests. Although load tests are run in an artificial lab environment, the tests simulate as closely as possible what a real-world configuration would look like for the enterprise application. In this case, real-world workloads from Iforium were used.
Load tests differ from stress tests in their approach and intended results. Stress tests commonly push an application or hardware system until it fails, and these tests tend to be based on only one functional test area. The final metrics are almost always technical metrics: read operations per second, SQL
transactions per second, etc. These metrics are useful to engineers, but the tests often lack important metrics required to determine performance toward achieving business targets. In the test here, all management activities, such as transaction log backup and index rebuild operations, were also kept in place to further simulate the real-world environment.
Load-testing software allows the end customer to define business metrics related to particular functions, which the load-test tool then reports. Examples of metrics include completed sales transactions, administrative functions performed, and search response times—measurements that cannot normally be collected through operating system performance counters.
Load testing also allows you to provision for a certain number of concurrent virtual users, which answers the business question of how many users can a software and hardware configuration support when performing specific functions.
Therefore, these business metrics allow end customer to better understand how to effectively scale their own application environments.
Test Methodology
Tests were created using Microsoft Visual Studio to record users as they performed the application functions. The following scenarios were included in the tests:
Back-office user activity: Users who are reviewing players, applying bonuses, and making other manual account adjustments
New-player creation activity: Users who are creating new player accounts Gaming activity: Users who are playing online slot games
Database maintenance activity: Users who are performing regular transaction log backup operations and other normal system maintenance activities
The gaming activity consisted of: Logging on to the system
Checking the player’s current cash and bonus balance Checking the player’s current loyalty point balance Playing online slot games multiple times for real money Reviewing game play history
Awarding loyalty points accumulated from gaming activity
Think time is the amount of time a user normally waits between interactions. The test was set to randomly apply between 1 and 5 seconds of think time, and users were ramped up over an hour period to simulate a real load and to avoid the problem that would result from simultaneously logging on thousands of users to SQL Server, which is a relatively high-load operation for the CPU.
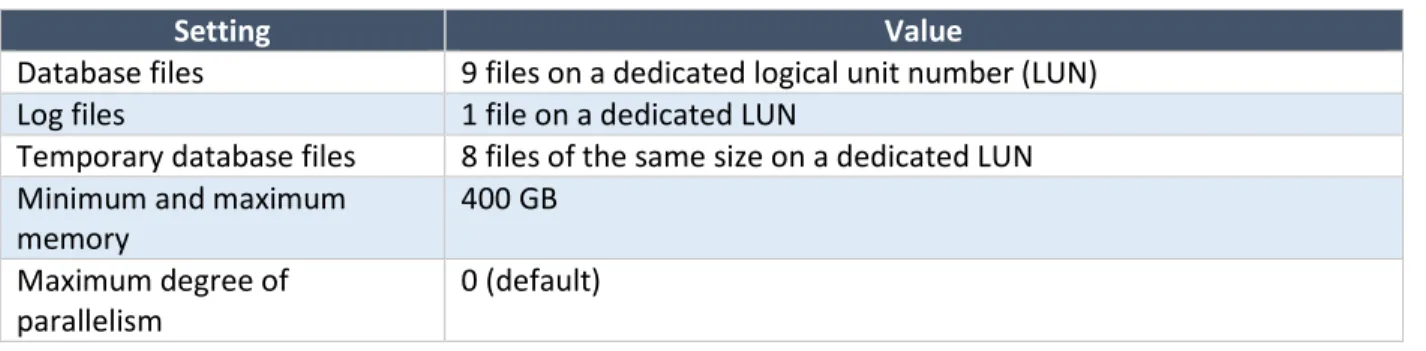
Operating System Configuration
All machines were running Microsoft Windows Server 2012 R2 Enterprise Edition on a virtual machine. No changes were made to any settings other than to set Power Management to High Performance and to enable Lock Pages in Memory (https://msdn.microsoft.com/en-us/library/ms190730.aspx). These are the usual recommended settings for enterprise SQL Server installations.
Table 1. Microsoft SQL Server 2014 Configuration
Setting Value
Database files 9 files on a dedicated logical unit number (LUN)
Log files 1 file on a dedicated LUN
Temporary database files 8 files of the same size on a dedicated LUN Minimum and maximum
memory
400 GB Maximum degree of
parallelism
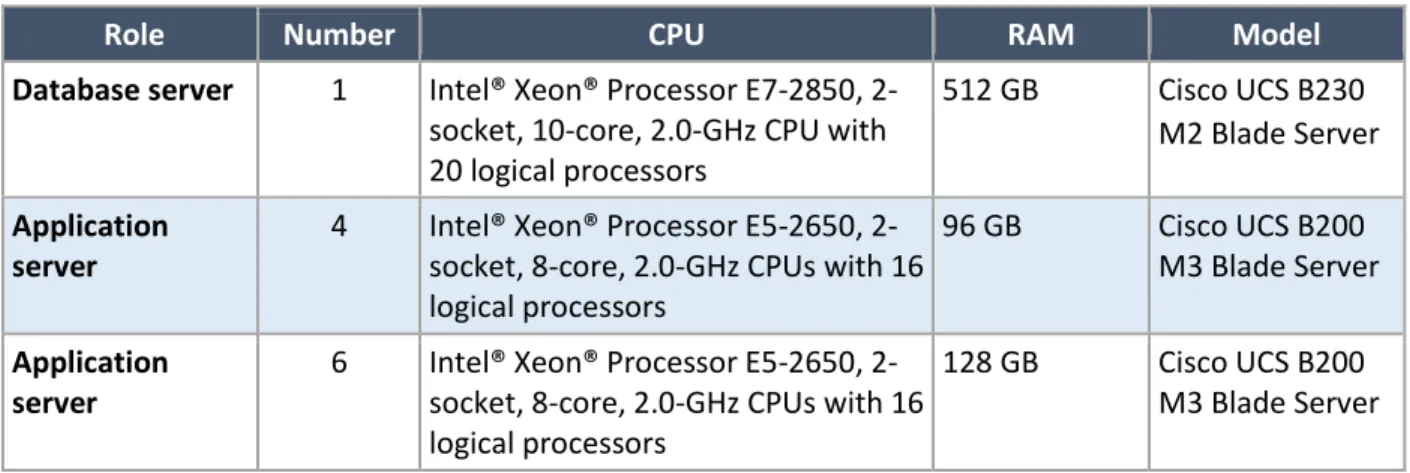
Hardware Configuration
Tables 2 and 3 summarize the hardware configuration used in the tests. Table 2. Application Machines
Role Number CPU RAM Model
Database server 1 Intel® Xeon® Processor E7-2850, 2-socket, 10-core, 2.0-GHz CPU with 20 logical processors
512 GB Cisco UCS B230 M2 Blade Server Application
server
4 Intel® Xeon® Processor E5-2650, 2-socket, 8-core, 2.0-GHz CPUs with 16 logical processors
96 GB Cisco UCS B200 M3 Blade Server Application
server
6 Intel® Xeon® Processor E5-2650, 2-socket, 8-core, 2.0-GHz CPUs with 16 logical processors
128 GB Cisco UCS B200 M3 Blade Server
Table 3. Test Controller and Agents
Role Number CPU RAM Model
Controller 1 Intel® Xeon® Processor E7-2850, 2-socket, 10-core, 2.0-GHz CPU with 20 logical processors
512 GB Cisco UCS B230 M2 Blade Servers Agents 16 Intel® Xeon® Processor E5-2650,
2-socket, 8-core, 2.0-GHz CPUs with 16 logical processors
16 GB Cisco UCS B200 M3 Blade Servers
Storage Configuration
The storage for these tests was provided by a NetApp FAS8040 2-node cluster running NetApp clustered Data ONTAP 8.2.1. Each of the two nodes contained 24 x 600-GB SAS disks and a 512-GB NetApp Flash Cache adapter. A 20-disk NetApp RAID-DP data aggregate was provisioned on each storage controller, providing a total of 8.65 terabytes (TB) of usable storage capacity on each storage controller.
All data in this solution was provided by 10-Gbps Fiber Channel over Ethernet (FCoE). Two FCoE logical interfaces (LIFs) were provisioned per storage controller, providing 20-Gbps load-balanced access to each mapped LUN disk. LUNs were grouped into volumes according to function, and all data volumes and LUNs were thin provisioned and de-duplicated by the SAN. All Microsoft Windows boot LUNs were cloned from a gold master Microsoft Windows Server 2012 R2 LUN using NetApp FlexClone technology.
Tables 4 and 5 show the data volume and LUN layouts. Table 4. Data Volume Layout
Name Node Size Purpose
APP_Data_LUNs 01 1.17 TB Application server mapped data disks DB_Data_LUNs 02 8.40 TB Database server mapped data disks OS_boot 01 1.00 TB All server and virtual machine boot disks
Table 5. LUN Layout
Name Volume Size Disk ID Purpose
APP-001-SCE APP_Data_LUNs 150 GB 1 Mapped data disk APP-002-SCE APP_Data_LUNs 150 GB 1 Mapped data disk APP-003-SCE APP_Data_LUNs 150 GB 1 Mapped data disk APP-004-SCE APP_Data_LUNs 150 GB 1 Mapped data disk APP-005-SCE APP_Data_LUNs 150 GB 1 Mapped data disk APP-006-SCE APP_Data_LUNs 150 GB 1 Mapped data disk APP-007-SCE APP_Data_LUNs 150 GB 1 Mapped data disk APP-008-SCE APP_Data_LUNs 150 GB 1 Mapped data disk APP-009-SCE APP_Data_LUNs 150 GB 1 Mapped data disk APP-010-SCE APP_Data_LUNs 150 GB 1 Mapped data disk DB-001-PAN-SCE-2 DB_Data_LUNs 200 GB 2 Mapped data disk DB-001-PAN-SCE-3 DB_Data_LUNs 50 GB 3 Mapped data disk DB-001-PAN-SCE-4 DB_Data_LUNs 1.17 TB 4 Mapped data disk DB-001-PAN-SCE-5 DB_Data_LUNs 400 GB 5 Mapped data disk DB-001-PAN-SCE-6 DB_Data_LUNs 100 GB 6 Mapped data disk DB-001-PAN-SCE-7 DB_Data_LUNs 150 GB 7 Mapped data disk DB-001-PAN-SCE-8 DB_Data_LUNs 100 GB 8 Mapped data disk DB-001-PAN-SCE-9 DB_Data_LUNs 600 GB 9 Mapped data disk DB-002-PAN-SCE-2 DB_Data_LUNs 200 GB 2 Mapped data disk DB-002-PAN-SCE-3 DB_Data_LUNs 50 GB 3 Mapped data disk DB-002-PAN-SCE-4 DB_Data_LUNs 1.17 TB 4 Mapped data disk DB-002-PAN-SCE-5 DB_Data_LUNs 400 GB 5 Mapped data disk DB-002-PAN-SCE-6 DB_Data_LUNs 100 GB 6 Mapped data disk DB-002-PAN-SCE-7 DB_Data_LUNs 150 GB 7 Mapped data disk DB-002-PAN-SCE-8 DB_Data_LUNs 100 GB 8 Mapped data disk DB-002-PAN-SCE-9 DB_Data_LUNs 600 GB 9 Mapped data disk
APP-001-PAN-SCE OS_boot 50 GB 0 Windows Server 2012 R2 boot disk APP-002-PAN-SCE OS_boot 50 GB 0 Windows Server 2012 R2 boot disk APP-003-PAN-SCE OS_boot 50 GB 0 Windows Server 2012 R2 boot disk APP-004-PAN-SCE OS_boot 50 GB 0 Windows Server 2012 R2 boot disk APP-005-PAN-SCE OS_boot 50 GB 0 Windows Server 2012 R2 boot disk APP-006-PAN-SCE OS_boot 50 GB 0 Windows Server 2012 R2 boot disk APP-007-PAN-SCE OS_boot 50 GB 0 Windows Server 2012 R2 boot disk
APP-009-PAN-SCE OS_boot 50 GB 0 Windows Server 2012 R2 boot disk APP-010-PAN-SCE OS_boot 50 GB 0 Windows Server 2012 R2 boot disk DB-001-PAN-SCE OS_boot 50 GB 0 Windows Server 2012 R2 boot disk DB-002-PAN-SCE OS_boot 50 GB 0 Windows Server 2012 R2 boot disk DB-003-PAN-SCE-VM OS_boot 50 GB 0 Windows Server 2012 R2 boot disk DC-001-PAN-SCE-VM OS_boot 50 GB 0 Windows Server 2012 R2 boot disk DC-002-PAN-SCE-VM OS_boot 50 GB 0 Windows Server 2012 R2 boot disk
RDM_Map OS_boot 100 GB 2 Raw device mapping data store
Cisco and NetApp FlexPod Configuration
Figure 1 shows the Cisco and NetApp FlexPod configuration.
Figure 1. Cisco FlexPod Architecture
Cisco Unified Computing System UCS 6200 Series Fabric Interconnects, Nexus 2232
Fabric Extender & UCS C-Series or B-Series
Servers SLOT1 SLOT5 SLOT3 SLOT7 SLOT2 SLOT 6 SLOT4 SLOT8 ! UCS 5108
OKFAIL OKFAIL OKFAIL OKFAIL
!ConsoleReset ! ! UCS B200 M1 !ConsoleReset ! ! UCS B200 M1 !ConsoleReset ! !UCS B200 M1 !ConsoleReset ! ! UCS B200 M1 !ConsoleReset ! !UCS B200 M1 !ConsoleReset ! ! UCS B200 M1 4567 0123 891011121314151617181920212223 DS2246 600GB600GB600GB600GB600GB600GB600GB600GB600GB600GB600GB600GB600GB600GB600GB600GB600GB600GB600GB600GB600GB600GB600GB600GB ifgrp 4567 0123 891011121314151617181920212223 DS2246 600GB600GB600GB600GB600GB600GB600GB600GB600GB600GB600GB600GB600GB600GB600GB600GB600GB600GB600GB600GB600GB600GB600GB600GB ifgrp vPC vPC Port-channel vPC vPC Port-channel Port-channel Port-channel
FlexPod
Fibre Channel over Ethernet Boot Scenario
vPC Peer Links
3
CISCO NEXUS N5548UP STATID
12345678910 11121314 15161718 19202122 2324 2526 27282930 3132
3
CISCO NEXUS N5548UP STATID 12345678910 11121314 15161718 19202122 2324 2526 27282930 3132 4567 0123 891011121314151617181920212223 DS2246 600GB600GB600GB600GB600GB600GB600GB600GB600GB600GB600GB600GB600GB600GB600GB600GB600GB600GB600GB600GB600GB600GB600GB600GB
CISCO NEXUS 5596UP
STAT ID
17181920212223242526272829303132 33343536373839404142434445464748
12345678910111213141516
CISCO NEXUS 5596UP
STAT ID
17181920212223242526272829303132 33343536373839404142434445464748
12345678910111213141516
Legend
FCoE and 10GbE FCoE Only
Clustered Data ONTAP Only within Circle
SFO Interconnect 10GbE Only
Cluster Interconnect Cisco Access Layer Nexus 5000, 6000 or 7000 series NetApp Storage FAS 2200, 3200, 6200 or 8000 series AB FAS8020 FAS8020 AB FAS8020 FAS8020 4567 0123 891011121314151617181920212223 DS2246 600GB600GB600GB600GB600GB600GB600GB600GB600GB600GB600GB600GB600GB600GB600GB600GB600GB600GB600GB600GB600GB600GB600GB600GB
CISCO UCS 6248UP12345678910 1112 1314 15161718 1920 2122 2324 2526 2728 2930 3132 STAT
ID CISCO UCS 6248UP12345678910 1112 1314 15161718 1920 2122 2324 2526 2728 2930 3132
STAT ID SLOT1 SLOT5 SLOT3 SLOT7 SLOT2 SLOT6 SLOT4 SLOT8 ! UCS 5108
OKFAIL OKFAIL OKFAIL OKFAIL
!ConsoleReset ! ! UCS B200 M1 !ConsoleReset ! ! UCS B200 M1 !ConsoleReset ! !UCS B200 M1 !ConsoleReset ! !UCS B200 M1 !ConsoleReset ! !UCS B200 M1 !ConsoleReset ! !UCS B200 M1 !Reset Console UCS B230 M1/M2 ! 2 ! 1
A03-D0100SSD-LH>>100GB SSD SATA A03-D0100SSD-LH>>100GB SSD SATA
!Reset Console UCS B230 M1/M2 ! 2 ! 1
Load-Test Findings
Throughput is the number of transactions that can be processed completely through the webpage, the application servers, the database processing, and back to the webpage.
Response time is the average time it takes for the webpage to reflect to the end user the processing round trip. According to the industry standard, response times should be less than 3 to 5 seconds for acceptable user tolerance.
According to general guidelines, acceptable application CPU use is about 75 percent. This rate reflects the optimal utilization of the application server resources, which tend to be CPU and memory intensive. The system is scaled out through the addition of more application servers behind a load-balancing system.
Because most applications use one database server (not counting servers used for reporting or failover), to help ensure performance and scalability you need to help ensure that the database access code and data patterns are optimal. You also need to help ensure that you have room to grow before you need to scale up your database server or redesign your solution as a distributed or federated database system. For this reason, database servers should not exceed a CPU utilization rate of 75 percent.
Findings Overview
The load testing took place over many weeks, and it consistently showed that the configured system supports linear scalability for up to 30,000 users, with burst support for up to 50,000 users—a very common number when companies run special campaigns or promotions. Because the tests are designed to reflect a real-world installation as much as possible, with normal administration tasks included, results can be used to configure systems for loads of from 5000 to 50,000 users.
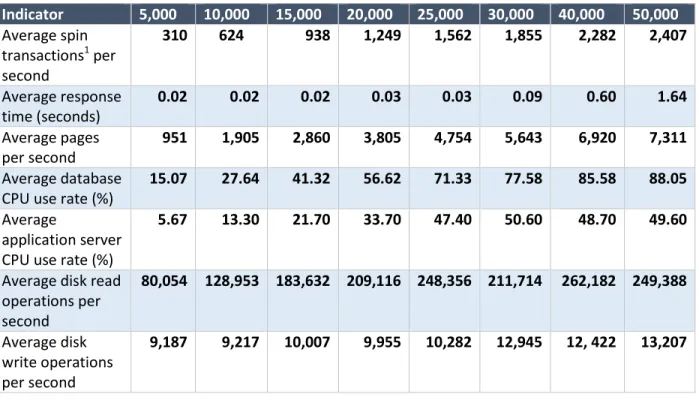
Table 6. Key Indicators
Indicator 5,000 10,000 15,000 20,000 25,000 30,000 40,000 50,000 Average spin transactions1 per second 310 624 938 1,249 1,562 1,855 2,282 2,407 Average response time (seconds) 0.02 0.02 0.02 0.03 0.03 0.09 0.60 1.64 Average pages per second 951 1,905 2,860 3,805 4,754 5,643 6,920 7,311 Average database
CPU use rate (%)
15.07 27.64 41.32 56.62 71.33 77.58 85.58 88.05 Average
application server CPU use rate (%)
5.67 13.30 21.70 33.70 47.40 50.60 48.70 49.60
Average disk read operations per second 80,054 128,953 183,632 209,116 248,356 211,714 262,182 249,388 Average disk write operations 9,187 9,217 10,007 9,955 10,282 12,945 12, 422 13,207
1
A spin transaction is defined as a press of the spin button, which places the wager and subsequently pays out any associated winnings.
Detailed Key Indicators
Table 6 summarizes the key indicators evaluated in the testing. The figures that follow show the results in more detail.
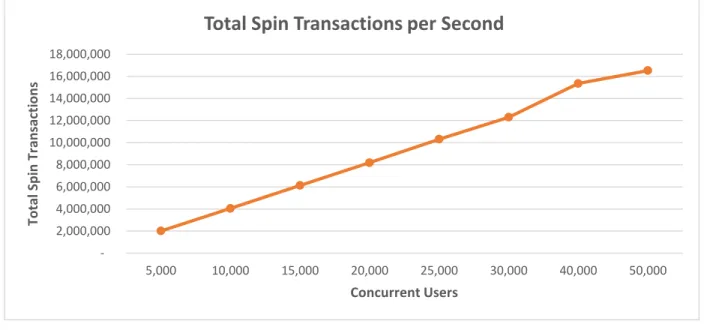
Figure 2. Total Spin Transactions per Second
Scalability analysis: Spin transactions refer to the virtual spin of the slot machine. A spin transaction is equivalent to one play. The graph in Figure 2 shows that FlexPod scales linearly as more users come onto the platform, with no noticeable impact on response time up to 30,000 users. It also shows that FlexPod can sustain burst rates of up to 50,000 users, as might occur in a special campaign. There was no degradation in FlexPod capability to process transactions at similar consistent rates while concurrent users were added, and businesses can expect predictable capacity for their FlexPod investments as demand increases. 2,000,000 4,000,000 6,000,000 8,000,000 10,000,000 12,000,000 14,000,000 16,000,000 18,000,000 5,000 10,000 15,000 20,000 25,000 30,000 40,000 50,000 To tal Spin Tr an sact io n s Concurrent Users
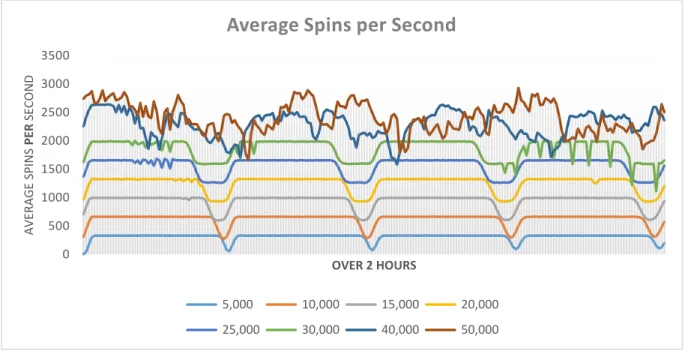
Figure 3. Average Spins per Second
Throughput and resiliency analysis: The average number of spins per second indicates the throughput of the configured system. Again, the test configuration shows consistent and linear support for 30,000 users, with support for bursts of up to 50,000 users. The average spins per page is a central metric for the gaming business, similar to the way that the number of widgets that can be produced per second is a critical measure for other types of companies. The graph in Figure 3 demonstrates FlexPod’s capability to process consistently high numbers of spins while the number of concurrent users ramped up to 50,000. This metric demonstrates the overall resiliency and efficiency of Microsoft SQL Server 2014 when running on Cisco UCS computing power in combination with NetApp storage.
0 500 1000 1500 2000 2500 3000 3500 A V ER A G E S PI N S PE R S ECO N D OVER 2 HOURS
Average Spins per Second
5,000 10,000 15,000 20,000 25,000 30,000 40,000 50,000 0 2000 4000 6000 8000 10000 A V ER A G E PA G ES PE R S EC O N D OVER 2 HOURS
Average Pages per Second
5,000 10,000 15,000 20,000
Figure 4. Average Pages per Second
Performance analysis: Average pages per second are the average number of pages that are loaded and displayed to the end users per second. The graph in Figure 4 shows that the number of pages loaded per second scales linearly up to 30,000 users, indicating that the FlexPod system as configured can
continuously run with 30,000 users, and it supports bursts of up to 50,000 users.
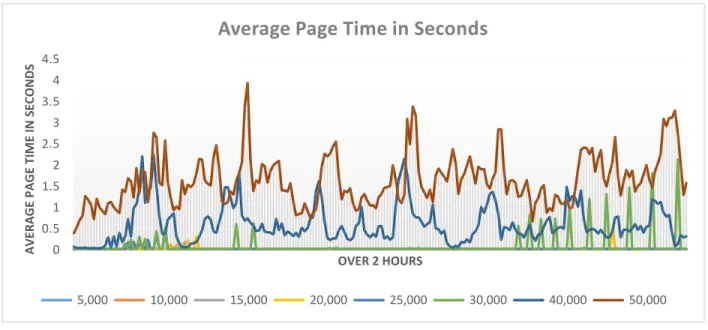
Figure 5. Average Page Time in Seconds
End-user experience analysis: Average page time refers to the average time it takes to load a page. This metric directly relates to the user experience. Generally, the user wait time for a page to load should be less than one second. The chart in Figure 5 shows that the FlexPod system as configured supports up to 30,000 users with less than one second of wait time, and it supports bursts of up to 50,000 users.
0 0.5 1 1.5 2 2.5 3 3.5 4 4.5 A V ER A G E PA G E TIM E IN S EC O N D S OVER 2 HOURS
Average Page Time in Seconds
Figure 6. Average Database Processor Time (Percent)
CPU resource use analysis: The processor time for the database indicates the percentage of CPU resources that are being used by the system. A general recommendation for a new system is to keep CPU use under about 30 percent, leaving room for growth. When CPU use reaches 75 percent, you are generally considered to be achieving maximum utilization of your CPU resources. The chart in Figure 6 shows that the system can support 30,000 users, with bursts of up to 50,000 users.
Figure 7. Average Disk Read Latency
Subsystem performance analysis: The average number of disk bytes per second for read operations indicates the capability of the subsystem to support multiple read operations. The faster the storage
0 20 40 60 80 100 PE R C EN TA G E OVER 2 HOURS
Average Database Processor Time %
5,000 10,000 15,000 20,000
chart in Figure 7 indicate times when read operations are not occurring and do not reflect an inability to support the load. This chart shows the average across all the disks.
Figure 8. Temporary Database Average Disk Bytes per Read Operation per Second
Subsystem use analysis: The chart in Figure 8 looks more closely at storage subsystem use for the temporary data base (tempDB), where SQL Server stores temporary files. The chart also indicates that tempDB is used often. This use rate is typical of a real-world mission-critical application in a production environment, where the use of tempDB can be substantial and in many cases can be a major source of bottlenecks. The results in Figure 8 show that although high tempDB loads are sustained over time, there is no real impact on performance. Mission-critical systems must use such disk subsystems, in which the impact on transaction latency can be reduced over time as tempDB use increases dramatically. - 10,000 20,000 30,000 40,000 50,000 60,000 70,000 TE N M PDB DI SK BYTES OVER 2 HOURS
TempDB Average Disk Bytes/Read per Second
5,000 10,000 15,000 20,000
Figure 9. Data Average Disk Bytes per Read Operation per Second
Data disk analysis: The chart in Figure 9 shows storage subsystem use for the data disk. The application is actually very insert intensive, with fewer read operations than write operations. The results indicate that although there are on an average 50,000 disk reads per second, the user does not see any material impact on latency or performance. These results further emphasize the utility of an end-to-end system like FlexPod, in which the disk subsystems are pre-optimized.
Figure 10. Log Average Disk Bytes per Read Operation per Second
Disk use per read operation analysis: SQL Server uses a dual write approach to data inserts. It writes first to the log for recoverability, and then to the database at designated times. The chart in Figure 10 shows the disk use for log read operations.
- 50,000 100,000 150,000 200,000 A V G DA TA DIS K B YT ES OVER 2 HOURS
Data Average Disk Bytes/Read per Second
5,000 10,000 15,000 20,000 25,000 30,000 40,000 50,000 - 200,000 400,000 600,000 800,000 1,000,000 1,200,000 A V G L O G D IS K BYTE S OVER 2 HOURS
Log Average Disk Bytes/Read per Second
5,000 10,000 15,000 20,000
Figure 11. Average Disk Bytes per Write Operation per Second
Write characteristics analysis: The application is insert intensive, adding new transactions as users log on and spin the virtual slot machines. The chart in Figure 11 shows the write characteristics for the total storage subsystem.
Figure 12. Temporary Database Average Disk Bytes per Write Operation per Second
The chart in Figure 12 shows the tempDB write characters for the system.
- 20,000 40,000 60,000 80,000 100,000 A V G DIS K BY TE S W R IT E OVER 2 HOURS
Average Disk Bytes/Write per Second
5,000 10,000 15,000 20,000 25,000 30,000 40,000 50,000 - 10,000 20,000 30,000 40,000 50,000 60,000 70,000 A V G TE M PDB D IS K BYTES OVER 2 HOURS
TempDB Average Disk Bytes/Write per Second
5,000 10,000 15,000 20,000
Figure 13. Data Average Disk Bytes per Write Operation per Second
Data drives analysis: The chart in Figure 13 shows the disk subsystem use for the data drives.
Figure 14. Log Average Disk Bytes per Write Operation per Second
Log drives analysis: The chart in Figure 14 shows the disk subsystem use for the log drives.
- 50,000 100,000 150,000 200,000 250,000 300,000 A V G D A TA D IS K BYTES OVER 2 HOURS
Data Average Disk Bytes/Write per Second
5,000 10,000 15,000 20,000 25,000 30,000 40,000 50,000 - 50,000 100,000 150,000 200,000 250,000 A V G L O G D IS K BYTE S OVER 2 HOURS
Log Average Disk Bytes/Write per Second
5,000 10,000 15,000 20,000
Conclusion
Given the high demands of the online gaming business and the need for extremely fast speeds for mission-critical gaming applications, Scalability Experts was contracted to test FlexPod Datacenter with Microsoft Private Cloud using real-world workloads from gaming company Iforium.
Mission-Critical Real-World Workloads
Scalability Experts selected and collaborated with Iforium with the idea that test results for such a demanding and robust gaming application could easily translate to other industries and business models that are considering this type of integrated platform. Regardless of whether your business is a gaming company, an online retailer, or a financial or manufacturing company, you should be impressed with the performance, scalability, and operational efficiency of the FlexPod Datacenter with Microsoft Private Cloud solution as demonstrated in the test results.
Results Analysis
In drawing conclusions from this data, Scalability Experts also used its deep data platform experience from a broad range of customers as well as proprietary internal data and results from other load-testing projects completed over the years. Cisco, NetApp, and Iforium provided feedback; however, Scalability Experts maintained control over the testing process and its findings and did not accept changes to the study that contradicted Scalability Experts findings.
The performance and load tests showed that the tested configurations easily scaled and supported up to
50,000 concurrent users with a normal number of administrative users and regular transaction log backup operations.
The tests showed very stable and linear data trends, with plenty of room to grow in the current
configurations.
The cumulative data demonstrated how an integrated computing, networking, and storage solution works
harmoniously to optimize efficiency. Table 7. Business Value and Test Results
Business Value
Test Evidence
World-class performance
Performance testing of up to 50,000 concurrent users showed a steady linear progression with no degradation for either transactional spins or average page time, showing that the FlexPod solution can accommodate large enterprise systems.
Ease of scalability
Linear progression showed steady scalability and burst capabilities, allowing the platform to provide stable system-capacity growth.Operational efficiency
While ramping up concurrent users from 0 to 30,000 with graceful low latencies across the processor, memory and I/O subsystems demonstrated the overall operational efficiency of FlexPod as a well-designed and optimally integrated solution for mission-critical workloads.
High availability
Tests running while performing high-availability actions demonstrate the solution’s efficiency in the most demanding environments.Optimized productivity*
Scalability Experts did not have direct data points to evaluate optimized productivity; however, other secondary research was referenced that provided positive indicators related to total cost of ownership (TCO), return on investment (ROI), and other benchmarking data reflecting the optimized productivity of the overall solution.
Integrated Solution
Although this test was not performed in comparison to other platform options, the results, as presented in this report, clearly show that if you are a customer running mission-critical applications, you should consider and evaluate the integrated FlexPod Datacenter with Microsoft Private Cloud solution. In addition, the tests show that you can achieve significant value and performance gains from selecting a fully integrated solution that is pre-engineered and configured using best practices rather than an internally developed system that combine disparate hardware and software that is not pre-validated. Consistent performance that meets business expectations is critical, and its importance is highlighted in the commentary about these test results. Note, too, that the tests did not reveal any surprises: the FlexPod solution is engineered to handle these types of workloads with no surprises. With this solution, your IT department will not need to spend time debating configuration choices when first installing the system and you will be less likely to spend critical time trying to figure out what isn’t working optimally. Based on the test results and the experience of Scalability Experts, FlexPod Datacenter powered by Intel® Xeon® processors with Microsoft Private Cloud is a premier integrated platform for mission-critical performance and scalability.
*FlexPod was positioned as a leader in the Gartner Integrated Systems Magic Quadrant in 2014. In addition, a study by Forrester Research on the total economic impact of Cisco and NetApp FlexPod Data Center Platform reported a very positive risk-adjusted ROI of 120 percent.
For More Information
Microsoft SQL Server 2014 Enterprise Edition
SQL Server 2014 makes it easier and more cost effective to build high-performance mission-critical applications, enterprise-ready big data assets, and business intelligence solutions that help employees make better decisions faster.
SQL Server 2014 accelerates reliable, mission-critical applications with the new in-memory columnstore and better compression, which can query 100 times faster than traditional solutions. SQL Server also delivers peace of mind as the most secure database five years in a row (National Institute of Standards and Technology Comprehensive Vulnerability Database, April 17, 2013; market share from IDC 2013). More information about SQL Server 2014 can be found at
http://www.microsoft.com/en-us/server-cloud/products/sql-server/ .
About Microsoft Visual Studio 2013 Ultimate Edition
Visual Studio 2013 Ultimate Edition was used to generate and run the performance and load tests. For more information about Visual Studio 2013 Ultimate Edition, see
http://msdn.microsoft.com/en-us/library/dd831853.aspx.
About Cisco
More information about Cisco FlexPod can be found at
http://www.cisco.com/c/en/us/solutions/data-center-virtualization/flexpod/index.html.
About NetApp
More information about NetApp can be found at
http://www.netapp.com/us/solutions/cloud/microsoft-cloud/flexpod.aspx.
About Intel
More information about Intel® Xeon® processors can be found at http://www.intel.com/ITcenter
About Iforium
Founded in 2006, Iforium is an independent e-gaming software development company with its main office in the UK, on the Isle of Man.
Iforium focuses on developing a flexible and modular enterprise-class platform that offers a suite of third-party gaming products and business intelligence tools.
Gameflex is Iforium’s innovative multivendor casino solution. It transparently combines premium online and mobile casino content from a range of global gaming vendors under a common single bonus and player loyalty scheme.
Wagerflex is Iforium’s player account management platform and common wallet solution. Wagerflex provides the core of the online offering and is integrated into a suite of industry-leading e-payment processors and affiliate management systems.
About Scalability Experts
Scalability Experts provides expert services for scalability assessments, performance tuning, migrations and upgrades, consolidations, virtualization, business intelligence, and cloud computing. Its solutions can help you increase the performance of your database operations, lower your IT costs, and improve your business decision-making capabilities. Scalability Experts is a Microsoft National Systems Integrator (NSI) Gold Designated Partner and a four-time winner of the Partner of the Year award. The company has a strong global presence, with multiple offices in the United States, Dubai, Singapore, and Mumbai. More information about Scalability Experts can be found at http://www.scalabilityexperts.com/.
© 2015 NetApp, Inc. All rights reserved. No portions of this document may be reproduced without prior written consent of NetApp, Inc. Specifications are subject to change without notice. NetApp, the NetApp