Theses & Dissertations Boston University Theses & Dissertations
2016
A brain-machine interface for
assistive robotic control
https://hdl.handle.net/2144/14528
Dissertation
A BRAIN-MACHINE INTERFACE FOR ASSISTIVE ROBOTIC CONTROL
by
BYRON V. GALBRAITH
B.S., University of Illinois at Chicago, Chicago Illinois, 2006
M.S., Marquette University and the Medical College of Wisconsin, Milwaukee Wisconsin, 2010
Submitted in partial fulfillment of the requirements for the degree of
Doctor of Philosophy 2016
© 2016
Byron V. Galbraith All rights reserved
First Reader _________________________________________________________ Frank H. Guenther, Ph.D.
Professor, Department of Speech, Language, and Hearing Sciences
Second Reader _________________________________________________________ Massimiliano Versace, Ph.D.
Research Assistant Professor, Center for Computational Neuroscience and Neural Technology
Third Reader _________________________________________________________ Deniz Erdogmus, Ph.D.
Associate Professor, Electrical and Computer Engineering Northeastern University, College of Engineering
iv
ACKNOWLEDGMENTS
I would like to thank the following people for their contribution to the completion of this dissertation. My advisors, Frank Guenther and Max Versace, provided invaluable guidance, mentorship, and perspective during the course of my research. My committee chair, Dan Bullock, offered support and assistance throughout my time in the Cognitive and Neural Systems program. My officemates and colleagues at Boston University assisted, encouraged, and motivated me to work harder.
I would like to especially thank my wife, Karen, for her patience and support through the entire process and my children, Zephan and Tamzin, for the joy they brought me every day.
This work was supported in part by the Center of Excellence for Learning in Education, Science, and Technology, a National Science Foundation Science of Learning Center (NSF SMA-0835976).
v
A BRAIN-MACHINE INTERFACE FOR ASSISTIVE ROBOTIC CONTROL BYRON V. GALBRAITH
Boston University Graduate School of Arts and Sciences, 2016
Major Professor: Frank H. Guenther, Ph.D. Professor, Department of Speech, Language, and Hearing Sciences
ABSTRACT
Brain-machine interfaces (BMIs) are the only currently viable means of communication for many individuals suffering from locked-in syndrome (LIS) – profound paralysis that results in severely limited or total loss of voluntary motor control. By inferring user intent from task-modulated neurological signals and then translating those intentions into actions, BMIs can enable LIS patients increased autonomy. Significant effort has been devoted to developing BMIs over the last three decades, but only recently have the combined advances in hardware, software, and methodology provided a setting to realize the translation of this research from the lab into practical, real-world applications. Non-invasive methods, such as those based on the electroencephalogram (EEG), offer the only feasible solution for practical use at the moment, but suffer from limited communication rates and susceptibility to environmental noise. Maximization of the efficacy of each decoded intention, therefore, is critical.
This thesis addresses the challenge of implementing a BMI intended for practical use with a focus on an autonomous assistive robot application. First an adaptive EEG-based BMI strategy is developed that relies upon code-modulated visual evoked potentials (c-VEPs) to infer user intent. As voluntary gaze control is typically not
vi
available to LIS patients, c-VEP decoding methods under both dependent and gaze-independent scenarios are explored. Adaptive decoding strategies in both offline and online task conditions are evaluated, and a novel approach to assess ongoing online BMI performance is introduced.
Next, an adaptive neural network-based system for assistive robot control is presented that employs exploratory learning to achieve the coordinated motor planning needed to navigate toward, reach for, and grasp distant objects. Exploratory learning, or “learning by doing,” is an unsupervised method in which the robot is able to build an internal model for motor planning and coordination based on real-time sensory inputs received during exploration.
Finally, a software platform intended for practical BMI application use is developed and evaluated. Using online c-VEP methods, users control a simple 2D cursor control game, a basic augmentative and alternative communication tool, and an assistive robot, both manually and via high-level goal-oriented commands.
vii
TABLE OF CONTENTS
ACKNOWLEDGMENTS ... iv
ABSTRACT ... v
TABLE OF CONTENTS ... vii
LIST OF TABLES ... xi
LIST OF FIGURES ... xii
LIST OF ABBREVIATIONS ... xiv
1. INTRODUCTION ... 1
1.1. Problem Statement ... 1
1.2. Contribution ... 1
1.3. Organization ... 2
2. AN ADAPTIVE CODE-MODULATED VISUAL BCI METHOD FOR PRACTICAL APPLICATIONS ... 3
2.1. Introduction ... 3
2.1.1 Brain-Computer Interfaces ... 3
2.1.2. Visual Evoked Potentials ... 4
2.1.3. Gaze Independence ... 5
2.2. Methods and Materials ... 7
viii 2.2.2. Experimental Design ... 8 2.2.3. Procedure ... 12 2.2.3.1. Training ... 13 2.2.3.2. Testing ... 15 2.2.4. Cognitive Workload ... 17 2.2.5. Analysis... 18 2.2.5.1. Signal Preprocessing ... 18 2.2.5.2. Feature Extraction ... 19 2.2.5.3. Classification ... 21 2.2.5.4. Confidence Thresholding ... 23 2.2.5.5. Reliability ... 24 2.3. Results ... 27 2.3.1. Spatial Filters ... 27
2.3.4. Filters and Templates ... 31
2.3.4. Confidence Metrics ... 35
2.3.5. Adaptive Online Performance ... 36
2.3.6. Cognitive Workload ... 39
2.4. Discussion ... 40
2.4.1. Qualitative Online Feedback ... 41
2.4.2. Gaze-Dependent Task Performance ... 42
2.4.3. Gaze-Independent Task Performance ... 44
ix
2.5. Conclusion ... 49
3. A NEURAL NETWORK-BASED EXPLORATORY LEARNING AND MOTOR PLANNING SYSTEM FOR CO-ROBOTS ... 51
3.1. Introduction ... 51
3.2. Methods and Materials ... 53
3.2.1. CoCoRo Architecture ... 53 3.2.2. Robot Platform ... 57 3.2.3. System Implementation ... 58 3.2.3.1. Reaching ... 62 3.2.3.2. Motor Babbling ... 67 3.2.3.3. Navigation ... 68 3.3. Results ... 70 3.3.1. Hand-Eye Coordination ... 71 3.3.2. Egocentric Navigation ... 73
3.3.3. Grasping Distant Objects ... 76
3.4. Discussion ... 78
3.4.1. The CoCoRo Control System ... 78
3.4.2. Virtual Environments ... 80
3.4.3. Hand-Eye Coordination ... 82
3.4.4. Egocentric Navigation ... 86
3.4.5. Grasping Distant Objects ... 89
x
4. BCI CONTROL OF A SEMI-AUTONOMOUS ROBOT ... 92
4.1. Introduction ... 92
4.2 The Unlock Framework ... 93
4.2.1. Architecture ... 94
4.3. Methods and Materials ... 95
4.3.1. Online BCI Tasks ... 96
4.3.2. Experimental Procedure ... 100 4.4. Results ... 102 4.5 Discussion ... 105 5. CONCLUSION ... 107 BIBLIOGRAPHY ... 109 VITA ... 116
xi
LIST OF TABLES
Table 2.1. c-VEP spatial filters. ... 21 Table 2.2. Average scores of individual NASA-TLX factors. ... 40 Table 4.1. Relative performance of subjects on online task control. ... 102
xii
LIST OF FIGURES
Figure 2.1. M-sequence flicker patterns. ... 10
Figure 2.2. Procedure schematic for the three c-VEP tasks. ... 13
Figure 2.3. Feedback gradients. ... 15
Figure 2.4. Oddball stimulus during an overlapped trial. ... 17
Figure 2.5. Overt task classification accuracies for various spatial filters. ... 28
Figure 2.6. Covert task classification accuracies for various spatial filters. ... 29
Figure 2.7. Overlapped task classification accuracies for various spatial filters. ... 30
Figure 2.8. Overt task ITR for various spatial filters. ... 31
Figure 2.9. Overlapped task ITR for various spatial filters. ... 32
Figure 2.10. Covert task ITR for various spatial filters. ... 33
Figure 2.11. Training results using CCA for subject S3. ... 34
Figure 2.12. Training results using CCA for subject S1. ... 35
Figure 2.13. Comparison of potential confidence threshold metrics. ... 36
Figure 2.14. Online c-VEP classification accuracies using 2DLLAP. ... 37
Figure 2.15. Online c-VEP classification accuracies using CCA. ... 37
Figure 2.16. Reliability over time of adaptive 2DLLAP. ... 38
Figure 2.17. Reliability over time of adaptive CCA. ... 39
Figure 3.1. The cognitive cycle. ... 54
Figure 3.2. The CoCoRo common coordinate reference frame. ... 56
Figure 3.3. The Calliope robot. ... 57
xiii
Figure 3.5. Stick model of the Calliope arm. ... 63
Figure 3.6. Differential-drive kinematic model. ... 69
Figure 3.7. Three robot behavioral experiments. ... 70
Figure 3.8. Comparison of derived versus learned models for hand-eye coordination. ... 73
Figure 3.9. Learning body size through motor babbling. ... 74
Figure 3.10. Autonomous pursuit task. ... 76
Figure 3.11. Motor planning coordination while picking up a distant object. ... 78
Figure 3.12. Calliope lifting an object. ... 80
Figure 3.13. Detected hand position during motor babbling. ... 84
Figure 4.1. The GridCursor app interface. ... 97
Figure 4.2. The GridSpeak app interface. ... 98
Figure 4.3. The robot controller app in manual drive mode. ... 99
Figure 4.4. The robot controller app in auto-drive mode ... 100
xiv
LIST OF ABBREVIATIONS
AAC ... Alternative and Augmentative Communication API ... Application Programming Interface BCI ... Brain Computer Interface BMI ... Brain Machine Interface c-VEP ... Code-modulated Visual Evoked Potential CCA ... Canonical Correlation Analysis CoCoRo ... Cognitive Co-Robot EEG ... Electroencephalography ERP ... Event-Related Potential ITR ... Information Transfer Rate LDA ... Linear Discriminant Analysis LIS... Locked-In Syndrome LSL ... Lab Streaming Layer RBF ... Radial Basis Function RMSE ... Root Mean Square Error SNR ... Signal-to-Noise Ratio SSVEP ... Steady State Visual Evoked Potential TLX ... Task Load Index
1. INTRODUCTION 1.1. Problem Statement
Brain-machine interfaces, also called brain-computer interfaces (BCI), are the only currently viable means of communication for individuals suffering from locked-in syndrome (LIS) – profound paralysis that results in severely limited or total loss of voluntary motor control. By inferring user intent from task-modulated neurological signals and then translating those intentions into actions, BCIs can enable LIS patients increased autonomy. Significant effort has been devoted to developing BCIs over the last three decades, but only recently have the combined advances in hardware, software, and methodology provided a setting to realize the translation of this research from the lab into practical, real-world applications. Non-invasive methods, such as those based on the electroencephalogram (EEG), offer the only feasible solution for practical use, but suffer from limited communication rates. Maximization of the efficacy of each decoded intention, therefore, is critical. This can be achieved through BCI-controlled mobile robots with reaching capabilities that can autonomously translate a limited set of high-level commands into complex environmental interactions.
1.2. Contribution
The contribution of the work presented herein is fourfold. First, adaptive code-modulated visual evoked potential (c-VEP) BCI methods were developed and evaluated for online practical use. Second, a control system for an assistive robot was created that
imbued the robot with autonomous capabilities for reaching and grasping remote objects. Third, the online c-VEP BCI method was used to control and direct a robot embodied with the autonomous control system to navigate toward distant targets. Finally, in order to support both the BCI research and the development of BCI applications such as the robot interface, the Unlock framework, a Python-based BCI software platform, was developed.
1.3. Organization
The rest of this document is organized as follows. Chapter 2 describes a novel method for an adaptive c-VEP BCI geared toward practical applications, while Chapter 3 describes a neural-network based system for embodying an assistive robot with autonomous reaching and navigation capabilities. In Chapter 4, the Unlock framework is described in detail and the online control of user applications, such as directing an autonomous robot to navigate toward distant objects, is demonstrated using the c-VEP BCI method. Finally, Chapter 5 concludes the dissertation with a summary of all the work presented herein and identifies potential areas of future work and direction.
2. AN ADAPTIVE CODE-MODULATED VISUAL BCI METHOD FOR PRACTICAL APPLICATIONS
2.1. Introduction
2.1.1 Brain-Computer Interfaces
A brain-computer interface (BCI) is a system that acquires neural activity from a user, processes that signal to identify and extract relevant features, classifies those features to decode user intent, and then translates that decoded intent into a computerized action (He et al., 2012). For individuals suffering from locked-in syndrome (LIS), which involves intact cognition with near or total loss of voluntary motor control, a BCI may be their only means of communication. These individuals do not live in research labs, so in order for them to gain real-world benefit from advances in BCI technology, the BCI must be made practical and robust enough for home use.
For a BCI to be practical it needs to address issues other than maximizing information transfer rate (ITR), such as maintaining a high level of decision accuracy over extended periods of time, operating in noisy, non-clinical environments, and supporting easy maintenance by caregivers and other non-BCI experts. Adaptive BCI decoders and tasks offer great promise for practical BCI, as they can be designed to automatically respond to changes in signal quality brought on by both environmental noise and internal state of the user.
2.1.2. Visual Evoked Potentials
A common BCI paradigm is to detect sensory evoked potentials in electroencephalography (EEG) data (He et al., 2012). These events result from a variety of sensory stimuli including visual, auditory, and somatosensory. In each case a detectable change in EEG can be correlated to a particular attended stimulus delivered via one of the above modalities. For example, in steady state visual evoked potentials (SSVEP), continual attention to a visual stimulus flickering at a fixed rate above 4Hz entrains the visual cortex to the flicker pattern, resulting in a corresponding pattern of activity in the EEG signals recorded over the visual cortical region.
SSVEP-based methods can be divided into two categories based on the stimulus presentation paradigm: frequency and phase. Frequency (f-VEP) methods (Middendorf et al., 2000) present multiple stimuli that each flicker at a different, constant rate (e.g. 12, 13, 14, 15 Hz). Like f-VEP, phase (p-VEP) methods (Jia et al., 2011) present multiple stimuli that flicker at a constant rate, though instead of varying the frequency, a single frequency is used with varying phase offsets.
Alternatives to steady state presentation methods are impulse-like methods that evaluate repeatability of the EEG response in the time domain. Code-modulated (c-VEP) methods use maximum length sequences (m-sequences) (Sutter, 1992) to describe a pseudorandom flashing pattern presented at a fixed display frequency. A key property of m-sequences is that they have an autocorrelation function that approximates an impulse signal. This makes them attractive for stimulus flicker patterns in VEP-based BCI, as any phase shifts in the presentation cycle will correspond to equal shifts in the resulting EEG
response pattern. This is exploited by presenting multiple targets starting at different time lags of the m-sequence, and then using the linear cross-correlation of the samples with a template to determine the offset corresponding to the attended target. The template is generated during a training phase, where the EEG responses to several m-sequence presentation cycles at a fixed phase offset are obtained and used to train a classifier. In addition to using a single m-sequence with several phase-shifted targets, a method using multiple, concurrent m-sequences has also been demonstrated (Nezamfar et al., 2011). This multi-sequence c-VEP paradigm is the basis for the methods explored throughout this work.
2.1.3. Gaze Independence
Gaze-dependence, an implicit requirement of most visual-based BCI, renders the BCI impractical for real-world use. If the subject has reliable gaze control, an eye tracker is significantly more reliable than a BCI (Pasqualotto et al., 2015), while if they do not, the BCI may not work at all. To offer a practical solution, visual BCIs need to assume gaze-independence. Gaze-independence in the context of BCI takes on two different forms. First, there are gaze-fixed, covert attention paradigms where individual target stimuli are attended to in the visual periphery while gaze is directed elsewhere, typically at a central fixation point (Kelly et al., 2005). Second and less frequent, there are non-spatially selective paradigms, where the stimuli either alternate over the fixation point or take up the most of the field of view, such as rapid serial visual presentation (Hild et al.
2011; Acqualagna and Blankertz, 2013) and using overlapping stimuli (Allison et al., 2008; Zhang et al., 2010), respectively.
VEPs are strongest when both gaze and attention is directed at the target stimulus. When covertly attending to stimuli, the evoked potentials are still detectable, albeit at lower signal-to-noise ratio (SNR) (Walter et al., 2012). Finding ways to boost these signals is thus critical for reliable covert attention BCI. Co-adaptive methods that employ both machine learning on the signal processing side and user guidance via feedback on the task presentation side are one way to boost SNR in BCI (Vidaurre et al., 2011). Performance feedback allows the BCI user to learn attentional strategies that may produce better results, while adaptive decoding methods can provide greater robustness to nonstationarities that exist in the signals across users and sessions.
In this work we explore different attentional paradigms for c-VEP BCI with a goal toward practical application. We evaluate gaze-directed overt attention, gaze-fixed covert attention, and gaze-constrained non-spatially selective overlapped target attention tasks. We compare several different spatial filter strategies for each and evaluate different confidence threshold mechanisms. We then compare an adaptive online classification method to a static one, and present a performance analysis method that takes into consideration the effect online trial rejection has on traditional classification accuracy for practical use considerations.
The rest of this chapter is arranged as follows. Section 2 describes the experimental design and decoding methods. Section 3 presents the results of the three c-VEP task experiments. Section 4 compares the methods and results to previous work,
comments upon the sources of error, and discusses key findings from the experiments. Finally, Section 5 concludes the chapter with a recap of the presented work and suggested future directions to investigate.
2.2. Methods and Materials 2.2.1. Data Acquisition
Eight subjects (2 females, aged 21-38) were recruited to perform the experiments, with data collected over a single session. All gave informed consent for the study, which had been approved by the Boston University Institutional Review Board. Two subjects had prior BCI experience, though none had experience with c-VEP BCI. All subjects had normal or corrected to normal vision, and none reported a history of epilepsy or indicated sensitivity to rapidly flicking lights.
EEG was recorded using the Enobio 8 (Neuroelectrics, Barcelona, Spain), an eight-channel wireless EEG recording system. Electrodes were placed at locations PO7, O1, Oz, O2, PO8, PO3, Pz, and PO4 according to the 10-20 international system with reference CMS and DRL electrodes placed over the right mastoid. EEG was digitized at 500Hz and transmitted via a Bluetooth connection to the BCI computer, where it passed through the Neuroelectrics NIC software to the Unlock application and saved to disk.
The experimental sessions were conducted in in an office-like environment lit with fluorescent ceiling lights. Subjects were seated in a comfortable chair approximately 70cm from an LCD computer monitor with a display resolution of 1920x1080 pixels operating at a 120Hz refresh rate. A Tobii EyeX eye tracker mounted just under the
screen was used to track the subjects’ gaze during trials to ensure proper gaze fixation. Prior to beginning the experiment, subjects created eye tracking calibration profiles. Individual alpha frequency data was also obtained by instructing subjects to close their eyes three times for approximately five seconds at a time.
Data collection and task presentation were performed on the same computer using the Unlock software. EEG and gaze data were streamed into Unlock using the Lab Streaming Layer (LSL) library (available: https://github.com/sccn/labstreaminglayer). Event markers, such as the start of a c-VEP presentation cycle, were generated in software by Unlock and synchronized with the EEG and eye gaze data streams using the relative timestamps generated by LSL.
2.2.2. Experimental Design
The experiment was split into three phases: training, testing, and application control. In the training and testing phases, three different c-VEP tasks were performed: overt, covert, and overlapped. For the overt task, subjects were directed to gaze at and attend directly to a specific flickering target. In the covert task, subjects gazed at a central fixation point while attending to a specific target in their peripheral vision. Finally, the overlapped task had subjects gazing in the vicinity of a fixation target while attending to one of two overlapping checkerboard patterns that filled the entire screen. The application control phase was based on the overt task, with full procedure and results described in Chapter 4.
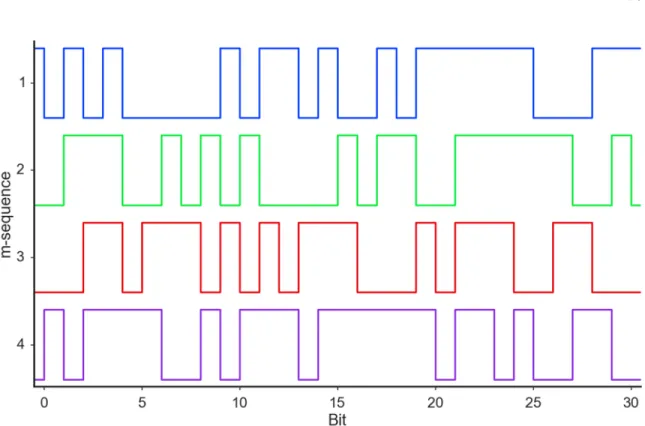
All tasks involved attending to stimuli flickering according to one of four possible 31-bit m-sequence-based patterns (Figure 2.1). A one in the sequence corresponded to the stimulus being on, or visible, while a zero corresponded to the stimulus being off, or hidden. The sequence progressed at a rate of 30Hz, requiring 1.034 seconds to complete one full presentation of the pattern.
The four m-sequences were the same as in (Nezamfar et al., 2011) and were chosen to have near-zero Pearson correlation coefficients:
𝜬 = 1 −0.033 −0.033 1 −0.033 −0.044−0.033 −0.044 −0.033 −0.033 −0.044 −0.044 1 −0.044 −0.044 1
The correlation coefficient matrix P of a sample matrix X, where each row is a different variable and each column is an observation, is defined as
𝝆𝒊𝒋 = 𝑪𝒊𝒋 𝑪𝒊𝒊𝑪𝒋𝒋
(𝟐. 𝟏) where Cij is the covariance between the ith and jth rows of X.
Figure 2.1. M-sequence flicker patterns.
In the overt and covert trials, m-sequences 1, 2, 3, and 4 were the basis for the flicker patterns presented by the up, down, left, and right targets, respectively. In the overlapped trials, m-sequences 2 and 3 were used for the green and magenta targets, respectively.
In both the overt and covert attention tasks, four white squares, 180x180 pixels in size (4.7cm, 3.86° visual angle), were centered 360 pixels (9.2cm, 5.81° visual angle to
the inner edge) above, below, to the left, and to the right, respectively, from the center of the screen in front of a black background. This arrangement was chosen to reserve sufficient room in the center of the screen for the user application workspace.
The subject was instructed, through an onscreen prompt in the form of an arrow and fixation indicator (a cross) to look at and directly attend to the indicated target. An additional prompt had them look only at the center fixation point as a null-class reference.
The covert task was identical to the overt task, except that subjects were instructed to maintain gaze fixation at the center of the screen while only attending to the cued stimulus in their periphery.
The third task evaluated a strategy for non-spatially selective BCI. The entire screen was filled with overlapping green-clear and clear-magenta checkerboard patterns over a black background. The individual checkerboard tiles were square with side lengths of 108 pixels (2.84cm, 2.33° visual angle), or one-tenth the height of the screen. The
colors had their alpha channel set to 0.75, providing some level of transparency. The green tiles flickered according to one m-sequence pattern while the magenta ones flickered according to another. The green tiles were shifted six pixels down and to the right while the magenta tiles were shifted six pixels up and to the left for a total offset of twelve pixels from each other, which, combined with the transparency effect, helped to create a sense that the checkerboards were on different depth planes, with the magenta tiles appearing slightly in front of or on top of the green tiles. The subject was directed to gaze in the vicinity of one of five different fixation points and attend to the green tiles, the magenta tiles, or just the fixation point.
The color, density, and offsets of the checkerboards were determined through a pilot study of one subject, with the above described combination of properties producing the greatest classification accuracy. Green and magenta are complementary colors in the RGB additive color model used by computer screens and provide high contrast while reinforcing brightness. Other complementary or opponent colors, such as cyan,
red-blue, and blue-yellow, were evaluated but did not perform as well and were reported to not be as distinct from one another as the green-magenta combination.
2.2.3. Procedure
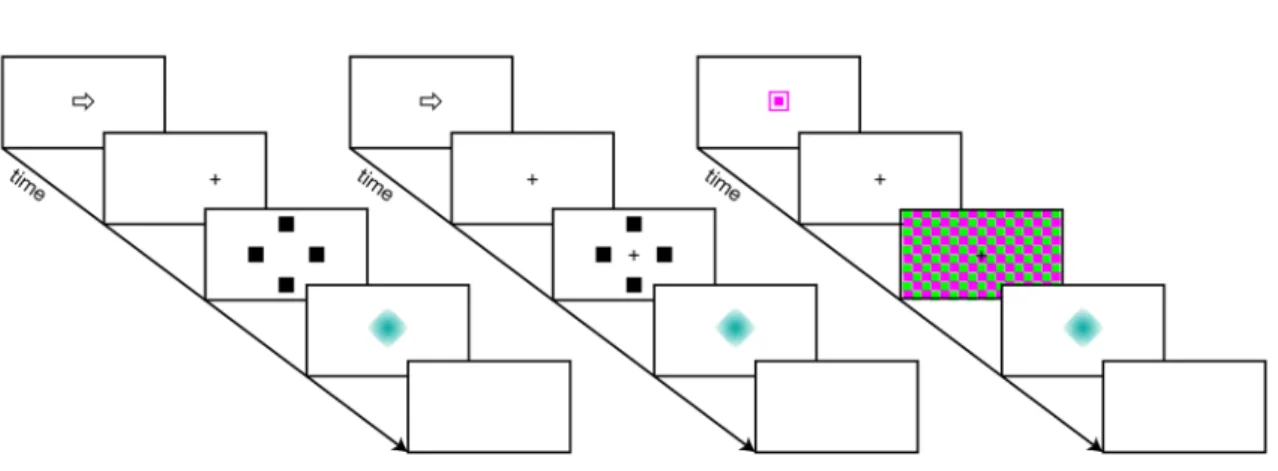
Both the training and testing portions of the experiment followed the same basic trial layout (Figure 2.2). The different task paradigms were presented in blocks. At the start of each block, the subject was directed to press the space bar on the keyboard to start the block. The name of the task was presented for 2.0s then the trials began. Each trial started with a cue to the attentional target that lasted 0.5s, followed by a preparation period in which only the fixation point was visible for another 0.5s. Next came the actual task period when the stimuli were active on the screen – the number of stimuli and duration of flicker were determined by the particular phase of the experiment. After the task period ended, a feedback period occurred lasting 0.5s in which a visual indicator of the result was displayed. Finally, a rest period occurred containing no visual display and lasting another 0.5s.
Figure 2.2. Procedure schematic for the three c-VEP tasks.
The overt (left), covert (center), and overlapped (right) tasks all followed the same general presentation pattern of cue, preparation, stimulation, feedback, and rest. While the timings of some segments varied between training and testing phases, they were the same across all paradigms.
The decoding method used relied on template matching, so an initial training phase was required to collect and build the m-sequence response templates for each subject before moving on to the testing phase. All subjects performed training in the same order: first the overt task, then the covert task, and finally the overlapping task.
2.2.3.1. Training
At the start, each potential target was presented twice and in isolation for 5.5s. An additional two null class cases were also presented, in which all targets were active while the subject gazed at the fixation point but was asked to not attend to anything in particular or “zone out”. The order of the target presentation was randomized and no feedback was provided during this initial phase. In the case of the overlapped task, the subject was told that they did not have to maintain fixed gaze on the fixation point but maintain gaze in the near vicinity.
In the second training phase, all targets were present and active on the screen. Each target, including the null target, was cued four times in random order. Each trial lasted 5.5s. In the overt and covert trials, an additional feedback gradient image was placed near the intended target (Figure 2.3). The brightness of this gradient image changed after each full sequence cycle, or about every 1.034s, to reflect the relative strength of the online decoding attempts. The brighter the gradient became, the more highly correlated the last trial was with the current template for that target. Brightness was determined by the following equation:
𝒃 = 𝟐𝟓𝟓
𝟏 + 𝒆6𝟓 𝝆 6𝟎.𝟏𝟓 (𝟐. 𝟐) where b is an integer in [0, 255) and ρ is the correlation coefficient between the trial and the template for the cued target. As the stimulus filled the entire screen during the overlapped trials, a large central feedback gradient image was presented at the end of the trial instead.
Figure 2.3. Feedback gradients.
Two types of feedback were provided to subjects. During the training phase trials of the overt and covert tasks, the colored feedback indicator appeared on the inner edge of the cued stimulus (left). A large, centrally placed feedback indicator appeared immediately proceeding the training phase trials of the overlapped task and all task trials of the testing phase (right).
2.2.3.2. Testing
After completing the training phase, subjects then performed the testing phase of the experiment. Here, subjects were presented with three blocks of trials per task for a total of nine blocks. The blocks were presented in such a way that no paradigm would appear three times in a row and no subject received the same block order as any other. The presentation order was counterbalanced across all subjects so that the distribution of task block occurrences was roughly equal for a given order position.
A test block consisted of ten cues per target, including the null target, presented for 3.3s in order to capture three full m-sequence cycles. No feedback gradient appeared during trials, but instead appeared immediately afterward as a centered gradient image as
in the second overlapped training phase (Figure 2.4). In the covert trials, gaze fixation on the center of the screen was enforced through eye tracking. If the subject’s gaze was detected to move greater than 1.8° from center, the trial ended with a “bad gaze”
feedback indicator and the trial was repeated. The overlapped trials also moved the fixation point to one of five locations: centered and the for corners, placed at relative screen positions of (0.5, 0.5), (0.2, 0.2), (0.2, 0.8), (0.8, 0.2), and (0.8, 0.8), respectively.
In order to incentivize subjects to attend to the targets, an oddball stimulus would flicker during non-null target cues in approximately 10% of the trials. The oddball stimulus would appear randomly between 0.5s and 1.0s into the trial and remain visible for 0.25s. In the overt and covert trials, the oddball was white, the same size as the target stimuli and appeared over the cued target. In the overlapped trials, the oddball was the color of the cued target, the size of a single tile, and appeared over one of the appropriately colored tiles near the directed gaze point. Subjects were instructed to press the space bar when they saw the oddball stimulus appear. Their accuracy at detecting the oddballs was confirmed at the end of the testing phase.
Before the start of the experiment proper, subjects were shown practice demonstration versions of both the training and testing procedures for all three tasks, during which the instructions for the tasks were given. This ensured familiarity with the tasks and allowed for any questions regarding the procedure to be answered.
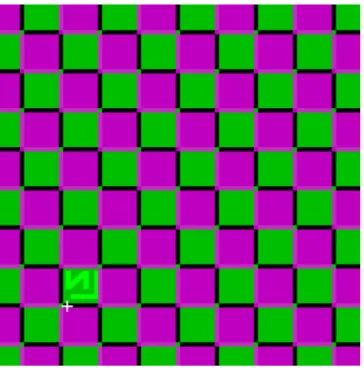
Figure 2.4. Oddball stimulus during an overlapped trial.
This is part of a screen capture taken the moment when the oddball stimulus is visible during an overlapped task trial.
2.2.4. Cognitive Workload
The NASA Task Load Index (NASA-TLX) (Hart and Staveland, 1988) survey provides a quantitative measure of relative cognitive workload experienced during execution of a particular task or set of related tasks. It consists of two parts. First, subjects rate six factors: mental demand, physical demand, temporal demand, performance, frustration, and effort on a 20-point scale for each task performed. Each point of the scale is worth five points. Second, the subject performs a pair-wise comparison of all factors, for a total of 15 comparisons, selecting which of the two factors contributed more to the experienced workload. This comparison is done once for the entire set of tasks. The number of times each factor was selected is summed and then divided by 15 to compute
that subject’s personal weights for each factor. The cognitive workload score for each task is then the weighted average of the factors, producing a value between 0-100, with higher values indicating greater cognitive workload.
The pen and paper version of the NASA-TLX survey was administered to the subjects after completing the testing phase of the experiment. Each subject completed the survey for the overt, covert, and overlapped tasks, in that order. They then performed the factor comparison portion of the survey, with the pair-wise comparisons presented randomly.
2.2.5. Analysis
2.2.5.1. Signal Preprocessing
First, each channel was adaptively demeaned using an exponential weighted moving average filter according to the following formula:
𝝁𝒊,𝟎= 𝒙𝒊,𝟎 (𝟐. 𝟑) 𝝁𝒊,𝒕 = 𝜶𝒙𝒊,𝒕+ 𝟏 − 𝜶 𝝁𝒊,𝒕6𝟏, 𝒕 > 𝟎 (𝟐. 𝟒) 𝒚𝒊,𝒕 = 𝒙𝒊,𝒕 − 𝝁𝒊,𝒕 (𝟐. 𝟓) where i corresponds to the ith channel, x is the raw sample,
µ is the adaptive mean,
α is the smoothing factor, and y is the demeaned sample. Here, α = 0.05 following (Vidaurre et al., 2011). This has the effect of acting as a high-pass filter.
EEG data related to task trials were detected and isolated by the presence of markers in a separate channel inserted via software. The trial data was extracted and resampled to 64 samples using the FFT method. The choice to resample rather than apply
a low-pass filter was two-fold. First it significantly reduced the total number of features from 517 to 64 per channel that had to be considered by downstream feature extraction and classification processes. Second, the actual number of samples in a trial could vary slightly due to temporal jitter that caused slight desynchronization between presentation and data acquisition, so resampling forced all trials to have the same number of samples which also aided in the downstream processing. The number of samples was set at 64 via analysis of pilot data from two subjects. Given a trial length of 1.034s this produced an effective new sample rate of approximately 62 Hz which placed it above the Nyquist rate needed for the 30Hz display frequency used by the stimuli.
2.2.5.2. Feature Extraction
The features used for building average response templates came from the spatially-filtered EEG recorded during each trial. Seven different spatial filters associated with EEG-based BCI were evaluated in offline analysis (Table 2.1). First was a single channel filter that only used the signal from Oz, which has been shown to be effective for overtly attended c-VEP (Nezamfar et al., 2011). Second was a bipolar channel filter that used the difference between Pz and Oz, previously used in an adaptive SSVEP study (though they used POz instead of Pz) (Fernandez-Vargas et al., 2013). Next was a common average reference (CAR) filter along with three different discrete Laplacian filters centered on Oz. Whereas the bipolar channel represents the first spatial derivative, Laplacian channel filters represent the second spatial derivative. Both CAR and Laplacian filters have been used in motor imagery tasks (McFarland et al., 1997), but not
typically in VEP studies. The three Laplacian filters evaluated were a 1D Small Laplacian using O1, Oz, and O2; a 1D Large Laplacian using PO7, Oz, and PO8; and a 2D Large Laplacian using PO7, Oz, PO8, and Pz. Normally a 2D Laplacian filter would have five channels, but as the the center channel Oz was already at the boundary of the electrode montage, a truncated version was used. Finally, filters were produced on a per-subject, per-target bases using Canonical Correlation Analysis (CCA). CCA-based filters have proven to be quite effective in c-VEP BCI (Bin et al., 2011; Spüler et al., 2013; Waytowich and Krusienski, 2015).
CCA produces a set of column vectors wx and wy that maximize the correlation
between two matrices X and Y via: 𝒎𝒂𝒙 𝒘𝒙,𝒘𝒚𝝆(𝒙, 𝒚) = 𝒘𝒙𝑻𝑿𝒀𝑻𝒘𝒚 𝒘𝒙𝑻𝑿𝑿𝑻𝒘 𝒙∙ 𝒘𝒚𝑻𝒀𝒀𝑻𝒘𝒚 (𝟐. 𝟔)
In the context of BCI classification, X is the preprocessed EEG signal from all channels and Y is a reference signal of interest. In this work, X is created by concatenating m n-channel trials of length k in the evaluation data set together producing a matrix of shape (n, m x k). Y is obtained by taking the median average channel response across the same m trials, then repeating that result m times to produce a matrix of shape (1, m x k). The resulting vector wx will then have shape (n, 1) and act as the spatial filter
across channels. This procedure is repeated to produce a separate filter for each target in the task.
Filter Name Label Weights
Single Oz [0, 0, 1, 0, 0, 0, 0, 0]
Bipolar Pz-Oz [0, 0, -1, 0, 0, 0, 1, 0]
Common Average Reference CAR [1/8, 1/8, 1/8, 1/8, 1/8, 1/8, 1/8, 1/8] 1D Small Laplacian 1DSLAP [0, 1, -2, 1, 0 ,0 ,0 ,0]
1D Large Laplacian 1DLLAP [1, 0, -2, 0, 1, 0, 0, 0] 2D Large Lalpacian 2DLLAP [1, 0, -3, 0, 1, 0, 1, 0] Canonical Correlation Analysis CCA Subject and target specific
Table 2.1. c-VEP spatial filters. 2.2.5.3. Classification
Existing c-VEP methods use template matching for classification purposes. This is based on the observation that the sequence and magnitude of VEPs elicited by the flicker pattern is generally consistent for each presentation cycle. A template is created from a training data set and then used as the basis for comparison during classification of a testing data set. Template generation methods range from simple averaging (Bin et al, 2011) to more advanced machine learning approaches, such as using one-class support vector machines (Spüler et al., 2012). In this work, templates are created by taking the median average feature vector of the training set produced after preprocessing and feature extraction as in (Nezamfar et al., 2011).
In phase-based c-VEP methods, only a single template is required as all target stimuli will have the same pattern, just shifted by a predetermined phase. Classification is then accomplished by computing the offset of the maximum linear cross-correlation value between the test sample and the template, then matching that to the target stimulus associated with that offset. In this work, each stimulus had its own distinct m-sequence, so each target stimulus required its own template. The linear correlation coefficient of the test sample with each template is computed, and the template that has the highest correlation is chosen as the determined class.
A weakness of the median average template generation and correlation coefficient classification methods are that they are both highly susceptible to temporal drift. Any jitter in the alignment of the EEG signal with the stimulus presentation can introduce offsets that can then greatly impact the sharpness of the templates or the determined correlation coefficients. Temporal jitter is a known problem with high temporal precision presentation systems that use multi-tasking operating systems (Straw, 2008) and one reason BCI display systems turn to microcontroller-controlled LEDs or hardware-based triggers using photodiodes. During pilot data analysis, it was determined that this offset was occurring in data collected through the Unlock software. A software-based solution to the jitter problem was employed by adjusting the classification method to assume slight offsets occur. Correlation coefficients for all templates at five different phase shifts of the test signal, in this case rolling the feature vector by 0, 1, 2, 3, and 4 points forward, respectively. The template with the greatest score amongst all templates and signal shifts was then selected as the classified target.
In addition to fixed-template classifiers evaluated offline, an adaptive classifier was used online during the training and testing phases to drive the feedback indicators. After each single-cycle trial, the template for the cued target was updated by adding the extracted features from the trial data to a buffer and recomputing the median average template. This was performed regardless of whether the decoder correctly classified the trial or not. During training, the template was computed from a growing number of samples, reaching a total of 30 per target by the end of the phase. The set of training samples was carried over to the testing phase, where each new trial replaced the oldest from the set, resulting in the template being computed from the 30 most recent target trials. The 2DLLAP spatial filter was chosen for this online adaptive template method based on initial pilot studies.
2.2.5.4. Confidence Thresholding
In order to compensate for bad signals or potentially identify when a user was not actually paying attention to any target, a confidence threshold was added to determine if the classifier’s result was acceptable. Trials that did not meet this confidence threshold were rejected. From an online BCI perspective, this meant that the decoder returned a null result, or “no decision,” for that trial.
Some classifiers, such as LDA, have classification probabilities built into them which could be used to determine confidence. For the correlation-based template matching decoder used here, another strategy was required. In order to evaluate confidence metric candidates, templates were generated from the training phase and used
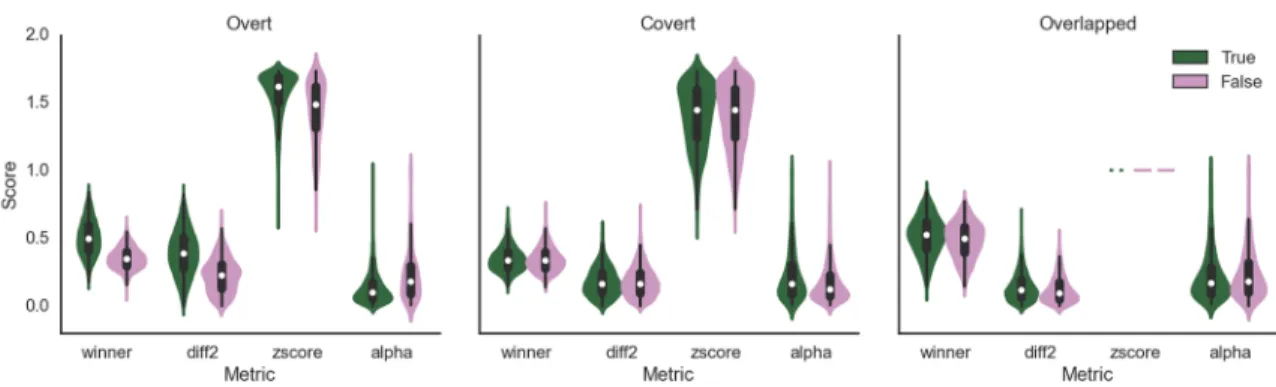
to classify the trials from the testing phase. All template correlation scores and estimated alpha band power over Oz for each trial were recorded and partitioned based on whether the trial classification was correct or not. Four different potential metrics were evaluated: the predicted target score (“winner”), the difference between the predicted target and the next closest target (“diff2”), the z-score of the predicted target computed from all target scores (“zscore”), and the relative alpha band power (“alpha”).
2.2.5.5. Reliability
When reporting on the performance of an online BCI task, most studies simply list the overall classification accuracy and likely the associated ITR of the decoding method. ITR is flawed as a metric for practical online BCI evaluation as it only considers raw information throughput under certain preconditions (Yuan et al., 2013), many or all of which may not hold in more user-centric BCI designs that employ adaptive or asynchronous methods. Also, with the exception of very high accuracies which imply continual success, raw classification accuracy fails to capture how that performance was spread across the duration of the task.
The challenge of quantifying BCI performance is further compounded by decoders that employ trial rejection, such as the confidence threshold described in this work. The ITR calculation does not have a way to adequately incorporate these null results, though from a user standpoint, the occasional “no decision” would be preferable to an erroneous one. One approach is to treat these null results the same as trials rejected due to artifact contamination and not count them in the final accuracy calculation.
However, a decoder that achieves a 100% classification accuracy by omitting 90% of all trials under consideration due to rejection is not usable either, so raw classification accuracy is also not enough.
In order to address these problem, an analysis method was developed that attempts to quantify the relative performance of a BCI with online trial rejection over time. This metric, termed reliability, has a value in [-1,1] that is recomputed after every trial, with values of 1, -1, and 0 corresponding to reliably accurate, reliably inaccurate, and unreliable, respectively.
Reliability was computed using the following algorithm. First, a, the expected accuracy due to chance for the task, was determined, e.g. a = 0.5 for a two-choice task, a = 0.25 for a four-choice task. Then, starting with the first decoded trial, and for each trial thereafter, the trial accuracy was scored as +1 for a correct classification and -1 for an incorrect classification. Null results score based on how many consecutive rejections have occurred according to the following:
𝒔𝟎 = 𝒎𝒂 𝒙 −𝒕𝟎𝒂, −𝟏 (𝟐. 𝟕) where t0 is the number of consecutive trials prior to the current one that also had a
rejected trial. Negative scores were assigned to errors and null results because, from a practical application standpoint, an error is frequently costly, requiring additional corrective actions to achieve the desired outcome. The fractional and increasingly negative score for a null result was to reflect that, while the occasional rejected trial is acceptable and even desirable, too many continuous rejections would have a negative impact on usability. The score was added to a running tally, s. The pre-scaled reliability,
𝒓, was obtained by dividing the cumulative score by the t number of trials observed at that point
𝒓 =𝒔
𝒕 (𝟐. 𝟖) Next, let c = 1 – 2/n be an alignment factor, where n is the number of choices in the task. For n > 2, the rescaled reliability score, r, was then computed as
𝒓 = 𝒓 + 𝒄 𝒄 , 𝒓 ≤ 𝒄 𝒓 + 𝒄 𝟏 + 𝒄, 𝒓 > 𝒄 (𝟐. 𝟗)
This scaling method ensures that a reliability score of zero corresponds to the theoretical chance level for the BCI task, which can provide for quick relative comparison between tasks that have different numbers of targets. It does, however, have the effect of magnifying worse-than-chance behavior while compressing better-than-chance behavior.
Theoretically, reliability differs from ITR in a number of ways. First, ITR is an information theoretic approach that describes performance in terms of bits per choice. In order to do this, it treats the recorded classification accuracy as a binary probability distribution. Reliability, on the other hand, has neither the notion of bits of information nor having a probability measure, so it is able to incorporate dynamic weighting of each choice prediction to incorporate other potential factors such as usability. Second, both reliability and ITR peg chance level accuracy at zero. Doing worse than chance under ITR, however, produces a non-zero score. While this is intuitive in the sense of information, it can raise issues in simply comparing ITR numbers. For instance, the ITR
for a four choice task is approximately equal at 1% and 58% classification accuracy. To avoid this confusion, ITR is typically not reported for classification accuracy below chance. Third, reliability is bounded between [-1, 1], regardless of the number of choices or time of choice, making it a more qualitative metric for comparing usability of a variety of BCIs. ITR provides a more direct comparison for the theoretical decision throughput a particular BCI could achieve.
2.3. Results
2.3.1. Spatial Filters
The seven different spatial filters were evaluated offline using single-cycle trials collected from the testing phase. Null-class trials were ignored and no trial rejection due to artifact contamination was performed. Templates were evaluated using 5-fold cross validation with 66% of the trials (n=240 for overt and covert, n=120 for overlapped) used for training and the remaining 33% (n=120/n=60) used for validation. In the following figures, the color scale is centered around chance-level accuracy (0.25 for overt/covert, 0.5 for overlapped). Darker hues of red indicate greater than chance accuracy, while darker hues of blue indicate worse than chance accuracy.
Figure 2.5. Overt task classification accuracies for various spatial filters.
Overt task performance (Figure 2.5) ranged from chance levels in some cases to near perfect performance in others. For the general filters, accuracy was typically higher the more differential channels that were incorporated into the filter. The CAR filter was the worst performing across all subjects. The user- and target-specific CCA filters outperformed all others, demonstrating a 20% increase over the next best performing option in two subjects (S4, S7). S4, in particular, has relatively poor performance across all general filters. This suggests noisy channels, either from Oz itself or from one of the others included in the filters. CCA’s success in this case comes from its ability to effectively minimize the contribution of bad channels.
Figure 2.6. Covert task classification accuracies for various spatial filters.
Covert performance, on the other hand, was no better than chance for almost all subjects and filters (Figure 2.6). Only CCA for subject S1 (p < 0.01) and the Large Laplacian filters for subject S6 (1DLLAP, p < 0.01; 2DLLAP, p < 0.05) were able to achieve better than chance accuracies.
The overlapped task performance (Figure 2.7) appeared to be more dependent on the subject than on any particular filter. Half of the subjects (S2, S4, S5, S8) were unable to achieve significant performance over chance for any filter, while three subjects (S3, S6, S7) were able to cross the usability threshold of 70% (Kübler et al., 2004). Unlike in
the overt task, CCA did not appear to offer an advantage over the Large Laplacian methods.
Figure 2.7. Overlapped task classification accuracies for various spatial filters.
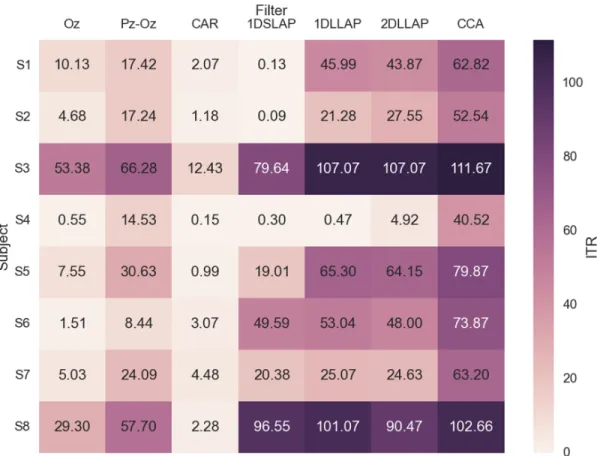
In addition to computing accuracies, the ITR values of these results were also obtained. Notable is that the best ITR performance for the overt task (Figure 2.8) was an order of magnitude greater than that of the overlapped task (Figure 2.9), which itself was an order of magnitude greater than the covert task (Figure 2.10)
Figure 2.10. Covert task ITR for various spatial filters.
2.3.4. Filters and Templates
Example spatial filters and resultant templates generated via CCA from the training data are shown for two subjects, S3 and S1 in Figure 2.11 and Figure 2.12, respectively. CCA clearly picks out Oz as the most important channel for S3 in both the overt and overlapped tasks, regardless of target. It also exhibits spatially distinct filters for the covert task targets, with inverted weights between the left and right targets, and alternating emphasis placed on Pz vs Oz for the up and down targets, respectively. The
overt templates are sufficiently uncorrelated with each other, while the overlapped templates are almost all identical, contributing to the relatively poor performance in that task. Despite distinct and somewhat uncorrelated templates for the covert task, performance is still very low, suggesting that there may not be enough consistency in single-cycle trials.
The spatial filters and templates for S1 are presented in comparison to show that not all subjects had clean results. Here, CCA has identified that the O1 channel was bad, as it is weighted near zero across all three tasks. Indeed, analysis of S1’s channel variance showed O1 to be quite noisy compared to the others channels.
Figure 2.11. Training results using CCA for subject S3.
The spatial filters (left), resultant templates (center), and template correlations (right) produced using CCA for subject S3. The color scale ranges from -1 (dark blue) to 0 (light gray) to 1 (dark red). Templates are offset vertically to align with their associated target weights.
Figure 2.12. Training results using CCA for subject S1.
2.3.4. Confidence Metrics
Based on the previous analysis, CCA was chosen as the spatial filter to evaluate further for confidence thresholding. Only the overt task produced any distinct differences between the four metrics evaluated (Figure 2.13). The most discriminable metric is “winner”, which reaffirms pilot study results that suggest the score of the predicted class alone is sufficient for the correlation-based classifier. There is also a noticeable difference in relative alpha band power, with good trials exhibiting greater alpha suppression indicating users were more attentive during these trials.
None of the metrics produced significant differences between good and bad trials in the covert or overlapped tasks. This suggests that, unsurprisingly, thresholding based on the classifier score will only benefit classifiers that are already operating at a reasonably high level of accuracy.
Figure 2.13. Comparison of potential confidence threshold metrics.
The dark violin plots reflect the correctly classified (true) trials across all subjects while the light plots are from the incorrect (false) trials. As overlapped trials only have two evaluated templates, z-scores were always equal to 1.
2.3.5. Adaptive Online Performance
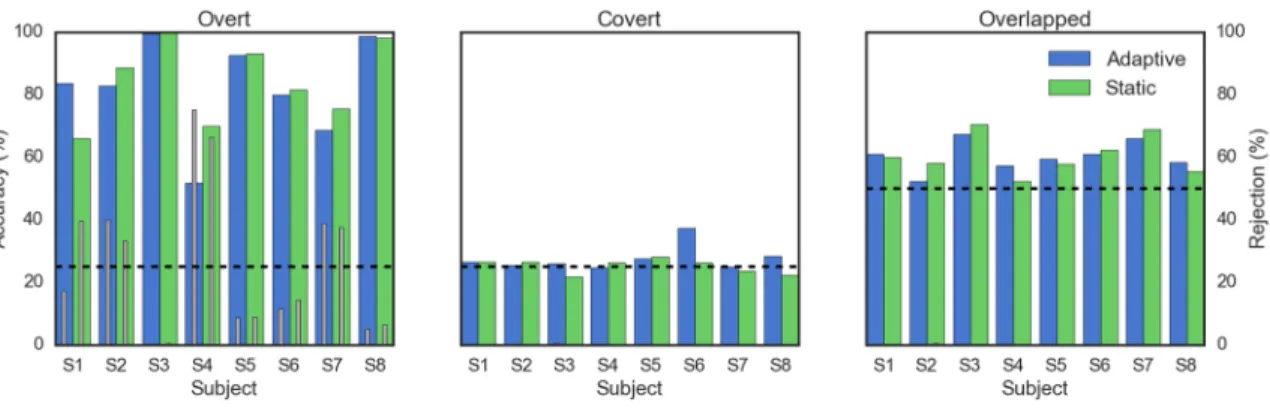
Online performance for adaptive and fixed 2DLLAP- and CCA-based decoders were evaluated (Figure 2.14 and Figure 2.15, respectively). All used a confidence threshold strategy of rejecting any trials with target correlation scores less than 0.3. The confidence threshold was only applied to the output of the overt task decoder, as earlier analysis indicated that it would have little to no beneficial effect on the covert and overlapped tasks.
Figure 2.14. Online c-VEP classification accuracies using 2DLLAP.
The online classification accuracies across the three tasks were computed for both the adaptive templates (green) and static templates (orange) ignoring null class trials. The percent of trials rejected for failing the confidence threshold test for each method is indicated in gray. Accuracy due to chance for each task is indicated by the dashed lines.
Figure 2.15. Online c-VEP classification accuracies using CCA.
Subjects S3 and S8 both performed exceptionally well on the overt task, so the choice of method or type of decoder had little effect. Generally, CCA demonstrated equal or better accuracy with significantly fewer rejected trials. S4 had a significant improvement, both in accuracy and reduction of rejected trials. S1, on the other hand, actually showed a significant decline in performance in the adaptive CCA decoder –
adaptive 2DLLAP was the best, followed by no difference in either static 2DLLAP or CCA, followed by adaptive CCA.
Covert task performance was flat at chance levels across the board for all decoder configurations, with the exception of S6 using adaptive 2DLLAP. It was not enough to raise the performance to usability level, but it does suggest some consistency was found in the trials. Similarly, overlapped task performance did not see much difference between the decoders other than adaptive CCA for S3 and S6.
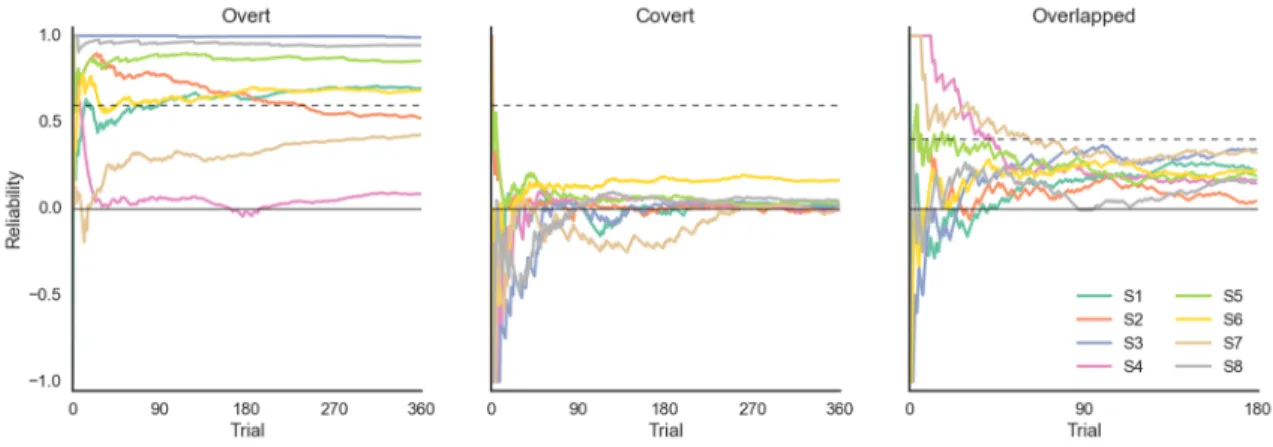
Reliability scores were computed and plotted over time for both adaptive 2DLLAP and CCA decoders as well (Figure 2.16 and 2.17, respectively). As neither covert nor overlapped tasks incorporated trial rejection, their reliability score was a scaled version of raw classification accuracy.
Figure 2.16. Reliability over time of adaptive 2DLLAP.
The reliability score was computed for each trial over all trials presented to the decoders. The dashed line corresponds to the scaled equivalent of the 70% usability threshold.
Figure 2.17. Reliability over time of adaptive CCA.
Using the reliability score over time, it is possible to see that S1’s CCA performance on the overt task seems to suffer a major hiccup around trial 120, which happens to correspond to the start of a new block of trials. S4’s 2DLLAP reliability on the overt task demonstrates how this analysis methods departs from just reporting classification and rejection rates. Using only classification accuracy, S4 would report 52% accuracy with a rejection rate of 75%. The reliability score indicates that this BCI would be no better than chance.
2.3.6. Cognitive Workload
The individual NASA-TLX components were averaged (Table 2.2) and the scaled cognitive workload scores were computed for each subject for each of the three tasks, with median scores of 33.00 (overt), 56.00 (covert), and 25.35 (overlapped). A Wilcoxon signed-rank test was performed on each pair of task responses. Cognitive workload experienced during the overt task was less than that during the covert task (T = 0, P =
0.01), while neither overt vs overlapped (T = 13, P = 0.87) nor covert vs overlapped (T = 6, P=0.09) were significantly different. Given the relatively small sample size, it is possible that significance between covert and overlapped task workload would be observed if more subjects were run.
The clear difference between overt and covert tasks can most likely be attributed to the added challenge of maintaining gaze fixation on one point while attending to the target. In addition to the more difficult task of attending to something peripherally instead of directly, healthy subjects must also suppress the desire to look directly at the target.
Overt Covert Overlapped Contribution
Mental 38.13 60.63 38.75 2.88 Physical 28.13 35.63 32.50 1.13 Temporal 35.63 40.00 34.38 1.38 Performance 25.63 40.00 29.38 4.25 Effort 46.25 68.75 45.00 4.13 Frustration 15.63 39.38 21.25 1.25
Table 2.2. Average scores of individual NASA-TLX factors. 2.4. Discussion
In this chapter, work toward implementation and evaluation of an adaptive c-VEP BCI for practical application was presented. Data was collected and analyzed from subjects participating in online-based gaze-dependent and gaze-independent tasks.
Subjects received relative qualitative feedback instead hit or miss indicators after trials to encourage them to find adapt their attentional strategies. Offline, common static spatial EEG filters were compared with the user- and target-adaptive CCA-based filters for use in the template matching decoder, with CCA broadly performing equal to or better than any other method. The only consistent contenders to CCA were the Large Laplacian filters, which tended to do slightly better for some users in the gaze-independent tasks. Next, a trial rejection mechanism based on confidence thresholding of the BCI classifier was developed. Four different metrics were considered, with the raw correlation coefficient of the predicted target showing the best discriminability between correct and incorrect trials. Third, adaptive template matching methods based on CCA and 2DLLAP were evaluated in simulated online BCI conditions, replaying the data collected from the subjects as if it were live. CCA again proved superior for overt tasks, but did not have a significant advantage over 2DLLAP in the gaze-independent tasks. Finally, a novel performance method, termed BCI reliability, was developed to provide a more meaningful representation of practical BCI performance when the BCI contains elements such as null results and adaptation.
2.4.1. Qualitative Online Feedback
It has been shown that offering only positive or qualitative feedback during online training trials can improve BCI performance, as subjects who feel like the BCI is working stay engaged with it. Both (Faller et al., 2012) and (Marchetti et al., 2013) provided “perfect feedback” to the users, letting them believe they were achieving 100% accuracy
in motor imagery and covert attention P300 tasks, respectively. In an adaptive SSVEP paradigm study (Fernandez-Vargas et al., 2013), users are given modulating auditory cues during training to indicate how well they are doing at the task. This work is similar in that it modulates visual cues designed in such a way as to be minimally distracting yet still salient. Unlike Fernandez-Vargas et al., the qualitative feedback is provided throughout training and testing sessions, rather than limited to just the training period. Also, by presenting a simple qualitative cue, i.e. relative brightness of a gradient image, the testing phase becomes more like a game than a test. This is especially important when collecting online environment trials of paradigms that may not have good working decoders at the time, such as the gaze-independent tasks. It provides a means to keep the subject engaged without discouraging them early on. While no formal irritation survey was conducted, informal queries about the tasks after the session found most subjects had little difficulty staying on task, with some even expressing confidence that they were getting better at the covert trials, despite the decoder itself operating effectively at chance levels.
2.4.2. Gaze-Dependent Task Performance
The performance of the overt task decoder was comparable to that reported by other gaze-dependent c-VEP studies. (Bin et al., 2011), (Spüler et al., 2012), and (Waytowich and Krusienski, 2015) all use phase-shifted versions of a single 63-bit m-sequence displayed at 60Hz and CCA-based spatial filters over 9, 32, and 16 channels, respectively. The first two demonstrated control of a 32-target speller, while the latter
investigated eight- and four-target setups arranged in an annulus. All reported average classification accuracies across all subjects in the high 90’s. (Nezamfar et al., 2011) also used a four-choice task with four distinct, 31-bit m-sequences displayed at 30Hz and was able to report offline accuracy from single channels in the high 90’s as well.
The slightly lower performances reported here, especially for subject S1, can be attributed to a few different sources of error. First and foremost was precise synchronization between the stimulus presentation and EEG data. Both the averaging method use to create templates and the linear correlation-based template matching decoder are highly susceptible to desynchronization. Attempts to correct these synchronization issues have all been in software thus far, which have partially addressed the problem but still seem to not fully compensate for it. Second, the EEG equipment used was generally effective but more susceptible to environmental noise given its portable design. Third, some subjects, such as S1, ended up having a bad channel which dramatically impacted the quality of the data. CCA was able to mitigate that to some extent but more advanced channel selection and weighting methods should be explored. Fourth, the environment the subjects performed the task in was intentionally not controlled for optimal visual BCI performance. Fluorescent overhead lights limited the full contrast available from the display while ambient noise and glossy, reflective display screens could be distracting. These sources of error largely stemmed from tradeoffs made in aiming for a BCI that could operate in more typical environments, rather than a highly controlled lab setting with stationary EEG equipment.
More fundamentally, the usage of four distinct m-sequence patterns instead of a single one that was phase-shifted introduced additional complexity into the decoding process that in turn also created greater chances for error. In phase-shifted c-VEP, subjects typically only need to attend to a single stimulus to build a template, then that template is phase shifted accordingly to match all the available targets. With just a single template to construct, training can progress faster or more training trials can be obtained in a fixed time frame. Likewise, determining phase offset against a single template signal can be more robust to slight temporal desynchronization (provided there is enough space between peak offsets), whereas this is not true with the current rolling correlation coefficient method here. The tradeoff with this approach is that testing of the sample signal could, theoretically, be evaluated continually producing even faster decoding times when using multiple m-sequences, whereas this is not possible with the phase-shifted approach.
2.4.3. Gaze-Independent Task Performance
There is only one published covert attention study based on c-VEP that we are aware of. In addition to the overt task mentioned above, (Waytowich and Krusienski, 2015) looked at near-foveal (1° visual angle away) and parafoveal (4° visual angle away)
target stimuli. Instead of having users fixate on a central point and attend to one of multiple equidistant targets, however, this study has the users attend to fixation points close to but not on top of a region of a large annulus-based stimulus. They were able to achieve group average accuracy above 80% for a trials based on 6 cycles (6.3s) and at