Research Online
Research Online
Theses : Honours Theses
2018
Using physiological measures to measure changes in cognitive
Using physiological measures to measure changes in cognitive
load associated with automaticity and transfer
load associated with automaticity and transfer
Joanna Verden Edith Cowan University
Follow this and additional works at: https://ro.ecu.edu.au/theses_hons
Part of the Psychology Commons
Recommended Citation Recommended Citation
Verden, J. (2018). Using physiological measures to measure changes in cognitive load associated with automaticity and transfer. https://ro.ecu.edu.au/theses_hons/1516
This Thesis is posted at Research Online. https://ro.ecu.edu.au/theses_hons/1516
Copyright
Warning
You
may
or
download
ONE
copy
of
this
document
for
the
purpose
of
your
own
research
or
study.
The
University
does
not
authorize
you
to
copy,
communicate
or
otherwise
make
available
electronically
to
any
other
person
any
copyright
material
contained
on
this
site.
You
are
reminded
of
the
following:
Copyright
owners
are
entitled
to
take
legal
action
against
persons
who
infringe
their
copyright.
A
reproduction
of
material
that
is
protected
by
copyright
may
be
a
copyright
infringement.
Where
the
reproduction
of
such
material
is
done
without
attribution
of
authorship,
with
false
attribution
of
authorship
or
the
authorship
is
treated
in
a
derogatory
manner,
this
may
be
a
breach
of
the
author’s
moral
rights
contained
in
Part
IX
of
the
Copyright
Act
1968
(Cth).
Courts
have
the
power
to
impose
a
wide
range
of
civil
and
criminal
sanctions
for
infringement
of
copyright,
infringement
of
moral
rights
and
other
offences
under
the
Copyright
Act
1968
(Cth).
Higher
penalties
may
apply,
and
higher
damages
may
be
awarded,
for
offences
and
infringements
involving
the
conversion
of
material
Using Physiological Measures to Measure Changes in Cognitive Load Associated with Automaticity and Transfer
Joanna Verden
A Report Submitted in Partial Fulfilment of the Requirements for the Award of Bachelor of Arts Honours, School of Arts and Humanities,
Edith Cowan University. Submitted October 2017.
I declare that this written assignment is my own work and does not include:
(i) Material from published sources used without proper acknowledgement; or
(ii) Material copied from the work of other students.
Signature:
Using Physiological Measures to Measure Changes in Cognitive Load Associated with Automaticity and Transfer
This study investigated the ability of two physiological measures, galvanic skin response and heat flux, to reflect changes in cognitive load using a variation of the dot counting task developed by Lassaline and Logan (1993). Concurrently, the robustness of the dual processing theory of automaticity was evaluated via disruption. The utilised task was designed to create a shift from controlled to automatic processing via practice, followed by a return to controlled processing via the introduction of a 6-digit memory recognition task designed to increase working-memory load and disrupt automaticity. As reaction time has previously been demonstrated to be a reliable performance measure of cognitive load, it was expected that there would be a positive relationship between reaction time, heat flux and galvanic skin response. The results found the expected pattern for reaction time, with an increase seen at the introduction of the memory task. Group results suggested automaticity was disrupted at this point, but analysis of individual data suggested automaticity endured for the majority of participants despite the contextual change in the task. This finding provides support for Instance Theory (Logan, 1988). The expected correlation between reaction time and galvanic skin response was not seen. Reductions in reaction time due to practice were correlated with reductions in heat flux due to practice, however, the expected increase at the introduction of the memory task was not seen. Whilst neither physiological measure was found to demonstrate an increase in cognitive load in this experiment, a task that was more cognitively challenging than the 6-digit memory recognition task may have produced more substantial results.
Author: Joanna Verden Supervisor: Professor Craig Speelman
Copyright and Access Declaration
I certify that this thesis does not, to the best of my knowledge and belief:
(i) incorporate without acknowledgement any material previously submitted for a degree or diploma in any institution of higher education;
(ii) contain any material previously published or written by another person except where due reference is made in the text; or
(iii) contain any defamatory material.
Signed:
Acknowledgements
I would like to thank my supervisor, Professor Craig Speelman for his support and guidance throughout this project and Katrina Muller-Townsend for her work preparing the SuperLab software. I would also like to thank my husband and children for their patience and support during the last year. Lastly, I would like to thank my research participants, without whom this project would not have been possible.
Table of Contents
List of Figures ... viii
List of Appendices ... ix
Using Physiological Measures to Measure Changes in Cognitive Load Associated with Automaticity and Transfer ... 1
Cognitive Load Theory (CLT) ... 2
Dual Processing Theories ... 3
Logan’s Instance Theory ... 5
Anderson’s Adaptive Control of Thought (ACT) Theory ... 5
Skill Transfer ... 6
Individual Differences ... 7
Cognitive Load Measurement ... 8
Galvanic Skin Response ... 8
GSR and Cognitive Load ... 9
Heat Flux ... 10
HF and Cognitive Load ... 11
The Current Study ... 11
Method ... 13 Research Design ... 13 Participants ... 13 Materials ... 14 Procedure ... 16 Results ... 18 Accuracy... 18 Performance ... 18 Automaticity ... 19
Individual Automaticity Results ... 20
RT/GSR/HF Correlation ... 21
ANOVA ... 22
Reaction Time... 22
Galvanic skin response. ... 23
Heat flux. ... 23
Variation in GSR ... 24
Discussion ... 28
Reaction Time and Automaticity ... 30
Galvanic Skin Response and Cognitive Load ... 32
Heat Flux and Cognitive Load ... 35
Future Research ... 36
Summary and Conclusion ... 37
List of Figures
Figure 1. Visual representation of CLT construct of cognitive load. ... 3
Figure 2. Expected pattern of results for RT, HF and GSR ... 13
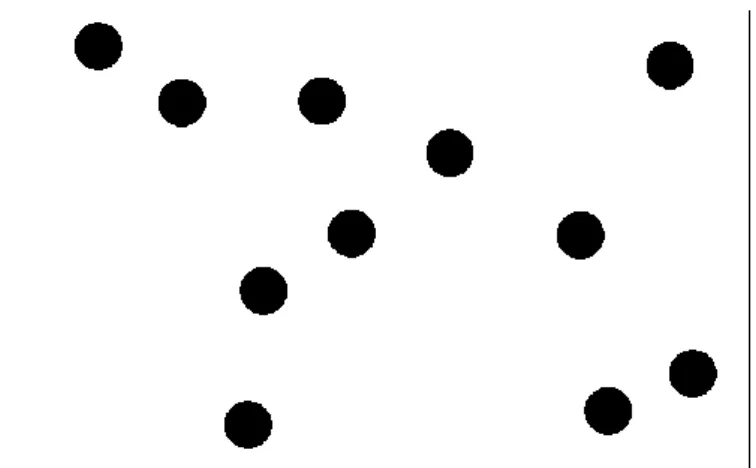
Figure 3. Example of 11 dot image ... 15
Figure 4. Response pad button layout ... 15
Figure 5. SenseWear Pro 3 Armband used to collect physiological data ... 16
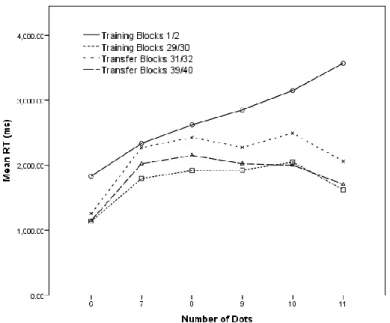
Figure 6. Mean response time as a function of number of dots for each block pairing ... 19
Figure 7. Mean reaction time per phase.. ... 24
Figure 9. Mean heat flux per phase.. ... 24
Figure 8. Mean galvanic skin response per phase... 24
Figure 10. GSR variance by participant during Training Block 1.. ... 25
Figure 11. GSR variance by participant during Training Block 30.. ... 25
Figure 12. GSR variance by participant during Transfer Block 31. ... 26
Figure 13. GSR variance by participant during Transfer Block 40. ... 26
Figure 14. Heat flux variance by participant during Training Block 1. ... 27
Figure 15. Heat flux variance by participant during Training Block 30. ... 27
Figure 16. Heat flux variance by participant during Transfer Block 31. ... 28
Figure 17. Heat flux variance by participant during Transfer Block 40.. ... 28
Figure 18. Example of high-to-low GSR Pattern (Participant 21). ... 38
List of Appendices
Appendix A: ECU Undergraduate Research Participation Scheme: Standard Operating
Procedures………46
Appendix B: Dot Image Sets……….………...48
Appendix C: Recruitment of Participants………52
Appendix D: Information Letter to Participants………...53
Appendix E: Participant Consent Form………...55
Using Physiological Measures to Measure Changes in Cognitive Load Associated with Automaticity and Transfer
It is generally accepted that human working-memory (also known as short-term memory) has a limited capacity, with historical research suggesting we can only process seven to nine items or chunks of information at any one time (Miller, 1956). This limitation has implications for how we process information and learn new skills (Kirschner, 2002; Paas & Van Merriënboer, 1994; Paas, Tuovinen, Tabbers & Van Gerven, 2003). Various theories of human cognition suggest we have two distinct ways of processing information (Anderson, 1994; Logan, 1988; Paas et al., 2003; Schneider & Shiffrin, 1977; Shiffrin & Schneider 1977; Sweller, 1988). When a task is unfamiliar, our method of processing is slow and controlled, requires sustained attention and utilises a large amount of working-memory capacity
(Schneider & Shiffrin, 1977; Shiffrin & Schneider 1977; Sweller, 1988). With sufficient practice at a task we can switch to a more automatic style of processing that requires less attention and less working-memory capacity, but is inflexible and uncontrolled (Schneider & Shiffrin, 1977; Shiffrin & Schneider 1977). Automatic processing (or automaticity) is thought to assist learning by allowing basic skills to be executed without constant attention, freeing up working-memory capacity for more complex task elements (Logan, 1988; Paas et al., 2003; Schneider & Shiffrin, 1977; Shiffrin & Schneider 1977; Speelman & Muller-Townsend, 2015; Sweller, 1988).
The current study adds to the cognitive psychology literature by investigating the development of automatic processing, and transfer of obtained skills, using a variation of the dot counting task described by Lassaline and Logan (1993). Concurrently, two physiological measures of cognitive load were investigated, in an attempt to ascertain whether the
achievement of automaticity and task transfer were observable via physiological changes on the surface of the skin. An objective, valid and reliable measure of cognitive load would have
useful applications in the fields of cognitive psychology, educational design and human computer interaction.
Cognitive Load Theory (CLT)
Cognitive Load Theory (CLT) (Paas & Van Merriënboer, 1994; Sweller, 1988) provides a comprehensive breakdown of the factors that affect human information processing and can potentially lead to cognitive overload and inattention. Proponents of the theory suggest a better understanding of the human memory system can lead to the design of more effective educational methods (Paas et al., 2003). Analogous to automatic processing, one key component of CLT is the construction and automation of mental schemas, which lead to more effective information processing by freeing up cognitive space to focus on new task elements (Paas et al., 2003).
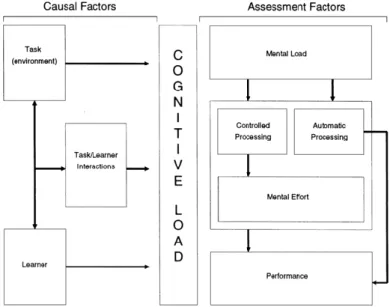
CLT theorists view the construct as multifactorial, with causal factors consisting of task specific elements, external environmental factors and individual differences in
personality, cognitive capability and prior knowledge of the given task. An interaction between these elements can affect the level of cognitive load imposed at any given moment; for example, the participant’s mood, room temperature, or boredom with an overly familiar task can all affect performance (Paas & Merriënboer, 1994) (Figure 1). The assessment of cognitive load is a significant area of research, as learning potential is thought to follow the Yerkes-Dodson law U curve (Tiegan, 1994), suggesting learning may cease if cognitive load is too low or too high (Paas, Renkl & Sweller, 2004). Therefore, being able to determine how much mental effort an individual is expending on a task at any given moment would allow for the design of educational and instructional systems that maximise learning potential by mitigating cognitive overload or underload (Kirschner, 2002; Paas et al., 2003).
Within CLT, assessment factors are comprised of the mental load placed on the individual by the task or environmental factors, the total amount of mental effort extended by
the individual to complete the task, and the interaction between the two (Paas & Merriënboer, 1994). Mental load, in turn is comprised of controlled and automatic processing. CLT
researchers suggest that once a process becomes familiar enough, multiple task elements can be chunked together as a mental schema that is then held in long-term memory as an
automated rule. This allows elements of a task to be performed without the use of working-memory and bypasses the need for additional mental effort to be expended (Kirschner, 2002).
Dual Processing Theories
Similar to the automation of mental schemas in CLT, proponents of controlled versus automatic processing theories suggest we have two distinct ways of processing information (Schneider & Shiffrin, 1977; Shiffrin & Schneider 1977). The idea was first postulated by William James in the 1890s and has been extensively researched by multiple authors over the last 120 years (Moors & De Houwer, 2006; Schneider & Chein, 2003). Controlled processing is our default way of processing information, it involves directing our attention to a task and methodically working through the steps necessary to achieve the required outcome. For
Figure 1. Visual representation of CLT construct of cognitive load (Paas & Van Merriënboer, 1994).
example, when learning addition, a child will see the sum 2 + 2 and methodically count on their fingers to reach the correct answer of 4; this process requires the child’s full attention and any distraction may cause error. Due to these high attentional requirements, controlled processing utilises working-memory capacity and is thought to represent a high cognitive load (Schneider & Shiffrin, 1977). In contrast, automatic processing, also known as
automaticity, is defined as the automation of a response based on a particular, familiar, input sequence (Schneider & Shiffrin, 1977). This response requires little, if any, attention, with the required output being held directly in long-term memory as an automated rule. For example, once the child becomes more familiar with addition, seeing 2 + 2 causes the number 4 to come instantly to mind, without the need for any mental effort, attention or methodical step-by-step processing. Research suggests automatic processing is fast, effortless, autonomous and outside of conscious control (Logan, 1988; Schneider & Shiffrin, 1977; Shiffrin & Schneider 1977).
There are several contrasting views on the mechanisms that lead to automaticity, with some theorists even suggesting it is not a separate form of processing but instead represents the presence or absence of several features along a continuum (Moors & De Houwer, 2006). Moors and De Houwer (2006) provide a comprehensive explanation of this approach, suggesting the concept of automatic processing should be deconstructed into separate
component features and independent investigations conducted to examine these components. Overall, the two main theoretical approaches to automaticity can be categorised as the direct retrieval from long-term memory approach, as postulated by Logan (1988) and the improved algorithm approach, suggested by Anderson (1992) (Moors & De Houwer, 2006). Both theories agree that the transition to automatic processing requires extensive practice at a task, but disagree on the memory processes involved in achieving automaticity (Moors & De Houwer, 2006). The two theories are discussed in detail below.
Logan’s Instance Theory
Logan’s (1988) Instance Theory suggests automatic processing develops due to ‘snapshot’ instances being stored in memory through practice. These instances are mental representations of the stimulus presented, the goal of processing, the response provided, and the outcome of that response. Initial performance of a task follows a step-by-step algorithm. For example, in the dot counting task, to ascertain the number of dots in an image, each dot is counted sequentially. After encountering the same image (or instance) repeatedly, and with feedback provided regarding the success of a response, the pattern of dots is stored in memory and the correct number recalled instantly without the need to count each dot. Lassaline and Logan (1993) demonstrated that reaction time (RT) in the dot counting task is initially a function of numerosity (i.e., it takes longer to count to 11 than 6) but when
automaticity develops (i.e. sufficient practice has successfully created stored memory instances for each image), RT is no longer associated with the number of dots presented. Lassaline and Logan (1993) demonstrated that extensive practice is usually required to facilitate instant recognition of the dot images and to create the switch to automatic
processing; finding four sessions of training to be effective (1920 trials, 64 repetitions of each dot image). This effect has since been replicated in numerous other experiments (Speelman & Muller-Townsend, 2015).
Anderson’s Adaptive Control of Thought (ACT) Theory
Anderson (1992) takes an alternate view to Logan (1988) suggesting automaticity develops due to improvements in the speed and efficiency of the procedural algorithm used to execute a task. The ACT theory (Anderson, 1992) divides human memory into three distinct sections, two separate forms of long-term memory, declarative (factual knowledge) and procedural (how to achieve an outcome), and working-memory (or short-term memory), which is seen as the gateway for sensory information to reach longer-term memory. Anderson
(1994) suggests that human information processing follows procedural algorithms, which take the form of ‘If’ (declarative outcome goal), ‘Then’ (procedural steps required) rules. For example, using the addition analogy of 2 + 2 = 4, ‘If’ the goal is to add the first two numbers together, ‘Then’ follow the procedural steps to reach the answer of 4. Initially, the procedural process will involve more steps; count forward 1, 2, for the first number, then count forward 3, 4 for the second number, say 4. As the procedure becomes strengthened in long-term memory the steps are reduced to simply; say 4. The reduction of these procedural steps is what leads to faster and more efficient processing, or automaticity (Anderson, 1994).
Skill Transfer
Whilst the two theories agree that extensive practice of a task is required to reach automaticity, they differ in their views regarding the type of practice required and whether the acquired skills can be transferred to a similar, but slightly novel task (Anderson, 1992; Lassaline & Logan, 1993; Moors & De Houwer, 2006). ACT theory (Anderson, 1992) suggests procedural practice (regardless of data content) will strengthen the long-term memory algorithm, allowing for transfer of the acquired skill to different data. For example, once a child is proficient at addition they can easily add 3 + 3, as well as 2 + 2. ACT theory suggests that the addition algorithm has been stored, strengthened and simplified and can be easily applied to the new data (Anderson, 1992).
Alternatively, Instance Theory (Logan, 1988) suggests practice using consistent data is required to reach automaticity, with skill transfer to new data being limited due to the specificity of the stored memory instances (Lassaline & Logan, 1993). Lassaline and Logan (1993) conducted a series of investigations using variations of the dot counting task, in an attempt to ascertain which data elements were subject to skill transfer. As per earlier
particularly visual spatial changes, caused performance to decline to pre-training levels, suggesting skill transfer to new data was extremely limited (Lassaline & Logan, 1993).
Speelman and Kirsner (1997) conducted a direct comparison of the two theories using a syllogism task. Performance was found to improve despite a lack of item repetition,
providing support for the ACT theory. However, the authors concluded that the nature of a specific task may affect the cognitive strategy used (Speelman & Kirsner, 1997). In a later study, Speelman, Forbes and Giesen (2011) investigated performance differences in the training and transfer phases of a multiplication task, attempting to predict transfer
performance using the power law of learning function (whereby high gains are seen early on in practice but reduce as practice continues) based on performance in the training phase. The authors found that a minor contextual change in some tasks caused a large disruption in transfer phase performance, suggesting automaticity may be more fragile than both ACT theory and Instance Theory suggest (Speelman et al., 2011). Further investigation into the robustness of both automaticity and the transfer of obtained skills is therefore a useful area of research.
Individual Differences
Speelman and McGann (2013) raised an important issue for psychology researchers by highlighting the fallibility of relying on the mean of group data to quantify psychological findings. It was suggested that averaging group findings can provide results that do not accurately represent individual performance, and in some cases, can even suggest the opposite effect (Speelman & McGann, 2013). Speelman and Muller-Townsend (2015) conducted a replication of the dot counting experiments conducted by Lassaline and Logan (1993) to examine whether the ‘mean issue’ was at play in automaticity research. Speelman and Muller-Townsend found that whilst the group results matched those reported in the earlier experiments, there were large individual differences in the development of
automaticity. A large number of participants did not appear to demonstrate a transition to automatic processing. These findings highlight the importance of considering individual data when examining psychological research findings (Speelman & McGann, 2013; Speelman & Muller-Townsend, 2015). The current study followed this approach in the analysis of results.
Cognitive Load Measurement
Mental effort (see Figure 1) is the CLT construct element thought to represent actual measurable cognitive load (Paas et al., 2003). There are currently three types of cognitive load measurement discussed in the literature (Debue & van de Leemput, 2010; Ikehara & Crosby, 2005; Paas et al., 2010); self-report, whereby participants report back on the amount of subjective mental effort expended on a task, or use a Likert style rating scale (Paas & Van Merriënboer, 1994); performance measures, most prominently the dual-task method whereby performance on a primary task is interrupted by a secondary task (Gwizdka, 2010); and physiological measures including heart rate (Mehler, Reimer, Coughlin & Dusek, 2009), eye activity (Beatty, 1982; Debue & van de Leemput, 2010; Ikehara & Crosby, 2005;
Meghanathan, van Leeuwen & Nikolaev, 2015), facial skin temperature (Or & Duffy, 2007), EEG (Electroencephalography) (Antonenko, Paas, Grabner & van Gog, 2010; Ferreira et al., 2014), functional near-infrared spectroscopy (fNIRS) (Fishburn, Norr, Medvedev and Vaidya, 2014), galvanic skin response (Mehler et al., 2009; Nourbakhsh, Wang, Chen & Calvo, 2012; Shi, Choi, Ruiz, Chen & Taib, 2007; Wilson, 2002) and heat flux (Haapalainen, Kim, Forlizzi & Dey, 2010; Pluyter, Rutkowski & Jakimowicz, 2013).
Galvanic Skin Response
Galvanic skin response (GSR), also known as electrodermal activity or skin conductance, is an autonomic bodily response whereby the electrical conductance of the epidermal layer changes in response to physical activity or emotional/cognitive arousal (Liden et al., 2012). When we increase our level of activity or are aroused, our sweat glands
are triggered and moisture is secreted; changes in the positive and negative ions in this moisture cause electricity to become more (or less) easily conducted (iMotions, 2017). Measurement tools, such as the SenseWear Pro 3 armband, detect these changes in electrical conductance via two electrode sensors placed directly onto the skin, a low level electrical current flows continuously between the two sensors and changes in the level of conductance are recorded and an output provided (Liden et al., 2012). Electrical conductance is generally measured in siemens (S) or micro-siemens (µS) (one-millionth of a siemens) and is also known as Mho or micro-Mho (iMotions, 2017). GSR has a long history as a measure of psychophysiology, with the discovery being jointly credited to two different scientists in the 1800s, Féré and Tarchanoff, who both linked skin response to emotional arousal (Boucsein, 2012). Since then, GSR has been widely researched as a potential measure of general psychophysiology, as a biological indicator of personality traits, and has been studied in association with various forms of psychopathology; an extensive account of this research is provided by Boucsein (2012).
GSR and Cognitive Load
One area of research focuses on the potential of GSR as a measure of cognitive load, with mixed results reported in the literature. Wilson (2002) found GSR to be correlated with the increased cognitive load associated with piloting an aircraft through a take-off, landing and a near miss scenario. Shi and colleagues (2007) used GSR as a benchmark measure to assess the difficulty of a mixed-modal computer interface program and concluded that GSR showed promise as a measure of cognitive load following correlation with self-report data. Engstrom, Johansson and Östlund (2005) found a weak effect of increased cognitive load on GSR in a driving simulation/secondary cognitive task study. In a similar experiment, Mehler and associates (2009) found a significant increase in GSR as cognitive task difficulty
differences were found, suggesting that combining measures may provide the best results when attempting to assess cognitive load physiologically (Mehler et al., 2009). Nourbakhsh and colleagues (2012) came to similar conclusions following a study which captured data from both reading and arithmetic tasks, concluding that assessment of individual data produced clearer results. Ikehara and Crosby (2005) found contrary results, with GSR
decreasing as task difficulty increased, the authors concluded that in their study the easy task may have been too easy, leading to boredom and a stress response. However, the sample size was small (N = 13) so individual differences could have affected the results. Overall, GSR shows some promise as a potential measure of cognitive load, particularly when combined with other physiological measures.
Heat Flux
Heat flux is the flow of heat from a surface area (such as the skin) to the surrounding atmosphere. It is caused by a temperature difference, when the outside temperature is cooler than the surface temperature heat will flow out. Heat can dissipate in three different ways, via a solid area (e.g. when holding a hot cup of coffee) known as conduction; via a liquid or gas (e.g. feeling cold when getting into a cool swimming pool) known as heat convection; or via electromagnetic waves (e.g. feeling heat when standing in front of a fire) known as radiation (Greenteg, n.d.). Heat flux is measured in watts per meter squared (W/m2). Sensors that collect physiological heat response data typically work via the Seebeck effect, whereby heat from the skin passes through a sensor with a thermogenic layer and a voltage signal is produced, which is then converted into W/m2 and an output provided (Greenteg, n.d.). Physiologically, when the sympathetic nervous system is activated due to emotion, mental strain or effort, there is a reduction in blood flow to the extremities via vasoconstriction in the peripheral capillary system. This reaction is thought to lead to measurable changes in heat flux through the surface of the skin as the rate of blood flow changes (Pluyter et al., 2013).
HF and Cognitive Load
Despite its potential as a measure of cognitive load and the availability of affordable sensors, HF has received less attention in the literature than GSR. Haapalainen and
colleagues (2010) used a number of sensor devices to investigate several physiological
measures of cognitive load, including HF, GSR, ECG, heart rate variability and pupil activity. The authors found HF and ECG to be the most reliable measures. However, similar to
Nourbakhsh and colleagues (2012), Haapalainen et al. concluded that individual data examination produced the most reliable results. In a follow up study, Ferreira et al. (2014) used multiple sensors to measure the cognitive load of both young and old adults, finding differing results, with EEG and breathing rate showing most reliability. However, the authors concluded that the shorter time frame in the second experiment (seconds as opposed to minutes) may not have been a long enough time period to show significant changes in HF readings (Ferreira et al., 2014). Pluyter and colleagues (2013) assessed mental strain in 21 medical interns taking part in a simulated surgery scenario and found that heat flux, combined with frontal head temperature, was a reliable measure of mental effort when correlated with self-report data. No significant results were found for GSR in this study. Overall, the ease of HF measurement via affordable sensor devices suggests further investigation into its potential as a measure of cognitive load is worthwhile.
The Current Study
The current study was designed to add to the literature on CLT, Instance Theory and ACT theory by investigating the attainment of automatic processing and the transfer of those obtained skills to a task with an additional memory element. Concurrently, the reliability and validity of the two aforementioned physiological measures of cognitive load, GSR and HF, were assessed. The study utilised a variation of the dot counting task described by Lassaline and Logan (1993). The task demonstrates a shift from controlled to automatic processing as a
result of practice (Lassaline & Logan, 1993). In this project, participants practiced the dot counting task. It was expected that during the initial (Training) phase they would exhibit a transition from controlled to automatic processing as per previous experiments (Lassaline & Logan, 1993; Logan, 1988; Speelman & Muller-Townsend, 2015), with some individual differences expected (Speelman & Muller-Townsend, 2015). A memory task was then added in a subsequent (Transfer) phase, which was expected to interrupt automaticity and produce a return to controlled processing via disruption (Speelman et al., 2011). The memory task was designed to increase the demand on working-memory, and therefore cognitive load (Sweller, 1988). The shift back to controlled processing was expected to be measurable via an increase in reaction time as participants returned to an algorithmic counting strategy (Lassaline & Logan, 1993).
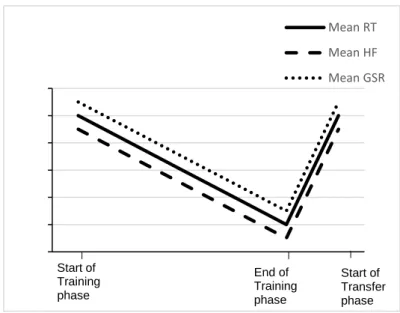
Previous research suggests both GSR (Mehler et al., 2009; Nourbakhsh et al., 2012; Shi et al., 2007; Wilson, 2002) and HF (Haapalainen et al., 2010; Pluyter et al., 2013) show promise as potential measures of cognitive load, with both variables increasing in value as cognitive load increases. It was therefore hypothesized that there would be a positive relationship between RT, HF and GSR; all three measures were expected to be initially elevated at the beginning of the Training phase, show a reduction at the end of the Training phase (as automaticity occurred), followed by a return to an elevated level at the start of the Transfer phase (see Figure 2.).
Method Research Design
The study was a two-phase, within group, quantitative design examining correlations between RT, GSR and HF. The independent variables were the number of dots presented (6-11), practice (number of blocks of trials), and phase (Training vs. Transfer). The dependent variables were RT, GSR and HF.
Participants
Approval for this study was granted by the Edith Cowan University School of Psychology and Social Science (SPSS) Ethics Sub-committee. The participants were 30 individuals, 24 females and 6 males, and their ages ranged from 18 to 50 years (M age = 34.7 years, SD = 11.21). All participants could demonstrate basic numeracy skills (the ability to count to 20) and had normal or corrected-to-normal vision. The majority of participants (21/30) were recruited via the ECU Undergraduate Research Participation Scheme (Appendix A). Undergraduate students completing either PSY1102 Research Methods in Psychology 1 or PSY2202 Research Methods in Psychology 2 during the first semester of 2017 were eligible to participate. Students who opted to participate in the study were awarded 1 credit
Mean RT Mean HF Mean GSR Start of Training phase
Figure 2. Expected pattern of results for RT, HF and GSR
End of Training phase Start of Transfer phase
point for one hour’s participation, this credit point equated to 1% of their final unit grade and was awarded by the researcher on completion of participation via the SONA administration system. One additional participant was unable to complete the study within the available timeframe. This participant’s data was not included in the study due to being incomplete, however, the participant was rewarded for their time via allocation of 1 credit point. The remaining 9 participants were recruited via word of mouth and were known socially by the researcher. These participants received no reward for participation in the study.
Materials
Two sets of dot pattern images consisting of between 6-11 dots were presented (see Figure 3). Each set contained one dot image per number, totalling six images per set. Set one was used in the practice phase and set two (Appendix B) was used in the Training and Transfer phases. Cedrus-SuperLab 5.0 software and a Cedrus RB-840 USB response pad connected to a laptop computer was used to present the images and to record participant responses. The response pad consisted of two rows of labelled buttons (see Figure 4). Either “Next” button was used to proceed to the next trial, whereas “Yes” or “No” was required to respond to the secondary task in the Transfer phase (see Procedure section for more detail). Reaction time and accuracy data was provided via a .txt output file from the
Cedrus-SuperLab 5.0 software and analysed using Microsoft Excel.
A SenseWear Pro 3 armband (see Figure 5) and SenseWear Prof 8.1 software were used to measure and record GSR and HF. The SenseWear Pro 3 armband is a wireless body monitor and activity tracker which is worn on the upper part of the arm in contact with the skin. The device is similar to a recreational Fitbit® but contains a number of additional sensors to monitor different types of energy expenditure, including heat flux (HF), skin temperature and galvanic skin response (GSR). The device also has an optional chest strap heart rate monitor which was not available for use in this study (Liden et al., 2012). The two
physiological measures considered in this experiment were GSR and HF. GSR was measured via two stainless steel electrodes connected to a circuit that recorded electrical conductivity. The output was provided in micro-siemens (µS). HF was measured via heat convection using a sensor made of a very low thermally resistant material containing a thermocouple array designed to monitor subtle temperature changes on the surface of the skin (Liden et al, 2012). The output was provided in watts per square metre (W/m2). Physiological data was provided in a .xls file from the SenseWear Prof 8.1 software and analysed using Microsoft Excel.
Figure 4. Response pad button layout
Procedure
Participants were recruited via a notice on the ECU Undergraduate Research
Participation Scheme (SONA) system and the researcher’s social media accounts (Appendix C). On arrival at the laboratory, participants were given an information letter (Appendix D) and asked to sign a consent form (Appendix E). The SenseWear Pro 3 Armband was placed on the participant’s upper left arm in contact with the skin. The initiation tone typically sounded within 1-5 minutes to confirm the armband was ready to record data. If the armband failed to initiate after 1 minute the area was lightly moistened with water to improve sensor contact. On no occasion did the armband fail to initiate. Initial verbal instructions were provided to the participant, the researcher then left the room and all further instructions were provided via the computer monitor (see Appendix F).
Each session lasted approximately 60 minutes. There were three phases in the experiment: 1. Practice phase; 2. Training phase; and, 3. Transfer phase. The dot counting task featured in all three phases and had the same basic structure throughout the experiment. On each trial, a dot image appeared and participants were asked to quickly and accurately indicate the number of dots presented using the numbered keypad; a feedback message stating correct/incorrect then appeared until a “Next” button was pressed. During the Transfer phase, each trial had an additional feature: A message appeared informing participants that a
number would appear on the next screen, they were instructed to attempt to remember the number before proceeding to the dot image. The new memory item, a 6-digit number (e.g. 467532) was then presented on each trial prior to each dot image. The dot image then appeared and a response was required to indicate the number of dots presented via the keypad. After responding, participants were presented with a recognition cue, a second 6-digit number, and asked to indicate whether or not it matched the first number. On half the trials, the same 6-digit number was presented as a recognition cue, requiring a “Yes” response (i.e., the recognition cue is the same as the memory item). On the other half of the trials, a new 6-digit number was presented, requiring a “No” response (i.e., the recognition cue is not the same as the memory item). The false recognition cues differed from the original memory item by one digit (e.g., 468532), the placement of the differing digit within the number sequence was randomised. The presentation order of matching and non-matching recognition cues was also randomised.
The trials in the Training and Transfer phases were presented in blocks. In each block of trials, each dot image (6-11 dots) was presented three times, equating to 18 images per block. The order of presentation of items in a block was random. Participants were given the opportunity to rest between blocks. The practice phase (image set one) consisted of 6 trials; the Training phase (image set two) consisted of 30 blocks (540 trials); the Transfer phase (image set two) consisted of 10 blocks (180 trials).
Following completion of each session the SenseWear Pro 3 Armband was removed and cleaned using an alcohol swab. The armband data was downloaded via a USB connection to the SenseWear Prof 8.1 Software. A generic user profile was used for each participant which held height and weight constant, due to equipment constraints and the sensitive nature of personal body size information, this data was not collected from participants. The
categories) and age were recorded and the download profile adjusted for each participant to assist with accurate data representation. Following download the armband memory was cleared ready for the next participant.
Results Accuracy
Participant accuracy was examined for both the dot counting element of the task and the number recognition memory task. An 80% accuracy rate benchmark has been used in previous dot counting task studies to control for participants using a guessing, as opposed to counting, strategy (Speelman & Muller-Townsend, 2015). All participants maintained a mean accuracy above 80% for the dot counting task (range: 84.31% – 99.44%), therefore no
participant data was excluded from the analyses. Accuracy was lower for the memory task (range: 50.27% - 96.41%), but as this was a secondary task used to create an increase in cognitive load, no participant data was excluded due to low response accuracy.
Performance
To examine whether performance differed across the two main experimental phases (Training and Transfer), mean RT for each dot numerosity (6-11) for each participant (correct responses only) was calculated for blocks 1/2 (start of Training phase), blocks 29/30 (end of Training phase), blocks 31/32 (start of Transfer phase) and blocks 39/40 (end of Transfer phase) (see Figure 6). One participant had incorrect responses to the 11-dot image for each trial of blocks 29 and 30, therefore the RT of this participant for this stimulus in block 28 was utilised in place of the missing data.
Automaticity
To ascertain whether participants transitioned from a controlled processing strategy (i.e., counting the dots sequentially) to an automatic processing strategy (i.e., pattern recognition), the automaticity calculation suggested by Lassaline and Logan (1993) was utilised. Data were analysed using the Statistical Package for the Social Sciences (SPSS) v. 24. Regression lines were fitted to the RT data as a function of numerosity (Table 1.). The slopes of these lines were compared with a benchmark slope value of <100 ms/dot to indicate whether automaticity had been reached, as discussed by Speelman and Muller-Townsend (2015). The overall group results showed the expected pattern; RTs were initially a function of numerosity (i.e., it took longer to count to 11 than 6). By the end of the Training phase (30 blocks of practice) automaticity had been reached, with a slope value of 91.50 ms/dot. The introduction of the memory task at the Transfer phase caused RTs to increase and
automaticity appeared to have been interrupted because the slope of the regression line providing the best fit to the Transfer data in blocks 31 and 32 was 129.56 ms/dot. By the end of the Transfer phase the group results suggested a return to automaticity, with a slope value of 74.27 ms/dot.
Individual Automaticity Results
An examination of the data from each individual showed that 20 (66.67%)
participants met the criteria for automaticity by the end of the Training phase, and a further three had reached automaticity by the end of the Transfer phase (76.67% in total). Overall, six participants did not meet the automaticity criteria and one (participant 24) showed automaticity at the start of Training but their RTs increased as the experiment progressed. Only one participant showed the same pattern as the group result, with an interruption to automaticity at the introduction of the memory task. Most participants who reached
automaticity by the end of the Training phase (19/20, 95%) did not show an interruption to automaticity with the introduction of the Transfer phase.
Table 1.
Slopes of regression lines (ms/dot) fitted to RT data as a function of numerosity for each participant Participant Start of Training
Slope End of Training Slope Start of Transfer Slope End of Transfer Slope Automaticity (end of Training) Automaticity (end of Transfer) 1 378.37 (0.82) 5.16 (0.00) -266.61 (0.45) 36.15 (0.04) Y Y 2 450.09 (0.78) -32.84 (0.02) 67.75 (0.03) -46.55 (0.01) Y Y 3 191.00 (0.53) -25.43 (0.10) 1.20 (0.00) -17.03 (0.02) Y Y 4 318.15 (0.92) 482.04 (0.91) 549.51 (0.88) 356.18 (0.80) 5 315.54 (0.74) 33.65 (0.01) 137.82 (0.07) -40.53 (0.01) Y Y 6 142.24 (0.93) 194.62 (0.34) 303.09 (0.55) 66.72 (0.52) Y 7 249.63 (0.60) -9.52 (0.01) -22.70 (0.03) -127.10 (0.16) Y Y 8 190.21 (0.86) 46.01 (0.03) -59.41 (0.02) 3.65 (0.00) Y Y 9 292.57 (0.90) 123.46 (0.06) 126.11 (0.03) 52.44 (0.01) Y 10 253.73 (0.93) 290.67 (0.76) 294.15 (0.67) 43.60 (0.02) Y 11 351.60 (0.94) 497.16 (0.87) 306.96 (0.57) 329.50 (0.69) 12 389.14 (0.84) -2.60 (0.00) -35.15 (0.09) -40.21 (0.09) Y Y 13 484.88 (0.95) -179.29 (0.26) 42.67 (0.00) -263.29 (0.22) Y Y 14 359.51 (0.93) 571.28 (0.89) 857.00 (0.82) 432.31 (0.73) 15 154.51 (0.23) 0.55 (0.00) -29.58 (0.03) 51.02 (0.10) Y Y 16 733.32 (0.87) -216.53 (0.17) -70.28 (0.05) -234.60 (0.23) Y Y 17 373.25 (0.69) 277.01 (0.73) 690.46 (0.81) 224.72 (0.65) 18 339.95 (0.84) 26.33 (0.00) -7.58 (0.00) 6.52 (0.00) Y Y 19 258.45 (0.79) -107.24 (0.18) -93.42 (0.10) -77.37 (0.17) Y Y 20 611.84 (0.95) -24.32 (0.01) -92.66 (0.04) -99.20 (0.13) Y Y 21 288.23 (0.80) 33.28 (0.04) 61.53 (0.06) -19.05 (0.02) Y Y 22 308.48 (0.57) 42.41 (0.10) -47.69 (0.03 -7.04 (0.00) Y Y 23 454.38 (0.81) 24.07 (0.00) 82.77 (0.02) 194.53 (0.04) Y 24 96.04 (0.51) 402.61 (0.75) 884.05 (0.87) 1002.41 (0.76) 25 427.54 (0.89) -23.67 (0.02) -131.37 (0.06) -197.79 (0.14) Y Y 26 122.07 (0.41) -4.27 (0.00) -12.66 (0.01) -25.78 (0.02) Y Y 27 328.32 (0.91) 50.89 (0.03) -29.87 (0.01) 28.30 (0.02) Y Y 28 275.5 (0.95) 287.74 (0.82) 270.32 (0.69) 315.75 (0.79) 29 414.53 (0.95) 274.18 (0.59) 268.80 (0.89) 352.99 (0.77) 30 235.90 (0.85) -84.36 (0.13) -16.15 (0.00) -10.34 (0.01) Y Y
Note. Values in parentheses are r2 values for the regression lines. Automaticity criteria of regression line slope < 100 ms/dot
RT/GSR/HF Correlation
To test the hypothesis that RT, GSR and HF would show a positive relationship, physiological data from the SenseWear Pro 3 Armband was correlated with mean RT data at each block pairing of interest, blocks 1/2 (start of Training phase), blocks 29/30 (end of Training phase), blocks 31/32 (start of Transfer phase) and blocks 39/40 (end of Transfer phase), to ascertain whether any relationship existed. Preliminary analysis via the Shapiro-Wilk test suggested assumptions of normality were violated for some block pairings, therefore Kendall’s tau-b was utilised. The results are presented in Table 2. Kendall’s tau-b indicated that RT was not correlated with GSR or HF during any block pairing of the Training or Transfer phases. There were small positive correlations between GSR and HF during the Training phase (blocks 1/2 and 29/30) and at the introduction of the Transfer phase (block 31/32).
Table 2.
Results of Kendall’s tau-b correlations for RT, GSR and HF across each block pairing ofinterest
Start of Training (blocks 1/2) RT GSR HF
RT -.034 -.021
GSR -.034 .343**
HF -.021 -343**
End of Training (blocks 29/30)
RT -.034 .025
GSR -.034 .324*
HF .025 .324*
Start of Transfer (blocks 31/32)
RT .007 -.025
GSR .007 .278*
HF -.025 .278*
End of Transfer (blocks 39/40)
RT .080 .053
GSR .080 .126
HF .053 .126
Note. RT = Reaction Time, GSR = Galvanic Skin Response, HF = Heat Flux. * = statistically significant at p = <.05 level. ** = statistically significant at p = <.01 level.
Visual inspection of the RT/GSR/HF data (see Figures 7, 8, 9) appeared to suggest that all three measures reduced during the Training phase. An additional correlation analysis was therefore conducted to investigate whether the practice reductions between the start of
Training (blocks 1/2) and end of Training (blocks 29/30) for all three measures were correlated. Preliminary analysis via the Shapiro-Wilk test suggested the data was normally distributed. Several bivariate Pearson’s product moment correlation co-efficient analyses were then calculated. The correlation between RT and HF practice reductions was positive and moderate, r(28) = -.424, p < .05. The correlation between RT and GSR practice
reductions was not significant, r(28) = -.218, p = .247. The correlation between GSR and HF practice reductions was not significant, r(28) = .058, p = .759.
ANOVA
To test the hypothesis that RT, GSR and HF would be initially elevated at the start of the Training phase, show a reduction at the end of the Training phase, followed by a return to an elevated level at the start of the Transfer phase, a series of one-way repeated measures analyses of variance (ANOVA) were conducted. Despite the three dependent variables being used to attempt to measure the same psychological construct (cognitive load), preliminary testing suggested that a multivariate analysis of variance (MANOVA) would not be appropriate due to violations of the assumptions of linearity and multicollinearity, and the negligible correlations between the variables.
Reaction Time. The Shapiro-Wilks test was significant for all four block pairings at the p < .05 level, however, visual inspection of the box plots suggested approximate
normality and the ANOVA statistical test is considered robust to small departures from normality. There were outliers for three participants (4, 14 and 24) who all showed higher than average response times. Visual inspection of the results showed all three participants failed to show the expected automaticity pattern. No data was removed from the analysis.
Fmax was 1.4870, demonstrating homogeneity of variances. Mauchly’s test of sphericity was violated, therefore the Huynh-Feldt epsilon adjusted values were used. The ANOVA results showed that RT was significantly different across each phase (Training/Transfer), F (2.342,
67.922) = 40.247, p < .001, partial ƞ2 = .58. Pairwise comparisons and examination of means confirmed that, as hypothesised, RTs were high at the start of Training (blocks 1/2, M = 2711.71 ms, SD = 558.79, 95% CI [2503.06, 2920.37]) and reduced significantly by the end of Training (blocks 29/30, M = 1,728.36 ms, SD = 584.68, 95% CI [1510.03, 1946.68]). An increase was seen at the introduction of the Transfer phase (blocks 31/32, M = 2129.55 ms,
SD = 681.41, 95% CI [1875.10, 2383.99]) followed by a reduction at the end of the Transfer phase (blocks 39/40, M = 1840.72 ms, SD = 618.72, 95% CI [1609.68, 2071.75]) (see Figure 7).
Galvanic skin response. The Shapiro-Wilks test was significant for block pairings 1/2, 29/30 and 31/32 at the p < .05 level, however, visual inspection of the box plots suggested approximate normality and the ANOVA statistical test is considered robust to small departures from normality. There were outliers for two participants (25, 26) who
showed higher than average results during block pairings 29/30, 31/32 and 39/40, no data was removed from the analysis. Fmax was 8.9521, demonstrating homogeneity of variances. Mauchly’s test of sphericity was violated, therefore the Huynh-Feldt epsilon adjusted values were used. The ANOVA results showed that GSR was significantly different across each phase (Training/Transfer), F (1.491, 43.235) = 13.012, p < .001, partial ƞ2 = .31. Pairwise comparisons and examination of means showed that GSR declined from the start of the Training phase to the end of the Training phase (blocks 1/2 M = 0.39 µS, SD = 0.32, 95% CI [0.28, 0.51]; blocks 29/30 M = 0.25 µS, SD = 0.21, 95% CI [0.17, 0.33]). No increase was seen at the start of the Transfer phase (blocks 31/32, M = 0.23 µS, SD = 0.19, 95% CI [0.17, 0.31]) and further reductions were seen by the end of the experiment (blocks 39/40, M = 0.20 µS, SD = 0.11, 95% CI [0.16, 0.24]) (see Figure 8).
Heat flux. The Shapiro-Wilks test was significant for block pairings 31/32 and 39/40 at the p < .05 level, however, visual inspection of the box plots suggested approximate
normality and the ANOVA statistical test is considered robust to small departures from normality. There were outliers for one participant (25) who showed higher than average results during block pairings 29/30, 31/32 and 39/40. No data was removed from the analysis.
Fmax was 2.0567, demonstrating homogeneity of variances. Mauchly’s test of sphericity was violated, therefore the Huynh-Feldt epsilon adjusted values were used. The ANOVA results showed that HF was significantly different across each phase (Training/Transfer), F (1.307, 37.915) = 59.961, p < .001, partial ƞ2 = .67. Pairwise comparisons and examination of means showed that HF declined from the start of the Training phase to the end of the Training phase (blocks 1/2 M = 140.11 W/m2, SD = 30.47, 95% CI [128.73, 151.49]; blocks 29/30 M = 111.72 W/m2, SD = 23.55, 95% CI [102.93, 120.52]). There was a slight increase at the introduction of the Transfer phase but this was not statistically significant (blocks 31/32, M = 112.31 W/m2, SD = 22.09, 95% CI [104.06, 120.55]). HF was further reduced by the end of the experiment (blocks 39/40 M = 110.04 W/m2, SD = 21.24, 95% CI [102.10, 117.97]) (see Figure 9).
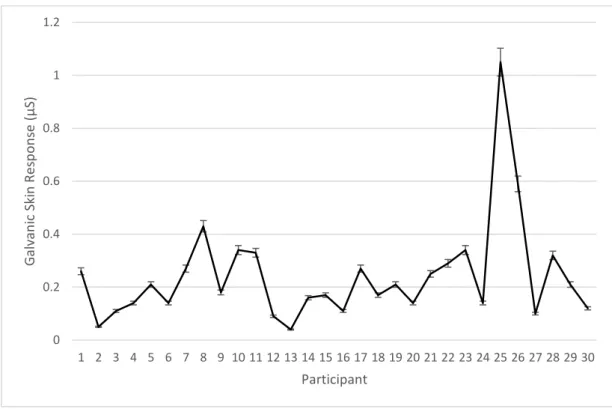
Variation in GSR
Visual inspection of GSR data suggested there was large variation between
participants, particularly at the start of the experiment (see Figure 10). Variance reduced as the experiment progressed, although one participant appeared to be a particular outlier
Figure 8. Mean heat flux per phase.
Error bars are 95% Confidence intervals.
Figure 9. Mean galvanic skin response per
phase. Error bars are 95% Confidence intervals.
Figure 7. Mean reaction time per phase.
(participant 25) (see Figures 11, 12). By the end of the experiment less variance was seen across all participants (see Figure 14).
0 0.2 0.4 0.6 0.8 1 1.2 1 2 3 4 5 6 7 8 9 10 11 12 13 14 15 16 17 18 19 20 21 22 23 24 25 26 27 28 29 30 G alv an ic Skin Res p o n se ( µ S) Participant 0 0.2 0.4 0.6 0.8 1 1.2 1 2 3 4 5 6 7 8 9 10 11 12 13 14 15 16 17 18 19 20 21 22 23 24 25 26 27 28 29 30 G alv an ic Skin Res p o n se ( µ S) Particpant
Figure 10. GSR variance by participant during Training Block 1. Error bars represent 95% Confidence Intervals.
Figure 11. GSR variance by participant during Training Block 30. Error bars represent 95% Confidence Intervals.
0 0.2 0.4 0.6 0.8 1 1.2 1 2 3 4 5 6 7 8 9 10 11 12 13 14 15 16 17 18 19 20 21 22 23 24 25 26 27 28 29 30 G alv an ic Skin Res p o n se ( µ S) Participant 0 0.2 0.4 0.6 0.8 1 1.2 1 2 3 4 5 6 7 8 9 10 11 12 13 14 15 16 17 18 19 20 21 22 23 24 25 26 27 28 29 30 G alv an ic Skin Res p o n se ( µ S) Participant
Figure 12. GSR variance by participant during Transfer Block 31. Error bars represent 95% Confidence Intervals.
Figure 13. GSR variance by participant during Transfer Block 40. Error bars represent 95% Confidence Intervals.
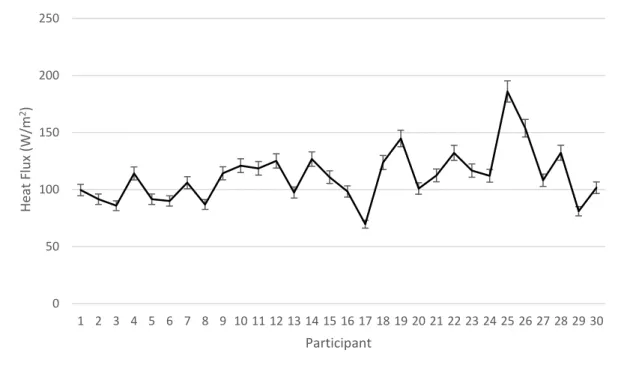
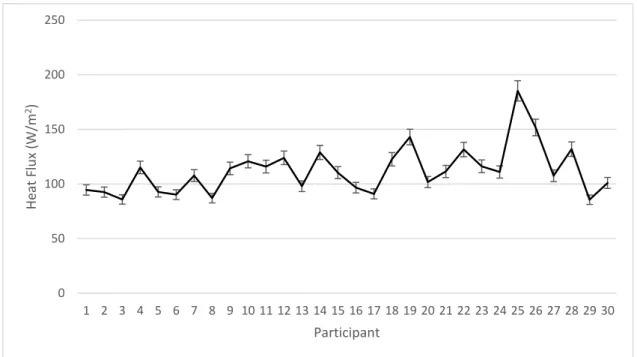
Variation in HF
Visual inspection of HF data suggested there was less variation between participants than in the GSR data, but evidence of individual differences was still visible (see Figures 14, 15, 16, 17). 0 50 100 150 200 250 1 2 3 4 5 6 7 8 9 10 11 12 13 14 15 16 17 18 19 20 21 22 23 24 25 26 27 28 29 30 H eat Flux ( W/m 2) Participant 0 50 100 150 200 250 1 2 3 4 5 6 7 8 9 10 11 12 13 14 15 16 17 18 19 20 21 22 23 24 25 26 27 28 29 30 H eat Flu x (W/m 2) Participant
Figure 14. Heat flux variance by participant during Training Block 1. Error bars represent 95% Confidence Intervals.
Figure 15. Heat flux variance by participant during Training Block 30. Error bars represent 95% Confidence Intervals.
Figure 16. Heat flux variance by participant during Transfer Block 31. Error bars represent 95% Confidence Intervals.
Figure 17. Heat flux variance by participant during Transfer Block 40. Error bars represent 95% Confidence Intervals.
Discussion
The aim of this study was to evaluate the potential of galvanic skin response (GSR) and heat flux (HF) as physiological measures of cognitive load via correlation with the
0 50 100 150 200 250 1 2 3 4 5 6 7 8 9 10 11 12 13 14 15 16 17 18 19 20 21 22 23 24 25 26 27 28 29 30 H eat Flu x (W/m 2) Participant 0 50 100 150 200 250 1 2 3 4 5 6 7 8 9 10 11 12 13 14 15 16 17 18 19 20 21 22 23 24 25 26 27 28 29 30 He at Flux (W/m 2) Participant
performance measure of reaction time (RT). Concurrently, an investigation into automaticity and skill transfer was conducted. The experiment used a variation of the dot counting task described by Lassaline and Logan (1993). The task demonstrates a shift from controlled to automatic processing as a result of practice (Lassaline & Logan, 1993). As changing a contextual element of a task has previously been shown to disrupt automatic processing (Speelman et al., 2011), the addition of the memory task in the Transfer phase was expected to interrupt automaticity and create a measurable increase in cognitive load as participants attempted to keep the 6-digit memory item active in working-memory.
The first hypothesis, that there would be a positive relationship between RT, HF and GSR was partially supported. RT was not correlated with GSR during any phase
(Training/Transfer) of the experiment. Whilst RT was not correlated with HF across any phase, additional analysis showed that reductions in RT due to practice were correlated with reductions in HF due to practice during the Training phase of the experiment (blocks 1/2 and 29/30). The second hypothesis, that all three measures would be initially elevated at the beginning of the Training phase, show a reduction at the end of the Training phase (as automaticity occurred), followed by a return to an elevated level at the start of the Transfer phase, was partially supported. RT showed the expected pattern of results (see Figure 7). Whilst both GSR (see Figure 8) and HF (see Figure 9) appeared to show the expected reduction during the Training phase, neither measure showed an increase at the introduction of the Transfer phase. This suggests that, in this experiment, an increase in cognitive load, due to the addition of the memory task, could not be detected via the physiological measures GSR or HF. However, the correlation between RT practice reductions and HF practice reductions suggests that HF did demonstrate the reduction in cognitive load associated with automaticity. Whilst visual analysis of GSR data (see Figure 8) suggested GSR also reduced
during the Training phase, the reductions were small and were not correlated with RT decreases due to practice.
In addition, whilst RT showed the expected increase at Transfer, analysis of
individual data showed automaticity endured in 95% of the participants who had transitioned to automatic processing by this stage of the experiment. This suggests that the acquired skills were transferred to the contextually different task and provides support for Instance Theory (Logan, 1988). The findings are discussed in more detail below.
Reaction Time and Automaticity
In line with previous research (Logan, 1988; Lassaline & Logan, 1993; Speelman & Muller-Townsend, 2015), group RT data showed the hypothesised pattern of a reduction after extensive practice, followed by an increase at the introduction of the memory task (designed to interrupt automaticity). In previous studies utilising the dot counting task, RT has been used as an indicator of automaticity via the fitting of regression slope lines to RT data as a function of numerosity. That is, since it takes longer to count to 11 than 6, a positive slope value is expected at the start of the experiment as participants rely on an algorithmic counting strategy (Lassaline & Logan, 1993; Speelman & Muller-Townsend, 2015). With substantial practice (Schneider & Shiffrin, 1977; Shiffrin & Schneider 1977), and via the use of stored memory instances (Logan, 1988), participants transition to automatic processing and can respond to each numbered image with equal speed. The RT/numerosity slope therefore is reduced to an almost flat line; the typically cited automaticity criterion for the dot counting task is a slope value of < 100ms/dot (Logan, 1988; Lassaline & Logan, 1993; Speelman & Muller-Townsend, 2015). As hypothesised, the group results suggested that participants transitioned to automaticity by the end of the Training phase. The introduction of the memory task at the start of the Transfer phase appeared to cause the expected interruption to
automaticity, suggesting that participants returned to the algorithmic counting strategy. By the end of the Transfer phase automaticity had resumed.
The group results therefore appear to support the findings of Speelman et al. (2011), who suggest that a contextual change in a task can cause a disruption to automatic processing, concluding that automaticity is more fragile than Instance Theory (Logan, 1988) suggests. However, an examination of individual data, as recommended by Speelman and McGann (2013), found that only one participant showed the same pattern as the group results, with the introduction of the memory task causing an interruption to automaticity as indicated by a slope value greater than 100ms/dot. Whilst most participants (27/30) showed an increase in RT at the introduction of the memory task, the majority of participants (19/20) who had reached automaticity criteria by the end of the Training phase (20/30), still met the criterion at the start of the Transfer phase. This suggests that automaticity endured despite the
contextual change in task. This finding can be interpreted as providing empirical support for Instance Theory (Logan, 1988). Instance Theory predicts that skill transfer will be narrow due to the specificity of the stored memory instances (Logan, 1988). The fact that identical dot images were used in both the Training/Transfer phases suggests that the stored memory instances were still accessible despite the additional memory task element. The support for Instance Theory is further reinforced by the fact that an additional three participants transitioned to automaticity by the end of the experiment. This suggests that the supplementary practice in the Transfer phase (a further 180 trials) assisted in the
strengthening of the memory instances (Logan, 1988), allowing automaticity to develop (Schneider & Shiffrin, 1977; Shiffrin & Schneider 1977). In contrast, ACT theory (Anderson, 1992) suggests automaticity develops due to the strengthening of the procedural algorithm used to execute a task. Due to the simplistic nature of the dot counting task, it is perhaps unlikely that further practice beyond the initial 540 trials would have led to additional
algorithmic improvements, suggesting the results from this experiment do not support ACT theory’s conceptualisation of automaticity.
Further highlighting the importance of considering individual data when investigating psychological theories (Speelman & McGann, 2013), six participants in the experiment failed to reach automaticity criteria at all, with RT data suggesting controlled processing was used throughout the experiment. In addition, one participant reached the criteria for automaticity at the start of the experiment but RT slowed down as the experiment progressed, displaying a negative slope line and the opposite pattern to what was expected. This data supports the findings reported by Speelman and Muller-Townsend (2015) who found large individual differences in the attainment of automaticity and stressed the importance of not relying on group means when interpreting automaticity data.
Galvanic Skin Response and Cognitive Load
In previous studies, GSR has been found to show promise as a potential measure of cognitive load (Mehler et al., 2009; Nourbakhsh et al., 2015; Shi et al., 2007; Wilson, 2002), although mixed results have been reported (Ferreira et al., 2014; Haapalainen et al., 2010; Ikehara & Crosby, 2005; Pluyter et al., 2013). In this study, GSR failed to show the expected correlation with the performance measure of RT. Whilst GSR readings did reduce with practice, the reductions were small and not correlated with RT data. In addition, the expected increase when the memory task was introduced was not seen. Visual analysis of individual data suggested GSR showed a degree of variance between participants, particularly at the start of the experiment (see Figures 10, 11, 12, 13), but low variance within each participant. The majority of participants showed one of two patterns, GSR either started high and reduced as the experiment progressed, or started low and increased as the experiment progressed (see Figures 18 and 19). The six participants who showed an increase at the introduction of the Transfer phase followed the pattern of a gradual increase across the whole experiment.
GSR has been widely researched as a potential measure of a number of psychological constructs, including as a bioindicator of personality, marker of psychopathology, measure of stress, emotion, sleep, habituation, learning and information processing, as well as cognitive load (Boucsein, 2012). It is therefore difficult to ascertain exactly what this, somewhat generalised, physiological response is actually measuring (Boucsein, 2012). The mechanisms involved in GSR (changes in skin moisture conductance) appear to be related to the
autonomic stress response of the sympathetic nervous system (Boucsein, 2012; Liden et al., 2012), suggesting perhaps it could be general physiological arousal that is being measured. Setz et al. (2010) directly compared a low cognitive load condition and two high stress conditions in an office environment, in an attempt to evaluate the effectiveness of the GSR measure. Setz et al. (2010) concluded that GSR appeared to be a reliable discriminator between high stress and low cognitive load, showing higher readings in the high stress conditions. This somewhat explains the opposite results shown in some studies, which have found that GSR increased as task difficulty decreased, with both sets of researchers
concluding that the easier task could have been more stressful for participants due to boredom or unfamiliarity with task features (Ikehara & Crosby, 2005; Shi et al., 2007).
The dot counting task used in this experiment is fairly simple in nature and the number of practice trials used to induce automaticity (540 trials) means it is extremely repetitive and time-consuming, with each session lasting approximately one hour. Whilst it has been successfully used to show a transition from controlled to automatic processing (Logan, 1988, Lassaline & Logan, 1994, Speelman & Muller-Townsend, 2015), it may not have been arousing enough to stimulate a physiological stress/cognitive load response. This explains the lack of variability within the participant GSR readings. The same could be said of the memory task designed to create the measurable increase in cognitive load and disrupt automaticity. Due to software/equipment constraints, the task required participants to