16th Australasian Fluid Mechanics Conference Crown Plaza, Gold Coast, Australia
2-7 December 2007
CFD designed experiments for shock wave/boundary layer interactions in hypersonic ducted
flows
A. G. Dann and R. G. Morgan
Centre for Hypersonics Division of Mechanical Engineering
University of Queensland, Brisbane, Qld, 4072 AUSTRALIA
Abstract
The successful operation of scramjet combustors requires com-pression of hypersonic viscous ducted flows and avoidance of separation effects which may preclude steady flow. Separa-tion effects in scramjet inlets and combustors can be caused by shock wave/boundary layer interactions. The hypersonic tur-bulent flow experiments needed are inherently difficult to de-sign because of the high sensitivity of the macroscopic flow parameters which cause the turbulent flow processes. Hence computational fluid dynamics (CFD) is a useful tool for the de-sign and characterisation of models in hypersonic flows before model construction. One of the greatest challenges however is to ensure that the flow is being modeled accurately. In this paper, a commercial code has been used to model an experi-ment performed in a small reflected shock tunnel using a Mach 8.65 condition. The research being carried out in this facility is concerned with separation due to incident shock wave/turbulent boundary interactions in hypersonic ducted flows. The model is designed to produce two conical shocks which interact with a turbulent boundary layer and it is instrumented with pres-sure transducers and thin film heat transfer gauges. The mea-surements have allowed graphical representation of unseparated static wall pressure and heat flux prior to and after each wall in-teraction. The results of the simulations are in excellent agree-ment with the experiagree-mental data. The code has been applied to identify parameter boundaries in the design of a model of simi-lar scale that will produce separated flow.
Introduction
For high speed air-breathing engines, knowledge of the point at which boundary layer separation occurs limits the design pa-rameters. Shock wave/turbulent boundary layer interactions are a common occurrence in supersonic flows with almost any flow deflection accompanied by shock formation. Incident shock in-teractions occur when the shock that impinges on the boundary layer is generated by an external source. These allow for the study of the interaction of bulk flow compression without the added effects of streamline curvature and hence they have been used for the experimental work in this paper. They are particu-larly important for scramjet studies which involve ducted flows where there is a requirement to add as much heat and pressure as possible. Unfortunately analytical means of modeling sep-arated flow are not advanced. CFD codes however have pro-gressed significantly to the point where several commercially available codes are capable of simulating hypersonic flows in reasonable time frames. When dealing with separated flows it is important to ensure the use of time accurate codes to capture upstream influences which is not possible with time marching codes. Turbulence models still need to be employed to approxi-mate turbulent effects and these are most probably the cause of a large proportion of inaccuracies. Choice of the most appropri-ate turbulence model is therefore very important. Two-equation models are far more accurate when predicting boundary layer separation[1] however for unseparated flows simple algebraic
models will often suffice.
Experimental Program Facility
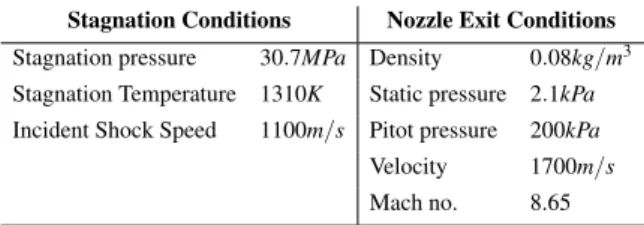
The experimental data for the following work has been obtained fromT2[2], a small free-piston reflected shock tunnel at the University of Queensland. The experimental results have been formulated from the one condition with stagnation conditions as shown in Table 1. The nozzle exit conditions, also presented in Table 1, were calculated using an equilibrium chemistry isen-tropic process from the stagnation results. These are based on the measured stagnation pressure, and the nozzle exit static and pitot pressures. The estimated Reynolds number is 7.5×10⁶/m which produces a turbulent boundary layer in the experimental model.
Table 1: Experimental stagnation and nozzle exit conditions Stagnation Conditions Nozzle Exit Conditions Stagnation pressure 30.7MPa Density 0.08kg/m3 Stagnation Temperature 1310K Static pressure 2.1kPa Incident Shock Speed 1100m/s Pitot pressure 200kPa Velocity 1700m/s Mach no. 8.65
Experimental Model
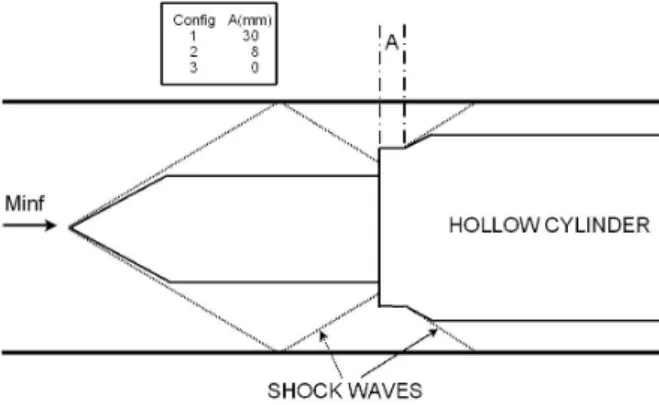
Scramjet combustor flows are characterised by a complex com-bination of multiple shock and expansion wave systems origi-nating from the intake compression and from heat release due to combustion. The traversing of these shocks through boundary layers limits the pressure rise which can be sustained without separation; which in turn limits the propulsive efficiency. In or-der to study this process from a fundamental point of view, a model was designed to create two sets of shock-expansion pairs which could traverse the boundary layer at preset distances. TheT2experiments involve an instrumented aluminium circu-lar duct of inner diameter 38mm and length 420mm. The duct was instrumented longitudinally with eight PCB pressure trans-ducers and six quartz thin-film heat transfer gauges. The model (Fig. 1) incorporates an inlet with a conically shaped cowl (not shown), and a shock generator incorporating two cones of 15◦semivertex angles. The generator was moved incrementally rearward using the same condition at each shot in order to pro-vide more data points and hence greater resolution. At the point of shock wave/boundary layer interaction the maximum change in boundary layer thickness by utilising this procedure is ap-proximately±5% which is of second significance when com-pared to the axial gradients being measured. The duct is suffi-ciently long so as to allow development of a turbulent boundary
layer that will thereby interact with the conical shocks created from the cones. The existence of a turbulent boundary layer was verified by comparison of experimental heat transfer data with laminar and turbulent correlations[3].
In order to avoid unwanted shock and expansion wave effects the model has been designed so that the first reflected shock is swallowed by an inner cylinder and removed from the area of interest. The second shock generator is able to be moved forward or rearward to adjust the second shock wave/boundary layer interaction position.
Data was recorded for three model configurations as shown in Fig. 1. The first configuration was to confirm that the pressure and heat flux peaks corresponded to the generation of shocks by the cones and not other features of the model i.e. the second cone was positioned far downstream, the second was based on results of an early viscous CFD simulation that showed sepa-ration after the second cone interaction, and the third was with the second cone as far forward as possible and still allowing the first reflected shock to be swallowed.
Figure 1: Two-shock experimental model (not to scale).
Computational Fluid Dynamics Program Experimental Model CFD Design
The commercial code CFD-Fastran produced by ESI Software was used to model the flow as described in the experimen-tal program. This program uses a compressible flow, finite volume, Navier-Stokes solver. The current simulations have been done with ideal gas and both Baldwin and Lomax and k−ωturbulence models. Ideal gas was used due the low en-thalpy of the flow with expected maximum temperatures in the model well below 800K at which we would expect vibrational modes to cause thermal effects[4]. In Fastran, the experimen-tal model was constructed as an axisymmetric model (Fig. 2) with clustering of cells on the duct inner wall where the shock wave/turbluent boundary layer interactions occur. The CFD model was grid refined to give a clear indication of grid inde-pendence. The duct inlet conditions were input as those at the exit of the shock tube nozzle i.e. u=1700m/s,v=0m/s,w= 0m/s,P=2100Pa,T =100K. All walls were modeled as isothermal with T =300K, outlets were extrapolated mean-ing that all flow variables are extrapolated to the exit bound-ary from the domain interior, and the initial conditions were set as those of the experimental dump tank before firing namely p=133Pa,T=300Kand a small velocity along the centreline axis of 10m/sto prevent the initial calculation from failing. The heat flux parameterqw(Eq. 1) in CFD-View (ESI Soft-ware’s post-processor software) was used to calculate the heat flux near the wall. Since the walls were modeled as
isother-mal the heat data was extracted from the cell next to the wall. The temperature gradient was determined to be closely linear so there was no need for manipulation of the heat flux equation for the proposes of this study.
qw=κTc−Tw
δ (1)
whereκis the thermal conductivity,δis the projected distance from the wall face centroid to the cell centroid,Tcis the cell centre temperature andTwis the wall temperature.
Figure 2: Sample CFD grid construction (not to scale and actual grid resolution not able to be shown).
Proposed Model CFD Design
In order to produce a stronger second shock interaction and therefore cause boundary layer separation, greater compression was required. This necessitated removing the radial outlet as used on the existing experimental model and replacing it with an outlet to swallow the first reflected shock that was axial (Fig. 3). This allowed room for the second cone base radius to be increased to provide sufficient compression and still be within the confines of the existing 38mmdiameter duct.
The proposed model grid has been created in a very similar manner to the existing model grid with cell clustering at the duct inner wall. The Baldwin and Lomax andk−ωturbulence models have both been applied to allow comparison of sepa-ration results. The Baldwin and Lomax model should behave poorly as compared to thek−ωmodel because it is devoid of any information about the flow history[1]. Also the Boussinesq approximation and ‘equilibrium’ approximations implicit in al-gebraic models can not provide accurate calculation of sepa-rated flows[1].
Figure 3: Proposed two-shock experimental model (not to scale).
Results and Discussion Existing Model CFD Results
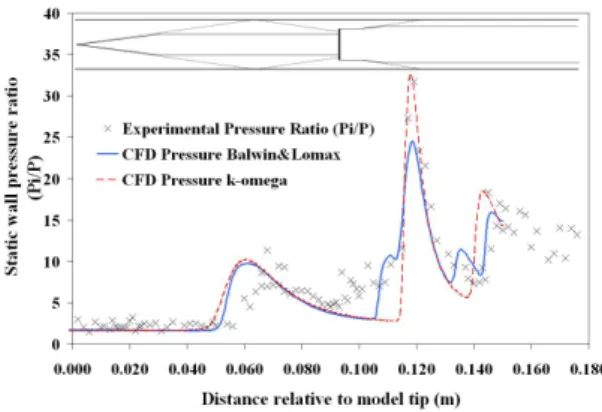
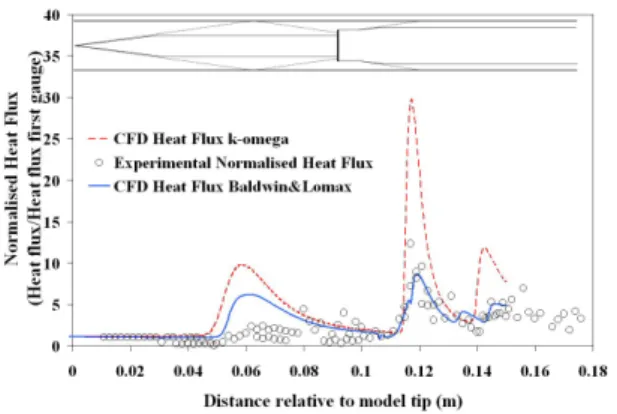
The comparison of experimental and computational results for each experimental configuration can be seen in Fig.s 4, 5 and 6 for pressure and Fig.s 7, 8 and 9 for heat flux. In each figure an approximate representation of the experimental model has been placed at the top to allow expected interaction location and data comparison. The figures show generally excellent agreement of experimental and computational results as follows.
In Configuration 1 (Fig. 4), the Baldwin and Lomax andk−ω turbulence models show excellent agreement with the experi-mental results for the pressure ratios. When comparing the heat flux (Fig. 7), the Baldwin and Lomax model is also in excel-lent agreement however thek−ωmodel over-predicts the heat flux significantly, over twice the value at the first interaction and over a half the value at the second interaction. The interaction positions axially are very well predicted and the viscous inter-action off the leading edge of the hollow cylinder is also seen computationally.
In Configuration 2 (Fig. 5), the Baldwin and Lomax andk−ω turbulence models show excellent agreement with the experi-mental results for the pressure ratios. The Baldwin and Lomax model is also in excellent agreement when compared with the heat flux data (Fig. 8) however thek−ωmodel over-predicts the heat flux significantly once again, over twice the value for both interaction peaks. The first interaction position is not as well predicted for both turbulence models as it was in Config-uration 1 but the second interaction is very well predicted as are the subsequent reflected shocks downstream of the second interaction.
The final configuration, Configuration 3, shows the greatest variation of experimental and computational data. The Baldwin and Lomax model still gives excellent prediction of the peak pressure and interaction locations for both interactions (Fig. 6). Thek−ωturbulence model over-predicts the peak pressure for the second interaction by almost 100% but is in excellent agree-ment for the first interaction and the reflected shocks down-stream of the second interaction. The peak heat flux locations (Fig. 9) are well predicted by both models however the Baldwin and Lomax model under-predicts the second interaction peak and thek−ωturbulence model over-predicts the first and sec-ond interaction heat fluxes by approximately a half and one and a half respectively.
Figure 4: Comparison of pressure data for experimental and CFD results for configuration 1.
The Baldwin and Lomax turbulence model has more accurately
Figure 5: Comparison of pressure data for experimental and CFD results for configuration 2.
Figure 6: Comparison of pressure data for experimental and CFD results for configuration 3.
Figure 7: Comparison of heat flux data for experimental and CFD results for configuration 1.
modeled the pressure and heat flux ratios as compared to the experimental data for three experimental configurations. It has more successfully captured the peak pressures and heat fluxes in this unseparated flow. Thek−ωmodel has over-predicted pressure and heat flux ratios and this is partially due to the ab-sence of a stress limiter which is not available on this version of the model (Wilcox 1991). The stress limiter serves to limit the
Figure 8: Comparison of heat flux data for experimental and CFD results for configuration 2.
Figure 9: Comparison of heat flux data for experimental and CFD results for configuration 3.
kinematic eddy viscosity when energy production due to turbu-lence exceeds its dissipation[1].
Proposed Model CFD Results
A series of simulations with increasing second cone base ra-dius (or increasing mass flow rate compression ratio) were per-formed using both Baldwin and Lomax and k−ωturbulence
models. The results of these simulations are summarised in Fig. 10 which plots increasing mass flow rate compression ratio against the static wall pressure ratio. When the mass flow rate compression ratio reaches approximately 2.78 thek−ωmodel predicts no further increase in pressure ratio. There is a sud-den rise in pressure ratio when the Baldwin and Lomax model reaches a mass flow rate compression ratio of approximately 3. The simulations above 3.05 mass flow rate compression ra-tio for the Baldwin and Lomax model became unsteady due to choking of the duct. The region from 2.78−3.05 mass flow rate compression ratio is the most interesting area and may be indicative of an incipient to full separation region. This amount of mass flow rate compression (approximately 13.5−14.1mm
second cone base radius) will therefore be targeted in the design of the proposed model.
Since the proposed model has compressed the flow more that the existing model, velocity profiles of the final section of the duct were examined to determine that distinct boundary layers were present on the upper and lower walls. Figure 11 shows the
Figure 10: Turbulence model compression investigation for proposed two-shock model.
velocity profiles for the Baldwin and Lomax andk−ω turbu-lence models with 2.85 mass flow rate compression ratio. The flat regions between each curved profile near the walls indicate separate boundary layers. It is evident that a region of uniform freesteam still exists between the boundary layers and it is not full developed pipe flow.
Pressure contour plots were used to observe shock positions in-cluding the swallowing of the first reflected shock. Also reverse flow can be shown by plotting velocity vectors on these contour plots. Figure 12 shows a typical pressure contour plot of the rear half of the duct with the Baldwin and Lomax model. The circled region just ahead of the second shock wave/boundary layer interaction is indicative of a separation bubble. All sim-ulations using the Baldwin and Lomax model above the 2.28 mass flow rate compression ratio point exhibit this separation region which was not observed experimentally at the same peak pressures.
Figure 11: Velocity profiles across rear of duct for proposed two-shock model.
Figure 12: Pressure contours from CFD-Fastran in proposed two-shock model.
Typical computational results for the proposed model with a mass flow rate compression ratio of 2.85 (or second cone base
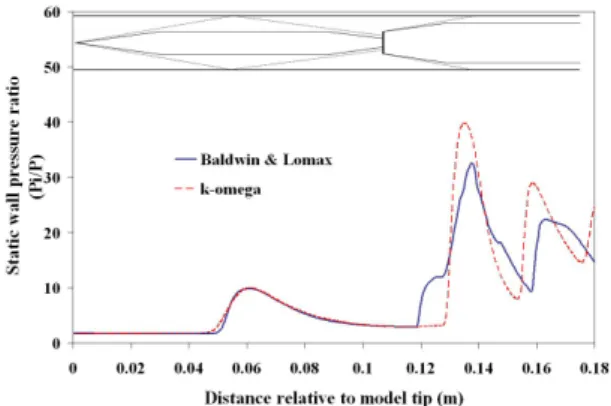
radius of 13.7mm) can be seen in Fig.s 13 and 14. As with the other figures, an approximate representation of the experimental model has been placed at the top to allow expected interaction location and data comparison. These figures show significant differences between the two turbulence models. For the pres-sure ratios, both models have a similar trend except that the Baldwin and Lomax model predicts separation at the second shock wave/boundary layer interaction point as evidenced by the inflection at approximately 0.125m. The velocity vectors at this point show a reverse velocity region as would be expected. Thek−ωmodel predicts a peak pressure ratio that should cause separation according to the incipient separation correlations of Korkegi[5] yet the Baldwin and Lomax model peak pressure is not high enough according to the same correlations despite the separation inflection point noted.
The heat flux ratios are also significantly different. Thek−ω model predicts a peak heat flux at the second interaction which is 2.5 times that of the Baldwin and Lomax model. This is con-sistent with thek−ωmodel heat flux calculations of the exist-ing experimental model. Once again the most probable reason why thek−ωmodel over-predicts the peak heat flux and to some degree the peak pressure, is that this version of the model does not include a stress limiter. In the experimental data and Baldwin and Lomax model predictions, the Baldwin and Lomax model consistently under-predicts the peak heat flux. We might therefore reasonably conclude that the actual heat flux will fall between the predictions of these two turbulence models.
Figure 13: Pressure ratios determined by Baldwin and Lomax andk−ωturbulence models in proposed two-shock model with second cone base radius of 13.7mm.
Conclusions
CFD-Fastran has been used to model shock wave/boundary layer interactions in hypersonic flows. The software was used to replicate conditions and geometry of a model which has been previously tested and also to predict flow through a new model designed to produce separation of the boundary layer. In the experimental model, a turbulent boundary layer was subjected to two quantified compression-expansion systems, with an ad-justable axial separation between them. CFD-Fastran has been successful in demonstrating that it is characterising the flow cor-rectly for the existing experimental model. The Baldwin and Lomax turbulence model has been more successful than the
k−ωturbulence model at predicting these unseparated flows. Both turbulence models have been applied to design an exper-imental model which will induce separation. Thek−ω turbu-lence model simulations did not predict any boundary layer aration despite predicting pressure ratios that should cause sep-aration. The Baldwin and Lomax turbulence model predicted
Figure 14: Heat flux ratios determined by Baldwin and Lomax andk−ωturbulence models in proposed two-shock model with second cone base radius of 13.7mm.
separation at all mass flow rate compression ratios above 2.28 which was not observed in the experimental data. Hence the de-sign of the new model will incorporate a compromise of the two turbulence model results and the data will be useful for clarify-ing an area of theoretical uncertainty.
References
[1] Wilcox, D. C.,Turbulence modeling for CFD, Third Ed., DCW Industries, La Canada, California, 2006.
[2] Dann A. G., Denman A. W., Jacobs P. A., Morgan R. G.: Study of separating compressible turbulent boundary-layers, AIAA Paper 2006-7943, 2006.
[3] Morgan R. G., Stalker R. J., Shock Tunnel Measurements of Heat Transfer in a Model Scramjet,AIAA paper 85-908, 1985.
[4] Anderson, J. D., Hypersonic and High Temperature Gas Dynamics, AIAA, Reston, Virginia, 2000.
[5] Korkegi R. H., Comparison of shock-induced two- and three-dimensional incipient turbulent separation, AIAA Journal, 13(4):534-535, Apr. 1975.