DISTRICT CAPACITY AND THE IMPLEMENTATION OF POSITIVE BEHAVIOR INTERVENTIONS AND SUPPORTS: AN EXPLORATORY STUDY
by
ALLISON WRIGHT BLAKELY
A DISSERTATION
Presented to the Department of Special Education and Clinical Sciences and the Graduate School of the University of Oregon
in partial fulfillment of the requirements for the degree of
Doctor of Philosophy September 2017
DISSERTATION APPROVAL PAGE Student: Allison Wright Blakely
Title: District Capacity and the Implementation of Positive Behavior Interventions and Supports: An Exploratory Study
This dissertation has been accepted and approved in partial fulfillment of the
requirements for the Doctor of Philosophy degree in the Department of Special Education and Clinical Sciences by:
Dr. Robert Horner Chairperson Dr. Kent McIntosh Core Member Dr. Erin Chaparro Core Member
Dr. Jeffery Todahl Institutional Representative and
Sara D. Hodges Interim Vice Provost and Dean of the Graduate School Original approval signatures are on file with the University of Oregon Graduate School. Degree awarded September 2017
© 2017 Allison Wright Blakely
DISSERTATION ABSTRACT Allison Wright Blakely
Doctor of Philosophy
Special Education and Clinical Services September 2017
Title: District Capacity and the Implementation of Positive Behavior Interventions and Supports: An Exploratory Study
The purpose of this study was to examine the relation between district capacity as measured by the District Capacity Assessment (DCA) and the initial, depth, scale, and sustained implementation of an evidence-based practice (EBP), Positive Behavior Interventions and Supports (PBIS). This exploratory analysis also examined the internal structure of the DCA and how district-level context may influence the overall DCA score. Results from the study showed a positive relation between DCA scores and Tier I (i.e., initial) and Tier II (i.e., depth) of PBIS implementation. While this study did not provide conclusive evidence between the DCA and all aspects of PBIS implementation, it does provide implications for future inquiry into the study of district capacity. The discussion will review the findings, overview the limitations, discuss the implications of the results, and provide future directions for researchers, policy-makers, and practitioners interested in the further study of district capacity.
CURRICULUM VITAE NAME OF AUTHOR: Allison Wright Blakely
GRADUATE AND UNDERGRADUATE SCHOOLS ATTENDED: University of Oregon, Eugene
Portland State University, Portland, Oregon DEGREES AWARDED:
Doctor of Philosophy, Special Education, 2017, University of Oregon Master of Science, Special Education, 2007, Portland State University Bachelor of Science, Educational Foundations, 2002, University of Oregon AREAS OF SPECIAL INTEREST:
Positive Behavior Interventions and Supports Implementation Science
Special Education Administration PROFESSIONAL EXPERIENCE:
Adjunct Faculty, Portland State University, 2015-2016 University Supervisor, University of Oregon, 2013
Learning Specialist, North Clackamas School District, 2007-2012 GRANTS, AWARDS, AND HONORS:
OSEP Doctoral Grant, Project RISE, University of Oregon 2012-2017 Rose Gross Scholarship, University of Oregon, 2014
PUBLICATIONS:
Hansen, S. G., Blakely, A.W., Dolata, J. K., Raulston, T., & Machalicek, W. (2014). Children with Autism in the Inclusive Preschool Classroom: A Systematic Review of Single-Subject Design Interventions on Social Communication Skills. Review Journal of Autism and Developmental Disorders,1(3), 192-206. Knowles, C., Blakely, A.W, Hansen, S., & Machalicek, W. (2017). Parents with
ACKNOWLEDGMENTS
First, I would like to acknowledge and extend my deepest appreciation to my advisor and dissertation chairperson, Dr. Rob Horner, for his support over the past five years and throughout the dissertation process. I also want to thank Drs. Erin Chaparro, Kent McIntosh, and Jeff Todahl for being members of my committee and for each providing insightful and thoughtful feedback.
Special thanks should be extended to my mentors, Dr. Renee Bradley and Debbie Egan for being role models, supporters and for pushing me to keep working towards this goal. I am also particularly grateful to Dr. Billie Jo Rodriguez for being a staunch
supporter and a dear friend. Additional thanks should be given to my colleagues: Drs. M. Kathleen Strickland-Cohen, Sarah Hansen, Sarah Pinkelman, Christen Knowles and Michelle Massar for offering continual support as both scholars and friends.
This dissertation could not have been completed without the support from my family. Louis and Stevie, thank you for raising me to be a driven, educated woman and for providing extra resources (e.g., walking around money) that helped me survive as a graduate student. My sister, Kelsey, deserves special thanks because she has always been my biggest champion, has given me encouragement when I have needed it most and keeps me laughing on the daily. Lastly, much gratitude is owed to Brendan Watkins, thank you for your reassurance, unwavering support, and love. Although I did not know you when I started working on my PhD, I am beyond thankful that I am finishing with you by my side and I look forward to many post-PhD adventures.
TABLE OF CONTENTS Chapter Page I. INTRODUCTION ... 1 Evidence-Based Practices ... 2 Implementation Science ... 2 Sustained Implementation ... 11 Scaling-up ... 13
Positive Behavior Interventions and Supports ... 14
School Districts ... 18 District Capacity ... 20 Study Purpose ... 22 II. METHODOLOGY ... 24 Participants ... 24 Measures ... 25
District Capacity Assessment ... 25
PBIS Fidelity Measures ... 27
School District Demographics ... 30
Additional Variables ... 30
Statistical Analysis ... 31
Exploratory Factory Analysis ... 31
Analytic Approach ... 32
Chapter Page
Summary ... 38
III. RESULTS ... 39
District Capacity ... 39
Factor Analysis ... 39
Research Question One ... 44
Research Question Two ... 45
Research Question Three ... 48
Research Question Four ... 49
Research Question Five ... 50
Summary ... 51
III. DISCUSSION ... 52
Review of the Findings ... 52
Limitations ... 53
Implications ... 54
Future Directions ... 57
Conclusion ... 62
APPENDICES ... 63
A. DISTRICT CAPACITY ASSESMENT ... 63
B. TIERED FIDELITY INVENTORY ... 93
LIST OF FIGURES
Figure Page
1. PBIS Multi-Tiered Logic ... 15 2. District Capacity Logic Model ... 21
LIST OF TABLES
Table Page
1. Active Implementation Frameworks ... 4
2. District Capacity Assessment ... 26
3. Tiered Fidelity Inventory ... 28
4. Factor Loading and Communalities for PCA and the DCA ... 41
5. DCA Factor Analysis Technical Adequacy Results ... 43
6. Results for Research Question One ... 45
7. Results for Research Question Two ... 47
8. Results for Research Questions Three ... 49
CHAPTER I INTRODUCTION
Federal policy in the US requires that school districts hold schools accountable for student academic and social success (Klein, 2015). The recent support of evidence-based practices (EBPs) in education policy is founded on the idea that if there is investment in the core capacity of school districts there will be improved adoption and sustained implementation of evidence-based practices in schools, leading to valued outcomes for students (Turri, et al., 2016). District capacity is defined as the systems, activities, and resources necessary to adopt innovations, implement with fidelity, scale up, and sustain a practice. Quantifiable measurement of district capacity is proposed using the District Capacity Assessment (DCA; Ward, et al. 2015). This study is designed to quantify the relationship between district capacity (as measured by the DCA) and the implementation of positive behavioral interventions and supports (PBIS). Advances in the use of the DCA and PBIS make such an assessment possible, recent methodology advances in multi-level modeling make it practical, and the embrace of EBPs in our current education policies make this analysis crucial.
The remainder of this chapter provides the literature supporting this inquiry. First, the importance of evidence-based practices (EBPs) and the frameworks of
Implementation Science (Fixsen et al, 2005) are provided. Next, the basics of scaling-up and sustaining EBPs are specified followed by a description of the EBP used for this study, Positive Behavior Interventions and Supports (PBIS). School districts, the unit of analysis, and district capacity are explained and a logic model provides a visual to guide
the reader from valued outcomes to importance of district capacity. This chapter concludes with the purpose of the study and research questions.
Evidence-Based Practices
The use of evidence-based practices (EBP) is encouraged in nearly every field, from healthcare to business, and is typically lauded as an effective way to ensure
improved outcomes such as quality of care (Grol & Grimshaw, 2003; Kitson, Harvey, &
McCormack, 1998) or higher profit margins (Nilsson, Johnson, & Gustafsson, 2001;
Prahalad & Hammond, 2002). Investing in EBPs in our schools is heavily influenced by
our most important educational policies. For example, On December 10, 2015, when President Obama signed the Every Student Succeeds Act (ESSA), a civil rights law, it upheld critical protections for our most disadvantaged students and ensures states and school districts hold schools accountable by requiring an investment in EBPs. Similar to ESSA, the Individuals with Disabilities Education Act (IDEA; 2004) also directs focus to the use evidence-based practices. IDEA requires that Individualized Education Plans (IEPs) include services supported by scientifically-based research, and that failure to respond to scientific research-based interventions may be a criterion for identifying a specific learning disability (Yell, Shriner, & Katsiyannis, 2006). The emphasis on the use of empirically-based interventions within laws such as ESSA and IDEA is promising, however, without a prioritization in the quality of implementation, the vision of these policies is in danger of falling short of stated expectations.
Implementation Science
throughout the policy system interpreted and acted on them (Bardach, 1977; Berman & McLaughlin, 1978; Fixsen, Naoom, Blase, Friedman, & Wallace, 2005). Public policy not only needs to look good on paper, or be formulated into words and concepts that resonate with stakeholders, but proponents of change also must consider that the greatest
hurdle comes with implementation. In other words, for educational policy such as ESSA
and IDEA to be linked with improved outcomes, investment in implementation is essential (Carnine, 1997; Sugai & Horner, 2006).
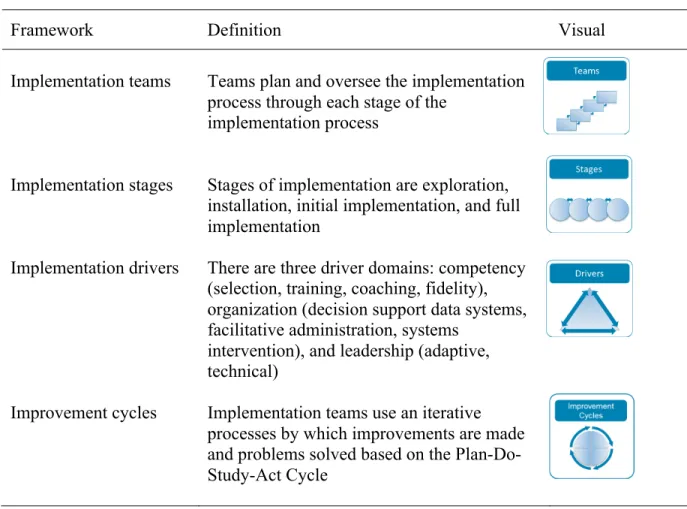
Implementation can be defined as, "A specified set of activities designed to put into practice an activity or program of known dimensions" (Fixsen, et al., 2005, p.5). Several frameworks are available that define the features of implementation (e.g., Re-AIM, Jilcott, Ammerman, Sommers, & Glasgow, 2007; PARiHS, Kitson, Rycroft-Malone, Harvey, McCormack, Seers, Titchen, 2008) the frameworks used in this study, however; are built on the logic of the Active Implementation Frameworks develop by Fixsen and colleagues (2005, table 1). These frameworks on based on the basis that
implementation involves two sets of activities (i.e., implementation activities and intervention activities) and two sets of outcomes (i.e., implementation outcomes and intervention outcomes). This framework provides what needs to be done (interventions), how to establish what needs to be done, and who will do the work (e.g., active
implementation). In this context, the interventions that “need to be done” are empirically
validated evidence-based practices that result in specific positive outcomes when used in
defined contexts by defined personnel with defined populations (Flay, et al., 2005;
Horner, Sugai, & Anderson, 2010). Ultimately, effective implementation teams engage
practice to sustaining the chosen practice over time. Table 1. Active Implementation Frameworks
Framework Definition Visual
Implementation teams Teams plan and oversee the implementation process through each stage of the
implementation process
Implementation stages Stages of implementation are exploration, installation, initial implementation, and full implementation
Implementation drivers There are three driver domains: competency (selection, training, coaching, fidelity), organization (decision support data systems, facilitative administration, systems
intervention), and leadership (adaptive, technical)
Improvement cycles Implementation teams use an iterative processes by which improvements are made and problems solved based on the Plan-Do-Study-Act Cycle
Implementation Teams
Teams responsible for implementation play an important role in the creation of systems that are prepared to take new practices and are the communication links between staff, leaders, and administrators (Fixsen, Blase, Metz, & Van Dyke, 2013; Metz & Bartley, 2012). A major task for implementation teams is to be held accountable for the effective implementation of the practice. Teams are responsible for lateral and horizontal communication within the organization. They also prepare for and respond to competing
communicate about the outcomes of both the intervention and the implementation activities. To measure these specific activities, teams use performance assessment measures, where the fidelity of implementation is a vital component.
Fidelity of Implementation. For the objectives of legislation such as ESSA and IDEA not to fall short of meeting the needs of students, measuring the fidelity in which the selected evidence-based practice is implemented (i.e., fidelity of implementation) is essential. Simply put, fidelity of implementation (FoI) is defined as the extent to which a program, intervention, framework, or practice, “is implemented as intended” (Schulte, Easton, & Parker, 2009, p. 460). Measures for fidelity are typically used to create action plans for initial or sustained implementation (Tobin, Vincent, Horner, Dickey, & May, 2012).
Active implementation activities often take place over several years and can be described across four main stages: (a) exploration, (b) installation, (c) initial
implementation, and (d) full implementation. (Fixsen et al., 2005). The implementation stages are dynamic within the context of schools, where moving back and forth among stages is common as personnel and circumstances change (e.g., policy, funding). Implementation Stages
The Exploration stage is the critical starting place. Taking the time for exploration can save time and money and improves the chances for success. During Exploration, an Implementation Team assesses readiness and addresses readiness concerns (if apparent; Chamberlain, Brown, & Saldana, 2011). For example, the Hexagon Tool, created by the National Implementation Research Network (Fixsen, Kizer, & Van Dyke, 2009), can help implementation teams select instructional, behavioral, and social-emotional, practices
that are evidence-based by reviewing six broad factors in relation to the program or practice under consideration. The Hexagon Tool helps teams and schools analyze the appropriateness of EBPs relevant to the unique context, helping establish if the EBP is an appropriate match, is feasible to implement, and fits a need within the context. A key
activity in the exploration stage is the systematic use of data to analyze a known problem
within the district, to take inventory of current practices, and to use tools such as the hexagon tool to determine if there are other resources that can help address the problem area in a more effective and efficient way.
If data shows that investing in a specific EBP would be appropriate, the next and often overlooked stage, is called Installation. This stage requires the identification of the resources needed to implement the chosen practice. Essential resources that need to be in place for the practice to reach full implementation are identified. These needs often include activities like developing staff selection procedures, identifying training and coaching needs and resources, and establishing fidelity tools. For the practice to reach the most students, adequate planning and preparation is essential. Many EBPs fail to reach implementation with fidelity because this stage can be easily overlooked. This failure can be avoided if critical attention is provided to the essential “start-up” activities and costs needed to implement the chosen EBP.
The next stage, Initial Implementation, describes when practitioners are using the practice for the first time. This stage can be tenuous, as attempting to use new skills can be awkward, or it can be difficult to change from the old ways of doing things. Often, there can be motivations for reverting to old routines, and external resources (i.e., support
from coaches, Joyce & Showers, 2002) become more important to ensure reformed practices.
Full Implementation describes the stage where at least 50% of the practitioners are using the practice with fidelity. Full implementation is difficult to meet, however, without essential supports. For the practice to be considered fully implemented, practitioners, staff, and administrators must be able to adapt and adjust to continually changing contexts. The use of effective practices is maintained and improved over time and withstands transitions (e.g., leadership, funding). During this stage, the new way becomes the standard way, where nearly all practitioners use the practice with fidelity. Implementation Drivers
According to the Merriam-Webster, an engine is “a mechanism or object that
serves as an energy source” (Merriam-Webster Online Dictionary, 2016). Within the
context of implementation, the mechanisms that provide the energy to promote change are called the implementation drivers. These drivers describe the facilitators and barriers to implementation. Similar to the implementation stages, the drivers are dynamic and interact in interesting ways. The implementation drivers are divided into three categories: (a) leadership, (b) organization, and (c) competency (Fixsen, et al., 2005)
Leadership. Effective implementation requires leadership to solve problems regarding adaptive and technical issues. For example, leaders may convene groups to identify and resolve problems (adaptive) or help manage time and funding (technical) needs that arise when initiating change in the adoption of a new practice. In schools, building administrators play a vital role in the adoption and implementation of an EBP, where turnover in leadership can be barrier to effectively implement or continue to
implement a practice (Clayton & Johnston, 2011; Strickland-Cohen, McIntosh, & Horner, 2014).
Organization. Organization refers to effective implementation related to facilitative administration, useful and accessible decision-support data systems, and systematic supports developed by administrators(i.e., superintendents, principals) and other non-teaching support staff. These individuals initiate organizational practices, support system-change interventions, and help remove institutional barriers so practitioners can make use of the new EBP. Even the most effective practices can be overcome with problems when funding or policy interferes with implementation efforts. Systems alignment, or the degree to which the systems with the community, state, and federal levels are supportive and enabling, are an integral piece of the organizational driver. Within the organization driver, a decision-support data system becomes an essential component for guiding the processes of establishing the practice, supports for practitioners, and the assessments of outcomes.
Competency. To reach full implementation, an investment in selection (e.g., hiring practices), training (e.g., teaching people new ways of doing things), and coaching (e.g., providing prompts and feedback to ensure the practice is being used effectively), needs focused attention. Support for teachers is required for students to actually experience an evidence-based practice delivered in an effective manner. Training and coaching become essential components of implementation, partly because teacher beliefs, self-efficacy, attitudes, and perceptions all influence whether and to what degree a
assessment of the skills taught in training, and reinforced and expanded during coaching. Performance feedback assessments can be related to the context (e.g., completion of training, availability of resources, acceptable practitioner/coach ratio), compliance (e.g., core components of the interventions being used by practitioners) and competence (e.g., the intervention components used to certain skill level. Performance feedback can take on a variety of forms within school systems. For example, coaches use information to
develop action plans, teams use information to guide implementation, and administrators can evaluate the effectiveness of training and coaching (Fixsen et al., 2005).
The processes of leadership, organization, and competency are integrated and must be linked to maximize the influence on the organizational culture and to resist fragmentation (Meyer, Scott, Strang, 1986). The implementation drivers also compensate for one another so that a weakness in one component can be overcome by strengths in other components (Fixsen et al., 2005). To be most effective, implementation teams, who are responsible for aligning the drivers with the implementation stages, work using effective problem solving cycles, described at improvement cycles.
Improvement Cycles
Successful implementation teams use an iterative framework for problem solving where they engage in four specific behaviors: (a) plan, (b) do, (c) study, and (d) act. Commonly known as PDSA cycles or a Deming cycle, Plan-Do-Study-Act, describes a team process that has evolved from post-World War II industrial control processes. A PDSA is useful in identifying and making small improvements to reach implementation goals.
The plan phase of the cycle refers to identifying the objectives and specific processes aimed at systematic improvement. Other activities in this phase might be asking questions, making predictions, and making a plan (i.e., identify who, what, when, where) to carry out the PDSA cycle. During the do phase of the cycle, the specific actions related to the plan are carried out. The implementation team executes the plan, documents unforeseen problems and obstacles, and engages in data collection to ensure the plan is put into place. The study phase refers to the monitoring and process where the
implementation team examines the data by asking, what did we learn? What worked? What went wrong? Data analysis would be completed, results would be compared to predictions made during the plan phase, and the data would be summarized to help the team understand what was learned. During the act phase, the application of what was learned occurs. The implementation team decides what changes, adoptions, and
abandonments need to occur based on the data analysis during the study phase. Critical to this phase is the iterative nature, where the implementation team asks: What’s next? and begins the PDSA cycle again (Taylor, McNicholas, Nicolay, Darzi, Bell, & Reed, 2013).
Through the empirical lens of Implementation Science, we are beginning to understand the complexities of implementing evidence-based practices and with notable degrees of fidelity. However, successful implementation of an effective practice does not signal the completion of work. The practice or collection of practices must be sustained over time to ensure the practices become a part of the culture. It would be a fallacy to assume that because a certain level of implementation has occurred, it would continue to occur. Instead, an investment in specific practices needs to occur as a final stage to
Sustained Implementation
Unfortunately, there is no guarantee that a practice will remain in place (or remain in place with adequate fidelity) once a certain level of implementation has been met (McIntosh, Horner, & Sugai, 2009). Failures to sustain the practice can happen due to a variety of reasons. For example, once initial implementation has been reached, often supports and resources (such as training and coaching) are removed or funding no longer
exists. Moreover, sustaining implementation in classrooms is complicated because
teachers who face challenges during implementation will often revert to traditional, comfortable practices (Lieberman, 2000; Gersten, Chard, & Baker, 2000). Issues such as these, plus a variety of others, can cause stress on the implementation drivers and impede sustained implementation (Fixsen, Blase, Timbers, & Wolf, 2001).
For initiatives to endure over time, withstand staff turnover, and continually
evolve to better support students and staff, the practice must have sustainability, typically
a “rare phenomenon” in education(Fixsen et al., 2005). Sustainability is “a practice’s
potential for durable implementation with high fidelity, when considering features of the
practice, its implementation, and the context of implementation”. Sustained
implementation (the desired outcome for any initiative) and sustainability (the presence
of variables that predict an initiative’s sustained implementation) are distinctly different (McIntosh et al., 2015).
A model of sustainability proposed by McIntosh, Horner, and Sugai (2009)
consists of four variables: (a) priority, (b) effectiveness, (c) efficiency, and (d) continuous regeneration. With attention to these variables, teams can guide the process of
Priority. Priority is the importance of the practice when compared to other practices. School personnel are more likely to engage in implementation activities related to practice if appropriate priority is given to the practice by support through
administration, integration into existing and new initiatives, and allocation of ongoing resources. When effective innovations are integrated into policy and are evident in hiring practices, job descriptions, and personnel orientation, such innovations have a higher probability of sustaining implementation (Barrett, Bradshaw, & Lewis-Palmer, 2008; George & Kincaid, 2008). When the scope of support stretches from school-level personnel to district and state leadership, the practice can be integrated into the core values of the organization (Han & Weiss, 2005) or into new or existing initiatives (McLaughlin & Mitra, 2001). With enough support from the organization and funding agencies, implementation is more likely to withstand competition from competing initiatives that vie for time and resources (McIntosh, 2015).
Effectiveness. Previously, effectiveness referred to the actual effects of the practice on student outcomes, but within sustained implementation, it also refers to the perceived effects by school personnel (Han & Weiss, 2005). While practices are most effective when they are both evidence-based and implemented with fidelity, school personnel will find implantation activities more reinforcing if they perceive the intervention as effective. Therefore, the duality of effectiveness, is dependent on the extent the practice is evidence-based and the extent to which implementation is done to fidelity (McIntosh, 2015).
practices can increase teacher stress, even if the practice is effective (McIntosh, Filter, Bennett, Ryan, & Sugai, 2010). Within implementation activities, resources will often be related to the rate of efficiency of implementation, where outside personnel (e.g., external coaches) can enhance the efficiency of a practice (McIntosh et al., 2015).
Continuous regeneration. Continuous regeneration describes the process of using data to monitor, adapt, and enhance implementation (McIntosh et al., 2009) and represents the highest level of implementation, adaptation of practices over time (Baker, Gersten, Dimino, & Griffiths, 2004). Three mechanisms drive continuous regeneration: (a) capacity building, the process of developing expertise within the organization as external supports are discontinued; (b) continuous measurement, a regular system of measuring intended outcomes and implementation fidelity; and (c) data-based problem solving, which involves the focused analysis of data to improve system function in relation to valued outcomes.
Initial implementation and sustained implementation require specific, thoughtful, action based on a variety of data sources. Implementation of an innovation/practice within one unit (i.e., school) can be complicated but implementation on a broad scale (e.g., scaling-up) is undoubtedly complex.
Scaling-up
Scaling-up generally refers to the process by which researchers and educators initially implement interventions or innovations on a small scale, validate them, and then implement them more widely in real-world conditions (Odom, 2009). Fixsen and
colleagues define scaling up as a process where at least sixty-percent of students who could benefit an innovation actually experiences the innovation (Fixsen, Blase, Horner,
Sims, and Sugai, 2013). Typically, scaling-up describes the process focused on expansion of schools and/or districts using an intervention. Scaling-up research commonly considers what it takes to expand and sustain an intervention in real-world settings (Fixsen & Blase, 2009). Scaling up requires a shift in ownership to be successful, and scaled-up reforms must bring about lasting change that goes beyond surface structures or procedures (Coburn, 2003). Scaling up must involve more than the spread of the surface-level aspects of a new approach, such as the routines, activities, and materials associated with it but also integration in the beliefs, norms, and principles underlying the practice. To reach scale, ownership of the practice must shift so that it is perceived to be an internally managed effort, by the school personnel who are implementing the practice. Ownership at this level is beyond typical buy-in or acceptance, requiring a deeper, broader,
substantial level of support (McLaughlin & Mitra, 2001).
Positive Behavior Interventions and Supports (PBIS)
Positive Behavior Interventions and Supports is an EBP used in over 24,000 schools (PBIS; pbis.org), thus providing a unique opportunity to examine implementation, sustained implementation, and scaling-up an EBP. Additionally, A growing body of empirical evidence demonstrates that schools who implement PBIS to criterion are more likely to experience positive outcomes (e.g., lower rates of problem behavior, higher achievement, higher emotional regulation; Bradshaw, Waasdorp, & Leaf, 2012; Childs, Kincaid, & George, 2010; Flannery, Fenning, Kato, McIntosh, 2014; Horner et al., 2009).
Instead of a prescribed program or scripted curriculum, PBIS is broken down into core features that are easily disseminated across a broad audience.
the adoption and implementation of a continuum of evidence-based interventions” (Sugai, 2000). Core features (i.e., kernels) are the “smallest functional units” needed to produce valued outcomes (Embry and Biglan 2008; Horner & Sugai, 2015). Emphasizing core features, rather than specific practices allow school personnel to tailor strategies and practices to the local context. The main features of PBIS are creating school climates that are (a) predictable, (b) prevention oriented, (c) positive, and (d) safe and the EBPs within a PBIS framework are organized across three tiers: (a) universal supports for all students (Tier I), (b) strategic support for small groups of students (Tier II), and (c) intensive supports for individual students (Tier III) (Figure 1).
The Tier I level focuses on establishing a positive school culture that includes (a) defining and teaching behavioral expectations, (b) implementing a system for reinforcing performance of these expectations, (c) establishing a system for correcting and
redirecting problem behavior, and (d) developing an efficient system to use data for
Figure 1. PBIS Framework (Walker et al., 1996; Sugai et al., 2014)
achieve this outcomes with at least 80% of the population (Horner & Sugai, 2015; Horner et al., 2010; Putnum et al., 2003; Lewis & Sugai, 1999; Sugai et al., 2014). Tier I is designed to be proactive for all members of the population and must be efficient and integrated with other elements of the school. The purpose of primary prevention (Tier I) is both to reduce problem behavior and promote positive behavior (Horner & Sugai, 2015).
Tier II (i.e., secondary, strategic) supports practices focus on a moderate level of intensity of supports that address students with ongoing problem behavior. Tier II supports are in addition to Tier I supports and are designed for students who would benefit from additional academic and behavioral supports. Tier II practices are designed to meet the needs of 10-15% of the students within a population who need a higher rate of recognition and more frequent behavioral prompts (Crone, Hawken, Horner, 2010;
Sugai, Simonsen, Bradshaw, Horner, & Lewis, 2014). Tier II supports typically are packaged and standardized for highly efficient implementation across multiple students (e.g., first step to success: Walker et al., 2009; Check-in/Check-out: Hawken et al., 2006).
Tier III (i.e., tertiary) practices are individualized and designed to provide students with comprehensive supports that are organized around behavioral, academic, mental health, physical, social, and contextual variables (Crone et al., 2010). This level of support is only designed for 5% or fewer students in a school and is implemented in conjunction with Tier I and Tier II supports. The high-intensity plans are monitored for both implementation and effectiveness (Pinkelman, 2014).
sustained implementation is largely dependent on not just implementation of the core features but also on the creation of systems that support implementation (Horner & Sugai, 2015). Systems around the policies, teams, data, and funding are integrated around improved outcomes, intervention practices to address student behavior, systems to support and sustain adult behavior, and the data needed for adaptation and continued improvement (Horner & Sugai, 2015; McIntosh, 2010).
PBIS is also an exemplar for its collection and use of data for decision-making. Implementation fidelity is systematically measured across all three tiers, where school teams use data to demonstrate improved outcomes (Newton et al., 2012) and sustained implementation (McIntosh et al. 2014). Where Implementation science (Fixsen et al., 2005) separates practices (i.e., what is done to change student behavior) from the
practices used to produce organizational change), PBIS integrates these practices into one systematic framework where data guides implementation efforts.
One example, the Tiered Fidelity Inventory (TFI; Algozzine et al., 2014) was developed to be a comprehensive fidelity of implementation tool. The purpose of the TFI is to provide school PBIS teams with a valid, reliable, and efficient measure to determine to what extent the core features of PBIS are being implemented to benefit students. The TFI has a variety of uses (e.g., needs assessment, guide for implementation, an index for sustained implementation). The TFI is intended to be used by school teams with the support of an external PBIS coach, who facilitates the administration, ensures accuracy of scoring, and guides the team through interpreting the results. Due to varying team
membership, the group assessing Tier I supports may be different from the assessors of Tier II and Tier III supports (McIntosh et. al., 2016)
Within the logic of PBIS implementation, students are the unit of impact (e.g., focus on improved outcomes), schools are the unit of intervention (e.g., creating tiered systems to support behavior), and districts are the unit of implementation (Horner & Sugai, 2015). District level leadership teams are the mechanism for broad and sustained implementation where they are responsible for actively managing and guiding the implementation process.
School Districts
Using PBIS as the EBP for the current study, the unit of analysis is the school
district. The relation between schools and districts (also known as Local Education Agencies, LEAs) has a long, complex history dating back to 1647. During that time, law first linked schools and communities when colonists in Massachusetts were worried about the influx of illiterate settlers. The Massachusetts Bay Colony enacted the General School Act of 1647, which required towns with more than fifty people to hire a teacher (Jernegan, 1918; Kaestle & Vinovskis, 1978). Three hundred and sixty years later, the US Department of Education oversees over 14,000 school 1s with 98,000 schools and
budgets totally over $500 billion annually (U.S. Department of Education, Institute of Education Sciences, National Center for Education Statistics). Our current educational
system has evolved from one-room schoolhouses into an array of simple tocomplex
systems, but the relationship between the school and school district remains.
A school district is a geographical and political unit for the local administration of education. The local level of control is the heart of the US education system where local communities operate schools, implement and enforce state laws and policies, develop and
and raise money to pay for schools. School districts hold a large responsibility for
implementation efforts. Not only are school districts mandated by policy (e.g., ESSA) but they also are responsible for using the allocated funds provided by the federal, state, and local government to operate schools for the benefit of local students. Moreover, the majority of districts in the US are very small. Almost two-thirds have less than fifteen hundred students and only about three percent have large enrollments (i.e., more than 15,000). Yes, nearly 45 percent of US students are educated in the in these large school districts (Supovitz, 2006).
School districts are typically managed with a school board, which provides oversight and governance for the district and its schools. The school board is at the top of the organizational hierarchy and comprised of elected or appointed members. The
authority of the school board differs between districts and states, and they are generally responsible for the appointment and dismissal of the superintendent. The superintendent is responsible for the management of several departments within the district and daily operations. Building principals manages the daily operations at the school level and report to the district superintendent.
Until recently, the primary purpose of district office was to sustain public support of education, negotiate with personnel unions, carry out mandates from the federal government, and other financial and legal issues (Louis, 1989). In the 1990s, many states began to require school districts audit school performance as a proxy measure for student performance (Lee, Seashore Louis, & Anderson, 2012). More recently, the role of school districts has expanded further to develop policies and practices that will support
significant predictor for student success, little is known about the influence of school districts on school and student level variables (Leithwood, 2012; Robinson, Hohepa, & Lloyd, 2009; Waters, Marzano, & McNulty, 2003) even though the success of schools to implement and sustain reform efforts typically rests with district-level facilitation
(Sanders, 2008, 2009). Research has notably struggled to fully explain this relationship.
Several studies have attempted to analyze the effects of district-level characteristics on school level outcomes, but many fall short with respect to theoretical guidance and typically fail to advance theory (Leithwood, 2010). Rorrer, Skrla, and Scheurich (2008) noted, “Intermittent attention to the district as the unit of study has left a void in our understanding of the complexities associated with the ability of district-level leaders to contribute to successful, systemic educational reform” (p. 307).
Although the relationship between school districts and schools has existed for many years, measuring how schools and districts work together (or sometimes against one other) is a relatively new phenomenon. Using the magnitude of research that exists in implementation, colleagues at the National Implementation Research Network (NIRN;
nirn.org) have created a measure with the suggestion that assessing district capacity may
be helpful in moving educational research forward. District Capacity
Schools may struggle with initial implementation (Vinciullo & Bradley, 2009;
Flaspohler, Duffy, Wandersman, Stillman, & Maras, 2008) or to sustain practices (Santangelo, 2009; McIntosh et al., 2013) without necessary external supports such as financial and professional opportunities. These necessities are often managed by school
“systems, activities, and resources that are necessary for schools to successfully adopt
and sustain” (p.5) practices. The District Capacity Assessment is based on the logic of
Implementation Science (Fixsen et al., 2005) and the key organizational activities
required for high levels of district capacity are organized by the Implementation Drivers
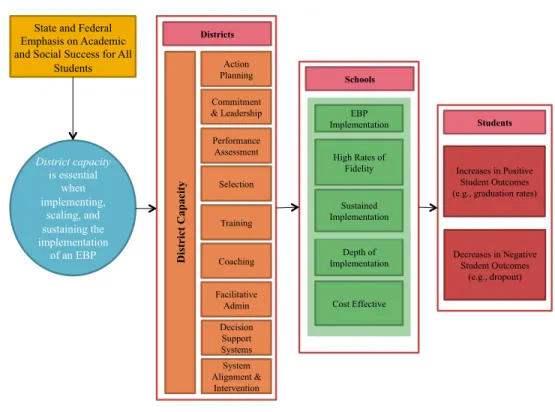
(i.e., leadership, competency, organization). The logic model for the District Capacity Assessment is provided in Figure 2.
Figure 2. Examining the relationship between district capacity and PBIS implementation The logic model provided is based on the hypothesis that investing at the district
level in the Implementation Drivers (i.e., leadership, competency, organization) based on
the extensive literature base in Implementation Science will improve implementation,
scaling, and sustaining of an effective practice, such as PBIS. To date, most research has
Commitment & Leadership System Alignment & Intervention Action Planning Performance Assessment Selection Training Coaching Decision Support Systems Facilitative Admin D is tr ic t C ap ac ity Depth of Implementation Sustained Implementation High Rates of Fidelity Districts Schools Students Cost Effective Increases in Positive Student Outcomes (e.g., graduation rates)
Decreases in Negative Student Outcomes (e.g., dropout) District capacity is essential when implementing, scaling, and sustaining the implementation of an EBP EBP Implementation State and Federal
Emphasis on Academic and Social Success for All
focused on school-level PBIS effectiveness, implementation, and sustainability factors, but relatively little is known about how district-level implementation efforts (e.g., capacity building) may influence implementation at the school-level. PBIS serves as one opportunity to do this analysis, given the large number of schools and the elements of Implementation Science that are reflected in the way PBIS has been implemented.
Study Purpose
The purpose of this study is to investigate the potential associations between district capacity and the initial and sustained adoption of Positive Behavior Interventions and Supports (PBIS). This study seeks to identify which elements of district capacity may be related to the implementation, depth of implementation, scale of implementation, and sustained implementation. Additionally, this study seeks to identify to what extent contextual factors (e.g., enrollment, urbanicity, per student expenditures) moderate these potential associations. This study will answer the following specific research questions:
Specifically, the research questions for this study are:
1. To what extent is the DCA moderated by contextual variables (e.g., number of schools per student expenditure)?
Hypothesis: Context does not influence DCA scores 2. How are scores on the DCA associated with initial (i.e., Tier I)
implementation of PBIS?
Hypothesis: There is a positive association between the DCA and the initial implementation of PBIS
Hypothesis: There is a positive association between the DCA and the depth of implementation of PBIS
4. How are scores on the DCA associated with the scale (i.e., the proportion of schools using PBIS) of PBIS?
Hypothesis: There is a positive association between the DCA and the scale of implementation of PBIS
5. How are scores on the DCA associated with the district-level sustained (i.e., years PBIS has been used within the district) use of PBIS?
Hypothesis: There is a positive association between the DCA and district-level sustained use of PBIS
CHAPTER II METHODOLOGY Participants
All districts in the United States meeting the following criteria were eligible for inclusion in the study: (a) a least one administration of the District Capacity Assessment (DCA; Ward et al., 2015 [Version 6.0]) from the 2014-2015, 2015-2016, or 2016-2017 school year and (b) at least one school within the district with at least one year of PBIS fidelity of implementation data reported during the DCA year. Using these criteria, a preliminary sequential cohort of 136 Districts and 1,492 K-12 schools were obtained.
Power analysis. A power analysis was conducted (Optimal Design 3.0 software; Spybrook, Bloom, Congdon, Hill, Martinez, Raudenbush, 2011) to determine the number of schools and school districts needed to be able to draw meaningful conclusions from the data about district capacity. Power analysis provides the minimum number of subjects required to detect any effects that result from the independent variable, and for this study district capacity based on: (a) the size of effect of district capacity in the population, (b) the type of statistical tests to be used (i.e., regression, multi-level modeling), and (c) the level of significance of the study (p < .05).
Power analysis protects again the probability of Type II error (i.e., failure to reject the null hypothesis even though it is false; Lee, 2000). For this study, power analysis provided a minimum number of schools required to detect the effect of district capacity, if related to PBIS implementation. It was determined that at least 80 school districts with at least five school districts would be required to detect an acceptable significance level
(p = .05), this study included 97 school districts with at least five schools, therefore the power requirement estimate exceeded the minimum.
Measures
Several measures were used in this study to examine the dependent and
independent variables of interest. Data for DCA and PBIS fidelity measures are reported to the Center on Positive Behavioral Interventions and Supports (PBIS; pbis.org) and were de-identified prior to any analyses.
District capacity assessment (DCA). The District Capacity Assessment (DCA; Ward et al., 2015) was used as a measure to assess the capacity of a local school district to support implementation of evidence-based practices, in this case PBIS. The DCA is a 26-item assessment, completed by a District Implementation Team (DIT) with a specific innovation (e.g., Positive Behavioral Interventions and Supports) in mind. The DCA is used to develop an action plan, monitor an action plan, and support the development of system for school districts to use support several initiatives and practices across schools. The DCA is grounded in the key organizational activities centered on the critical
Implementation Drivers (e.g., Leadership, Competency, and Organization).
Preliminary psychometrics of the DCA were completed using a sample of one hundred ninety-five DCAs within 18 states (DCA Technical Manual, 2016). According to Cronbach’s alpha coefficients of the District Capacity Assessment (DCA), the DCA composite scales, and the DCA subscales, the overall total DCA score has strong internal consistency with a Cronbach’s alpha coefficient of .908. The three composites also have adequate internal consistency: Leadership (α= .794), Competency (α= .791), and
subscale (α= .797), Coaching subscale (α= .832), and Decision Support Data Systems subscale (α= .818) all have adequate internal consistency. The Leadership subscale (α= .689), Performance Assessment subscale (α= .224), Selection subscale (α= .563), Training subscale (α= .606), and Facilitative Administration subscale (α= .678) are all below the adequate level of internal consistency (i.e., .700; Russell et al., 2016). Table 1 provides a synopsis of the DCA. For all multi-level model questions, the DCA scores are grand-mean centered based on the recommendations of Peugh (2010).
Table 2
District Capacity Assessment
Measure Type Purposes Completers Subscales
(Items) District Capacity
Assessment (DCA)
External or
self-assessment • Assess district capacity based on Active Implementation Frameworks • Guide implementation of effective innovations • Progress monitoring External and District Implementation Team (DIT) Leadership • Leadership (5) • Planning (3) Competency • Selection (2) • Training (2) • Coaching (2) • Performance Assessment (2) Organization • Decision Support (3) • Facilitative Administrati on (6) • Systems Intervention
PBIS fidelity measures. There are several measures available to schools using a PBIS framework. For this study, only Tier measures and the Tiered Fidelity Inventory (which measures Tiers one, two and three) are utilized. Each measure is described below.
Tiered Fidelity Inventory. (TFI; Alogozzine, et al., 2014) The TFI measures the extent to which Tier I (universal), Tier II (targeted) and Tier III (intensive) core features are in place and each scale can be assessed separately or together to evaluate overall implementation across all tiers. Tier I examine fifteen critical features of universal supports such as “Expected academic and social behaviors are taught directly to all students in classrooms and across other campus settings/locations.” Tier II evaluates thirteen core features of targeted interventions such as “Tier II team uses decision rules and multiple sources of data (e.g., ODRs, academic progress, screening tools, attendance, teacher/ family/student nominations) to identify students who require Tier II supports.” Tier III includes seventeen items (e.g., “Behavior support plans include a hypothesis statement, including (a) operational description of problem behavior, (b) identification of context where problem behavior is most likely, and (c) maintaining reinforcers (e.g., behavioral function) in this context” (Algozzine et al., 2010).
The purpose of the TFI is to provide a valid and reliable instrument that can be used over time to guide the implementation and sustained used to PBIS systems. The TFI is completed by a school Systems Planning Team (typically 3-8 individuals including a building administrator and an external coach or district coordinator). By design, the TFI is a more comprehensive and efficient measure of fidelity, with a common format, scale, and language to assess each tier, for schools at any level of implementation. There are several ways a school team can utilize the TFI: (a) as a complete index of all tiers to
establish implementation status and determine focus, (b) as a quarterly progress
monitoring tool to guide action planning for implementation of tiers of current focus, and (c) as an annual formative evaluation for tiers already in place. A Likert-type scale and detailed rubric are used by the school team to indicate if the content of each item is not implemented, partially implemented, or fully implemented and data sources are included to help teams evaluate each item objectively (McIntosh, et al., 2016).
A large-scale validation study of the TFI showed the overall internal consistency of the measure was .96. Alphas for Tiers I, II, and III were .87, .96, and .98, respectively,
providing evidence of strong internal consistency (citation). Pearson correlations were
calculated between the TFI and other existing measures of fidelity of implementation and all correlations were statistically significant. Table 3 provides a synopsis of the TFI. Table 3
Tiered Fidelity Inventory
Measure Type Purposes Completers Subscales (Items)
Tiered Fidelity Inventory (TFI)
External or
self-assessment • Assess fidelity for Tier I, II, and III • Guide systems
implementation • Progress
monitoring
External Coach & PBIS Teams Tier I • Teams (2) • Implementation (9) • Evaluation (4) Tier II • Teams (4) • Interventions (5) • Evaluation (4) Tier III • Teams (4) • Resources (3) • Support Plans (6) • Evaluation (4)
the critical features of SWPBIS (Sugai, Lewis-Palmer, Todd & Horner 2001). External reviewers interview administrators, teachers, and students and evaluate
permanent products (Horner et al., 2004). 28-items, divided into seven subscales are on the set. The subscales are: (a) expectations defined, (b) behavioral expectations taught, (c) on-going system for rewarding behavioral expectations, (d) system for responding to behavioral violations, (e) monitoring and decision-making, (f) management, and (g) district-level support. At the conclusion of the SET, an overall score as well as scores for each subscale are reported between the range of 0 and 100%. Schools with SET scores of 80/80 (i.e., minimum scores of 80% for expectations taught and 80% across all subscales) are considered to meet the minimum level of implementation for Tier I of PBIS.
Benchmarks of Quality (BoQ). The BoQ is a measure of Tier I PBIS used by many states across the US (Child, Kincaid, & George, 2011). Using data from 720 schools, a concurrent validity assessment showed significant correlations between the SET and the BoQ and while scoring on the BoQ varies across items and results in a maximum score of 107, 70% is considered reaching criterion for Tier I PBIS, similar to the 80/80 on the SET (Cohen, Kinkaid, & Childs, 2007).
Team Implementation Checklist (TIC). The TIC is a self-assessment tool that is used by PBIS teams to create action plans and improve implementation efforts. The TIC consists of 22 items across six subscales (i.e., establish commitment, establish and maintain team, self-assessment, establish school-wide expectations, prevention systems, classroom behavior support systems, and capacity for function-based support). In an analysis of the BoQ and TIC, Vincent and Tobin (2012) showed that 180 of 448 schools that scored at least 80% on the TIC, also scored above 70% on the BoQ.
Self-Assessment Survey (SAS). The SAS is designed to be completed by all staff, annually during the spring to help PBIS teams develop action plans for implementation. The SAS is a 20-30 minute 46-item assessment across four domains (i.e., school-wide discipline systems; non-classroom management systems (e.g., cafeteria, hallway, playground); classroom management systems; and systems for individual students with the most challenging behavior (Sugai, Horner & Todd, 2003).
Benchmarks for Advanced Tiers (BAT). The Benchmarks for Advanced Tiers (Anderson et al., 2009) is a comprehensive assessment of Tier II and Tier III supports completed by a school team. Specifically, the BAT looks at the systems, data
management, and practices essential for implementation and results in an action plan needed for furthering implementation efforts (Anderson & Borgmeier, 2010).
School district demographics. School district characteristic data available from the National Center for Educational Statistics (NCES, 2014-2015 school year; fiscal data from 2013-2014) were used to determine district demographics including: (a) number of schools, (b) number of students, (c) full-time equivalency (FTE), (d) student-to-teacher ratio, (e) percent of English Language Learners, (ELL), (f) percent of students with an Individualized Education Plan (IEP), (g) per student expenditure, (h) state, and (i) locale (i.e., city, suburb, town, rural).
Additional Variables. Two additional variables were also created. The first one was created by using the “first year with data” retrieved from the PBIS Technical
Assistance Center to create a continuous variable denoting the length of time between the first year and the present. Additionally, the proportion of schools using PBIS was created
schools within a district. Statistical Analysis
All analyses used the Statistical Package for Social Science (SPSS; IBM SPSS Statistics for Windows, Version 24.0). Before addressing each research question, school district demographics and created variables were analyzed for any central tendency issues. Following guidelines provided by Chen and colleagues (2017), Tabachnick and Fidell (2007) and Howell (2007) proportional and moderately or substantially negatively skewed data were transformed using the arcsin square-root, square-root, and logarithmic functions (respectively). No positively skewed data was present. Missing data was not present given the selection criterion that made the presence of data necessary for inclusion.
Exploratory factor analysis (EFA). The purpose of the EFA was to explore the underlying constructs of the DCA to determine the scores, or sets of scores, that might be used to address the research questions in the study. The EFA utilized all 136 school
districts from the sequential cohort from the years 2014-2015, 2015-2016, and 2016-2017. All 26 items in the DCA were included in the EFA. For all 136 districts, a score of 0, 1 or 2 for each item reflected, Not in Place Partially in Place or Fully in Place. Before
analysis, each item was theorized to reflect the Implementation Drivers of Leadership, Organization and Competency and the EFA would allow for exploration on if these constructs. Principal axis factoring (PAF) with oblique rotation was specified because of the underlying theory regarding the structure of the DCA was hypothesized and because the assumption that the factors would be intercorrelated. The results of the factor analysis
were compared with the factor analysis results provided in the District Capacity Assessment Technical Manual (Russell et al., 2016.)
Analytic Approach
To explore the extent to which district capacity and the implementation of PBIS vary in relation to one another, a combination of regression and multi-level modeling was utilized. Each research question investigated for its appropriateness for the use of a multi-leveled approach. If the research question included more than one level of data (school and school district data) and had a significant ICC then multilevel modeling was used. Otherwise traditional OLS was used.
Multilevel modeling. Hierarchical (e.g., nested, multilevel) levels of grouped data
are a relatively common phenomenon in the social sciences (Osborne, 2000; Woltman, Feldstain, MacKay, Rocchi, 2012). For several questions in this study, a multi-level approached was favorable due to the nested nature of the extant data set (i.e., schools nested in districts). A primary difference between ordinary single-level regression, and multi-level modeling is the ability to estimate one or more of the coefficients in the model as fixed or random. Where a fixed effect has only a single value in the model and is applied to all level-1 units, the random effect can vary between the level-2 units. With regards to this particular study, multi-level modeling allow to control for the grouping variable, in this case, the district.
The process for multi-level modeling is very similar, regardless of the research question. First, the unconstrained or null model is created, followed by the addition of any level-1 predictor or control variables, followed by any level-2 covariates, and lastly
included two procedural steps: (a) the unconstrained (null) model assessed whether there was variability in the outcome variable at the district level (thus necessitating a multi-level modeling approach) then (b) models examined relationships between district capacity and the outcome variable of interest.
Unconstrained model testing. First unconditional model was examined before
any further analysis was completed. The first step includes calculating as an intra class correlation coefficient (ICC). A significant ICC signals a clustering effect, giving rise to correlated error, a violation of ordinary regression models (thus necessitating multi-level modeling techniques). The equation that was used to calculate the ICC is provided in Equation 1.
Equation 1: Intra class correlation
𝜏!! 𝜎!+𝜏
!! 1
Within this equation, 𝜏!! is the level-2 intercept variance and 𝜎! is the level 1 variance.
A statistically significant 𝜏!! signaled the need for multilevel modeling.
The analytic approach (including if multi-leveling or ordinary least squares regression was used) for each specific research question is described in the following section.
Research question one. To what extent is the DCA score moderated by contextual variables (e.g., number of schools, per student expenditure)?
All 136 school districts with a DCA score and no missing data were eligible to be included in this study. The results from the EFA (discussed in the following chapter) justified the DCA be examined as a one factor, or total score for this question and all subsequent analyses involving DCA scores. The independent variable for research
question one included all the school district demographic data and research created variables. The dependent variable for research question one was the DCA score. Bivariate correlations and regression analyses were examined between the contextual variables and the total DCA score.
Research question two. How is the DCA score associated with Tier 1 PBIS level of implementation?
Participants for this part of the study were school districts with DCA scores and at least one school with a Tier I, TFI score or a SET. The total DCA score was the
independent variable and only districts were retained if it was clear they were using the DCA to guide the implementation of PBIS or (some iteration of a MTSS with behavior supports). The dependent variable was the Tier I Implementation score that was either the TFI or the SET. Because both of these are reported on a continuous, proportional scale of 0 to 1.0 this variable was transformed using the arcsin-square root transformation as suggested by (Chen et al., 2017) for proportional outcome measures.
First, the unconditional model (equation 2) was modeled. If the ICC is significant then multi-level modeling is favorable (as outlined). If the ICC is not significant, ordinary regression techniques would be utilized, next the DCA total score was modeled. Specifics about each equation are provided in equations two, three and four.
Model 1. The Unconditional model
Level 1: 𝑇𝑖𝑒𝑟𝐼!"=𝛽!!+ 𝑟!" 2
Level 2: 𝛽!!=𝛾!!+ 𝑢!!
𝑇𝑖𝑒𝑟𝐼!" is the Tier I score for i school nested in j district; continuous scale 𝛽!! is the intercept for the jth district
𝑟!" is the random error associated with school i in j district 𝛾!! is the overall mean intercept
𝑢!! is the unique random effect of district j (error) on 𝛽!!
The level-1 error (𝑟!") is expected to follow a normal distribution with a mean of 0) and a variance of 𝜎! (see equation 3; Sullivan, Dukes, and Losina, 1999; Woltman, Feldstain,
McKay, Rocchi, 2012).
𝐸 𝑟!" =0;𝑣𝑎𝑟 𝑟!" =𝜎! 3
Model 2. DCA, Total Score
Level 1: 𝑇𝑖𝑒𝑟𝐼!"=𝛽!!+ 𝑟!" 4
Level 2: 𝛽!!=𝛾!!+ 𝑢!!
Mixed Model: 𝑇𝑖𝑒𝑟𝐼!"=𝛾!!+𝛾!"𝐷𝐶𝐴+ 𝑢!!+𝑟!"
Following a significant result but because there is a lack of a clear direction due to theory or from the EFA, correlations between the DCA scores and outcome measure were assessed to determine if any post hoc analyses would be practical. Parameter estimates, standard, errors, and model fit statistics are reported in the results section.
Research question three. How is the DCA score associated with Tier II/III PBIS level of implementation, when Tier I is achieved?
Participants for this question were the same as research question two but were restricted to schools that met Tier I criterion on the TFI or SET. The dependent variable for this question was labeled depth for schools that were attempting (scores greater than .00) to implement Tier II on the TFI or the BAT. ‘Depth’ was coded as a dichotomous
variable where: 1 = Yes, Tier II score and 0 = no Tier II score. At the time of this study, not enough scores were available to analyze Tier III adoption.
Similar to research question two, the unconditional model (equation 2) was first modeled followed by the total DCA score. To answer this question, link function estimation procedures were used to reflect the binomial distribution of the outcome variable. Specific equations are provided in equations five and six.
Model 1. The Unconditional model
Level 1: η 𝑑𝑒𝑝𝑡ℎ!" = 𝛽!! 5
Level 2: 𝛽!!=𝛾!!+ 𝑢!!
Mixed Model: η 𝑑𝑒𝑝𝑡ℎ!" =𝛾!!+ 𝑢!!+𝑟!"
where:
η = the link function
η 𝑑𝑒𝑝𝑡ℎ!" is the probability of adopting PBIS Tier II; dichotomous scale 𝛽!! the log odds of a school to adopt/not adopting Tier II
𝑢!! the residual term where 𝑁 ~ 0,𝜋!!
Model 2. DCA total score
Level 1: η 𝑑𝑒𝑝𝑡ℎ!" =𝛾!!=𝛽!! 6
Level 2: 𝛽!!=𝛾!!+ 𝑢!!
Mixed Model: η 𝑑𝑒𝑝𝑡ℎ!" =𝛾!!+ 𝛾!"𝐷𝐶𝐴+ 𝑢!!+ 𝑟!"
The results report the log-likelihood statistic, parameter estimates, standard error, and model fit statistics.
Research question four. How is the DCA score associated with the proportion of schools within a district and Tier 1 PBIS level of implementation?
had at least four schools with any fidelity measure. The dependent variable for this question was labeled scale, which derived from the quotient of the number of schools within a district with a fidelity measure by the total schools with the district. This question was analyzed with total number of districts. Ordinary least squares (OLS) regression analysis was used in this analysis because all the data were organized at the school district level, negating the necessity for a multi-leveled approach.
Research question five. How is the DCA score associated with District-level sustained use of PBIS?
All participants were included in this part of the study. The dependent variable was labeled sustain and was created by taking the “first year with data” for the school. The dependent variable for this question was labeled scale, which derived from the quotient of the number of schools within a district with a fidelity measure by the total schools with the district. This question was analyzed with total number of districts from 4-136 as well as subsets of 10-20 and 20-30 total schools. Traditional regression was used to examine this question because all the data was at the district level. Equations for the unconditional model and specified model are provided in equations labeled six and seven.
Model 1. The Unconditional model
Level 1: 𝑆𝑢𝑠𝑡𝑎𝑖𝑛!"=𝛽!!+ 𝑟!" 6
Level 2: 𝛽!!=𝛾!!+ 𝑢!!
Mixed Model: 𝑆𝑢𝑠𝑡𝑎𝑖𝑛!"=𝛾!!+ 𝑢!!+𝑟!"
where:
Level 1: 𝑆𝑢𝑠𝑡𝑎𝑖𝑛!"=𝛽!!+ 𝑟!" 7
Level 2: 𝛽!!=𝛾!!+ 𝑢!!
Mixed Model: 𝑆𝑢𝑠𝑡𝑎𝑖𝑛!" =𝛾!!+ 𝛾!"𝐷𝐶𝐴+ 𝑢!!+𝑟!"
Summary
At this time, there is a major emphasis on implementation of effective practices and to date, this emphasis has been on the quality of the practices and not the capacity of the host environment to support the implementation of the practices. The lack of
empirical evidence examining the link between schools and the host environment (i.e., school districts) these methods, along with any results, are not meant just provide such evidence but to also help guide the field in a clear direction.
CHAPTER III RESULTS
The purpose of this study was to explore the potential associations between district capacity and the implementation of PBIS to strengthen our knowledge about the relation between school districts and schools. Research question one examined the influence of district contextual variables on the District Capacity Assessment for the purposes of helping to establish if control variables were needed for the subsequent research questions. Research questions two, three, four, and five addressed the association between district capacity and the initial, depth, scale, and sustained implementation respectively.
District capacity
Before addressing the specific research questions, an Exploratory Factor Analysis (EFA) was completed using the items on the DCA to determine how the DCA should be used to address the research questions. The data was screened for univariate outliers and missing data with no cases found. The minimum amount of data for a factor analysis was satisfied with a sample size of 142, providing a ratio of over five cases per variable. However, a ratio of over 10 cases per variable (i.e., 260+) is ideal for optimal analysis.
Factor analysis. Principal axis factoring (PAF) with oblique rotation was specified because of the underlying theory regarding the structure of the DCA was hypothesized and because the assumption that the factors would be intercorrelated. Initially, the factorability of 26 items from the DCA were examined and it was observed that 10 of the 26 items correlated at least .3 with at least one other item. This low level of correlations reveals an orthogonal rotation may be more appropriate. The