Safer JourneyS
for people who cycle
cycling Safety panel Draft report
anD recommenDationS
25 September 2014
ConSultation DoCument
Send your comments to: [email protected]
By 24 october 2014
Chairman’s Foreword 5
executive Summary 6
Cycling safety and participation
are inextricable 6
Growing cycling has broader societal benefits 6 understanding real and perceived
injury risk 6
a Safe System approach 7
overview of recommendations 8
Cycling in new Zealand 9
international comparisons 9
Cycling trends 9
the Cycling Safety panel 12
process and timeline 13
using the Safe System Framework to develop
our recommendations 13
Draft recommendations 15
Safe System enablers 15
1. planning and investment - safe provision for active modes is considered at all stages of road transport planning and investment 15 2. leadership and accountability
- establish strong leadership and
accountability practices for safe cycling 18 3. information and Data Collection -
information collection systems relating to cycling safety be improved
and expanded 19
Safe System approach
- roads and roadsides 21
4. minimise crash risk - rCas take action to minimise conflict (crash risk) between people who cycle and other road users,
especially heavy vehicles 21
5. road Controlling authorities provide safe on-road connections to the nZ Cycle trail and other nationally significant cycle trails 24
Safe Speeds 25
6. manage motor Vehicle Speed
– to minimise crash risk and severity 25
Safe road use 26
7. minimum passing distances – mandated via the land transport act
and regulations 26
8. School travel plans and Cycle Skills training – increased support from the
transport agency and local government 28 9. road user behaviour and awareness –
the transport agency to develop programmes to improve road user (both drivers and cyclists) behaviour
and awareness 31
10. Corporate responsibility - WorkSafe new Zealand and aCC and other stakeholders encourage corporate responsibility for employed drivers and contractors so that they practise safe
behaviour towards cyclists 32
11. legislative review – the ministry of transport refresh its legislative review of provisions
relating to cycling. 33
Safe Vehicles 34
12. truck Side under-run protection - investigation of side under-run protection and other vehicle features to minimise the risk to cyclists from heavy vehicle crashes 34 13. bicycle lights and e-bikes – the transport
agency adopt improved standards for bicycle lights and the european union
standard for e-bikes 36
measures of success
– evaluation and monitoring 37
appendix i: taking a Safe System approach 39
appendix ii: road user atttitudes 42
Cyclists don’t pay 42
Cyclists are a law unto themselves 42 What cyclists would like drivers to know 43 What drivers would like cyclists to know 43
Glossary 44
Defining and manag ing risk 44
Key Strategic Documents 44
What is Kiwirap? 44
one network road Classification (onrC) 45 references 46
it has been my pleasure to chair the Cycling Safety panel in developing the recommendations in this document.
the Cycling Safety panel (“the panel”) was created in response to the 2013 Coronial inquiry1 that
investigated 13 recent cycling fatalities in 2012 and came to the conclusion that work needed to be done to investigate ways in which cycling on new Zealand roads could be made safer. as a result of the Coroner’s recommendation the new Zealand transport agency established the panel, which is composed of ten experts in the fields of cycling, transport and human behaviour. the panel has been tasked with developing innovative, comprehensive and practical recommendations for how central and local government can ensure on road cycling is provided as a safe transport option. i believe this document succeeds in meeting the challenge presented to the panel and the implementation of our recommendations will, over time, result in a material improvement in both the reality and perception of cycling as being a safe transport option.
1 matenga (2013)
as a regular cyclist i believe making our roads safer for cycling will encourage more people on to their bikes, especially school children. this will bring wider benefits that include reducing road congestion and improving community health, as well as lowering the social and financial costs of serious accidents and fatalities. my thanks go to a very committed and
knowledgeable panel and the excellent support we have received from transport agency officials. the information we have been provided on where and why cycle crashes happen has been invaluable in the development of this document. i am confident our recommendations will be well received by central and local government and look forward to their implementation over the coming months and years.
Richard Leggat
Chair, Cycling Safety Panel
Chairman’S ForeWorD
…WILL, OveR tIme, ResuLt In a mateRIaL
ImpROvement In bOth the ReaLIty
and peRceptIOn Of cycLIng as
beIng a safe tRanspORt OptIOn.
over the last decade annual cycling deaths in new Zealand have averaged between nine and ten people, with some annual fluctuations, meaning cyclists made up approximately three per cent of on-road fatalities over that period. this is disproportionate to their participation in the roading network where cycling comprises 1.6 per cent of total time travelling. in terms of serious injury crashes cyclists now comprise around eight per cent of all serious injuries in motor vehicle crashes. the panel was created to develop an innovative, comprehensive and practical set of recommendations for how central and local government can ensure that on road cycling is provided for as a safe transport option. the panel’s measure of success will be a reduction in the death and serious injury (DSi) rate per million kilometres cycled.
the panel comprises ten cycling and road safety experts. this document sets out the draft recommendations for consultation with the wider Cycling reference Group, and will be discussed at a Summit on 17 october 2014. the panel will submit its final report and recommendations to the associate minister for transport in mid-november 2014.
cycling safety and participation
are inextricable
Globally, cycling is seeing a resurgence of growth in many developed countries that have previously been regarded as ‘cycling unfriendly’. new Zealand is starting to see this trend as well, and the panel is concerned that, without adopting many of the recommendations in this report, we will see increases in cycling deaths and serious injuries as more people choose to cycle. the panel also believes improving both the real and perceived safety of cycling will increase cycling participation, which as well as safety benefits has wider benefits for the community.
growing cycling has broader societal
benefits
increasing the perceived and actual safety of on-road cycling and the ensuing community benefits need wider recognition by new Zealand society. these benefits include: • reduced congestion at peak times
in major urban centres
• health benefits, particular reduced obesity and improved cardio-vascular health • reduced motor vehicle emissions • improved people-friendly environments • reduced road maintenance costs
• economic benefits that stem from affordable travel, healthier people and reduced congestion. the panel’s vision is ambitious, as all vision statements should be. We are aiming for ‘a safe road network with zero fatalities and reduced serious injuries for
people who cycle’. to achieve this vision we must
understand the ‘cycle safety system’ and the key direct and indirect factors that ultimately contribute to cycle casualties (an explanation is provided in appendix i).
understanding real and perceived
injury risk
only one third of on-road cycle crashes resulting in a hospital admission involve a motor vehicle (mV); the panel is concerned with both cycle/ mV crashes and cycle only crashes. however, the severity of crashes involving a motor vehicle are typically greater than cycle only and the panel has focused more on this type of crash. the information provided for cycle/mV crashes has shown the panel where the majority of cycle/mV crashes are occurring and the nature of these crashes. the panel acknowledges more information on non-motor vehicle crashes is required to be able to address more
three points stand out for the panel from the evidence we have considered:
• the majority of motor vehicle/cycle crashes occur at urban intersections and driveways. • usable road shoulder width is a key factor
in the incidence of rural accidents. • heavy vehicles, especially trucks, are
overrepresented in cycling fatalities. this information and the panel’s collective understanding of the new Zealand cycling and transport landscape have been influential in the development of a set of recommendations we believe will ultimately help us achieve our vision.
a safe system approach
We have used the Safe System approach and developed recommendations under the general Safe System enablers and the four pillars of the Safe System as set out in the Government’s Safer Journeys strategy. a summary of the panel’s key priorities is given below. the details of the recommendations under each of these areas are provided in the body of this report.
• make active transport needs (cycling and
walking) a greater priority in all transport planning
and investment decisions. this needs to be
reflected in the Government policy Statement on land transport, the national land transport programme, the transport agency’s economic evaluation manual and Councils’ long term plans. • establish clear leadership and accountability
for improving cycling safety. promote shared responsibility for improving cycling safety across the ministry of transport, nZ transport agency, nZ police, accident Compensation Corporation, local government, freight and fleet operators, aa and its members, other motorists, people who cycle and other relevant stakeholders.
• system and user Information: improve quantity
and quality of data collection, research, sharing and
analysis. use this information to set targets; and strengthen processes for monitoring and evaluation.
• safe Roads and Roadsides: accelerate the
provision of completed, fit for purpose cycle networks. Where appropriate, provide separate infrastructure for cycling away from heavy vehicles and/or high-speed traffic to reduce conflict points, and where this is not currently possible, manage speeds and consider providing temporal separation. undertake research on continental european design guidelines for roundabouts.
• safe speeds – endorse the Safer Speeds
programme so that actual travel speeds are safe for the road function, level of safety design and use.
• safe Road use: increase the delivery of cycling
skills training, including on-road safety training in schools, in conjunction with development of School travel plans. improve cyclist awareness of high risk situations. promote cycling – it is generally safer for all when there are more bikes on the road, and injury risk is higher when bikes are scarce, but promotion of cycling must go hand in hand with improvement in the road environment. improve mutual knowledge and understanding between drivers, especially professional drivers, and people who cycle. explore the introduction of mandatory minimum passing distances for motor vehicles overtaking cyclists.
• safe vehicles: explore the introduction of
mandatory truck side-under-run protection. explore the introduction of a higher standard of bike lighting.
safe system enabLeRs
1. Safe provision for active modes is considered at all stages of road transport planning and investment and given higher priority status.
2. establish strong leadership and accountability practices for safe cycling
3. improve and expand cycling information collection and its use in policy and infrastructure development safe ROads and ROadsIdes
4. take action to minimise conflict (crash risk) between people who cycle and other road users, especially heavy vehicles and at intersections – for instance, through:
- separation of high volume freight traffic and cyclists
- intersections, especially roundabouts, designed to be safe for people who cycle - complete, connected urban cycling networks
5. provide safe on-road connections to the nZ Cycle trail and other nationally significant cycle trails safe speeds
6. manage motor vehicle speeds to minimise cycle crash risk and severity safe ROad use
7. mandate minimum passing distances for motor vehicles overtaking people on cycles – 1 metre where speed limits are below 60 km/h and 1.5 metres where speed limits are 60 km/h or over 8. increase support for school travel plans and cycle skills training
9. Develop programmes to improve road user (both motorists and cyclists) behaviour and awareness 10. encourage corporate responsibility for employed drivers and contractors
so that they practise safe behaviour towards cyclists.
11. refresh the legislative review of regulatory provisions relating to on-road cycling. safe vehIcLes
12. investigate side under-run protection and other vehicle features to minimise the risk to cyclists from heavy vehicle crashes
13. adopt improved standards for bicycle lights and the european union standard for e-bikes
oVerVieW oF
almost everyone in new Zealand over 40 years old can remember when the bike sheds at their school were full. now there are only a few schools with bike sheds and even fewer of these are full. the decline in cycling to school has been mirrored in cycling to work but is more obvious because such a high percentage of school children used to cycle. between 1990 and today the numbers cycling to school have declined by approximately 75 percent. While this has meant the numbers being injured and killed have declined over all (the collective risk), the individual risk has actually risen, and society is missing out on the other benefits cycling can bring.
International comparisons
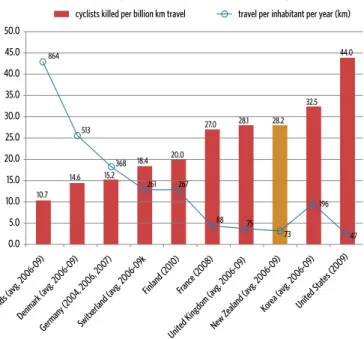
looking at cycling safety internationally - where does new Zealand sit? the figure bellows shows average distances cycled per person (the blue line) against the number of cyclists killed per billion kilometre of travel (bars). our performance sits between the united Kingdom and France. the graph indicates a positive relationship between increasing cycle travel and increasing safety. the panel wishes to stress that while cycling could and should be made safer in new Zealand, it is not an inherently dangerous activity. there is approximately one fatality for every 2 million hours cycled. the perceived lack of safety is, however, a significant barrier to the uptake of cycling.
cycling trends
the period since 1990 has seen a large increase in the new Zealand population, a great deal of ‘urban sprawl’ and a massive increase in car ownership due to the easier availability of cheaper imported used cars. nevertheless, despite popular perception, commuting distances remain very viable for cycling in nZ, with median distances representing under a 30 minute bike ride in our three largest urban regions. however, over the last five years many western cities, with the private car previously the dominant mode of transport, are seeing resurgence in cycling. a combination of traffic congestion, health and obesity
CyClinG in neW ZealanD
0 100 200 300 400 500 600 700 800 900 1000 10.7 864 513 368 261 267 15.2 27.0 28.1 28.2 32.5 Denmark (av g. 2006-09 ) Germany (2004, 2006, 200 7) Switx erland (av g. 2006-09kFinland (2010)France (2008)
United Kingdom (av g. 2006-09 ) New Zealand (av g. 2006-09 ) Korea (av g. 2006-09 ) United States (2009 )
cyclists killed per billion km travel travel per inhabitant per year (km)
0.0 5.0 10.0 15.0 20.0 25.0 30.0 35.0 40.0 45.0 50.0
Bicycle travel per inhabitant per year (km) and Number of cyclists killed per billion km of bicycle travel
14.6 20.0 88 75 73 196 47 18.4 Netherlands (av g. 2006-09 ) 44.0
figure 1: Relative safety of cycling compared to cycling activity: (axel Wilke). the cycling fatality risk in new Zealand is nearly three times that in the netherlands per billion kilometres travelled. On average dutch people cycle about 12 times further per year than new Zealanders (864 kilometres compared to 73)
issues, environmental concerns and the economic benefits of cycling have seen a number of high profile politicians successfully promote increased cycling. london, new york and melbourne are three very good examples of political leadership twinned with infrastructure improvements resulting in significant growth in cycling participation (albeit from low bases). in new Zealand, the cycling infrastructure is, in general, piecemeal and of variable quality and political leadership is only now becoming apparent. Despite this, new Zealand is also seeing an increase in cycling numbers. increasing pressure on available road space often causes tension between different road user groups and undue risk-taking. Causes of disharmony include cyclists running red lights and riding on footpaths, or motorists passing people on cycles at unsafe distances. Consequently there is work needed in the ‘Share the road’ space to ensure that all road users respect both the rules and other road users. along with the growth in on road cycling numbers for commuting, sport and recreation, new Zealand is also experiencing very strong growth in off road recreational cycling and mountain biking. the 2009 Job Summit led to the creation of nga haerenga, the nZ Cycle trail. this network of 23 Great rides and over 2,000 kilometres of connector routes has provided safe, off road cycle paths and roads that have given many thousands of new Zealanders a reason to get back on their bikes. Cycling surveys consistently state the number one reason people don’t cycle, or don’t let their children cycle, is they believe it is too dangerous. this creates the most important feedback effect in nZ’s cycling system at the moment – any increase in cycling leads to greater reporting of injuries and deaths, with a strong dampening effect on further growth. We have seen the nZ Cycle trail attract people who, currently, would not dream of riding in the town or city where they live because they perceive it to be too unsafe. new Zealand is seeing some growth in cycling commuters but, to see material increases,
people need to feel safer than is currently the case.
60 50 40 30 20 10 0 1985 1990 1995 2000 2005 2010 2015
Minutes per person per week
Time spent cycling per person
5-12 13-17 18+
Copenhagen’s political Will
Copenhagen today is the result of an entire generation of planners and politicians who have understood the importance of re-establishing bicycles on the urban landscape. Commuting by bike is at 36 per cent but the goal is 50 percent. this goal is taken very seriously and $50 million was spent in 2013 towards achieving this goal. however, success is largely dependent upon political will, and Copenhagen is currently suffering stagnation from City hall. one third of short trips are still taken by car even though Denmark is one of the most expensive countries to buy a privately owned motor vehicle due to taxes and registration fees.
the success of the hastings model community project, where cycling crashes have declined and people’s perceptions of the safety of cycling have improved, is a good example of what can be achieved, although it should be noted that ongoing investment is required to continue to grow the numbers of people cycling, and to have them cycle more often. the plans Christchurch has for an extensive integrated network of cycleways and the recent opening of the auckland cycleway extension through to the CbD are evidence that councils and government are starting to take a more
proactive role in providing fit for purpose infrastructure
for cycling. but there is still a very long way to go to get close to catching up with the northern europeans. it is easily forgotten that the netherlands was not always a cycling utopia. Cycling became so marginalised by modern urban development in the post war period, and traffic such a dominant force, that 3,300 people were killed by motor vehicles in 1971. What makes the Dutch different from their peers was their refusal to accept road deaths as the price of efficiency. they were also outraged at the space taken up by motorists. Street protests with the powerful message ‘Stop de Kindermoord’ (stop child murder) coincided with the 1973 oil shocks. people enjoyed the traffic-free streets of car free Sundays, which led to city centres being made permanently car free2.
mass protests continued to demand dedicated cycling infrastructure. it is now an integral part of the
netherlands’ transport policies. Child road deaths
have gone down to 14 in 2010 from over 400 in 1971. an important difference between the Dutch protests and other cycling advocacy campaigns is that Stop de Kindermoord was not about cycling versus cars, it was about child safety on roads, a topic well understood by the wider public. Cycling infrastructure was the most effective policy response to that problem, along with child-friendly street designs, and improved facilities for walking. the Dutch cultural shift took approximately ten years, undertaken by parents and professional campaigners and resulted in embedded
cycling policy at a national government level. this
2 Dutch campaigners explain why the netherlands is now so cycle-friendly http://lcc.org.uk/pages/holland-in-the-1970s
example demonstrates the ways that growing cycling is linked to advocacy and political will in a potentially helpful feedback process that shifts both the environment and cultural norms. rather than waiting for the protests to occur, in new Zealand, policy makers have a golden opportunity tostrengthen these processes through up-front investment.
until very recently, new Zealanders have
responded to safety fears by avoiding cycling. this response is heightened among parents of school-age children. new york and london are among many major cites transforming their congested roads into cycle friendly environments. urban cycle advocates, who believe that new Zealand is capable of joining the cycle friendly countries of the world, are becoming more vocal and visible. in summary, cycling injury and growth in cycling participation are inextricable, with the potential to achieve potentially helpful feedback patterns through policy intervention: initially embedding safety and cycling growth through infrastructure, followed by achieving safety in numbers and shifting social norms. Finally, the intertwined nature of cycling participation and safety means future targets for cycling mode share (visioning) and understanding the steps to reach them (backcasting) are crucial for improving cycling safety. Coroner Gordon matenga noted in his review of cycling safety in new Zealand that ‘a rethink of cycling safety in new Zealand is required, that attitudes both of motorists to cyclists and cyclists to motorists need to
change’3. the panel considers that this rethink needs
to extend beyond cyclists and motorists to planners, engineers, government officials, police officers, schools, parents, councillors, corporations, employers and employees and anyone who uses the road network.
the Cycling Safety panel comprises 10 experts from
across the cycling and road safety spectrum. Richard Leggat(Chair) Chair of the new Zealand Cycle trail and board member of bike nZ simon Kennett
active transport and road Safety Coordinator at Greater Wellington regional Council dr glen Koorey
Senior lecturer in transportation engineering at the university of Canterbury
dr hamish mackie
human factors specialist, mackie research & Consulting
dr alexandra macmillan
Senior lecturer in environmental health at the Department of preventive and Social medicine, university of otago
mike noon
General manager motoring affairs, automobile association
marilyn northcotte
regional Coordinator of pedal ready cycle skills training programme Wellington sarah ulmer
‘ambassador’ for the new Zealand Cycle trail, olympic cycling Gold medallist axel Wilke
traffic engineer and transport planner specialising in sustainable transport, ViaStrada limited
professor alistair Woodward
professor of epidemiology and biostatistics at the university of auckland
the panel has met five times throughout 2014 and focussed on very specific issues and their contributing factors.
april
Cycling Safety Summit – broad exploration of cycling specific issues with the wider cycling community. may
panel meeting – analysis of rural specific issues June
panel meeting – analysis of urban and school specific issues
July
panel meeting – examination of obstacles to cycling in the legislative and investment process. analysis of a selection of international cycling strategies and action plans.
august / septemebr
Consultation with local Government new
Zealand, the road transport Forum and the police regarding draft recommendations to date. Sharing of thinking on proposed recommendations with representatives from the cycling advocacy groups, and prioritisation of actions.
a second Cycling reference Group Summit will be held in Wellington on 17 October to discuss this draft report, with written submissions closing on 24 October. after consideration of submissions, the panel will submit its final report and recommendations to the ministry of transport (mot), nZ transport agency (the transport agency) and local Government new Zealand (lGnZ) by mid-november. the ministry and the transport agency will advise the minister of transport on the implications of the recommendations, and standard Cabinet and public consultation processes will need to be followed in for major policy or regulatory decisions.
it is envisaged that a Cycling action plan under the Safer Journeys Strategy could be developed with more specific actions, timeframes and targets and be included in the Safer Journeys action plan 2016-2020, proposed to be developed in 2015 (see appendix i).
using the safe system framework to
develop our recommendations
the panel has adopted the safe system approach, in analysing the issues relating to cycling safety and in developing recommendations, as signalled in its terms of reference. the Safe System approach views the road transport system holistically by addressing the interactions between the ‘elements’ of
• road user
• the road and roadside • speed and
• the vehicle.
these elements (or ‘pillars’) are often shown as follows, with the Safer Journeys Vision at the centre:
it is the responsibility of all those involved with the design, management and use of the road system to understand this interaction. the ‘principles’ of the Safe System approach involve recognition of • human fallibility
• human vulnerability
• shared responsibility among system designers for reducing deaths and serious injuries and • co-ordinated efforts to strengthen
all parts of the system.
more detail is provided in the table below.
For more on the Safe System approach see appendix i and www.saferjourneys.govt.nz .
the panel is considering making the following
recommendations. they are divided into “system wide” recommendations to enable implementation under the Safe System and specific recommendations relating to each of the Safe System pillars described on page 13.
safe system enablers
1. planning and Investment - safe provision for active modes is considered at all stages of road transport planning and investment
the panel is concerned that cycling is often an
after-thought during the infrastructure planning
and design process. Cycle lanes are squeezed into roads that have been built for trucks and cars. Speed limits, intersections and parking are designed for motor vehicles, and people who cycle are most often considered too late in the process (if at all). land designated for new roads often does not make allowance for safe cycling infrastructure. the problem starts at the top with national strategic documents, the flavour of which feeds through the balance of investment, the costs and benefits included in project level decision-making, regional council strategic planning, right through to the implementation of projects on the ground. this is a consequence, in the panel’s view, of planning and investment criteria prioritising journey time impacts above safety and failing to include other benefits and costs at a population level.
DraFt reCommenDationS
model communities: are urban environments
where walking and cycling are offered to the community as the easiest transport choices. the benefits include improved safety, congestion relief, reduced environmental impacts, and improved public health. the intention is to deliver safer environments for novice users, with a range of community destinations within reasonable riding or walking distance from residential population centres. Climate, topography and demographic characteristics are also important factors. in mid-2010 new plymouth and hastings were named as new Zealand’s first walking and cycling model communities. the two councils received $3.71 million and $3.57 million respectively for walking and cycling infrastructure plus $1.17 million and $691,000 respectively for educational measures such as travel planning, cycle skills training and website development. ongoing funding has been allocated.
new plymouth’s focus was to building on
existing investments. this meant extending and/ or upgrading existing paths to make them safer and more user-friendly, ensuring they connect to the right destinations, and expanding successful skills training and awareness campaigns. let’s Go is a behaviour change programme to encourage and enable people to leave their cars behind and try active transport. Schools are a target because they play a central role in the life of the community; and will foster the next generation of riders and walkers.
hastings has developed iWay, a hierarchy of
walking and cycling routes consisting of four key walking and cycling arterials and a highly visible and coherent network of adjoining collector level routes that link where people live, work and learn. prior to iWay, cycling was largely seen as a sport and the general feeling in hastings was that riders did not belong on the road. a regional Share the road campaign has led to greatly improved perceptions of safety.
the safety issues and mitigations that are particular to cycling are known to the transport agency. recommendations are already present
in strategic documents such as Safer Journeys,
the draft Government policy Statement and the transport agency’s Statement of intent. the panel is concerned that such proposed actions are often given a low priority or that there are unnecessary barriers to fully utilising allocated funding.
Regional, city and district councils are essential
partners in making cycling a safer mode of transport and mobility. Closer collaboration between the transport agency and Councils (collectively called road Controlling authorities) is needed to develop transparent assurance systems that the appropriate investment is being allocated to cycling. the netherlands is a good example of a transparent assurance system that is based on national and local appraisal. the panel would like to see the current draft voluntary benchmarking process for cycling provision implemented by all road Controlling authorities. this benchmarking tool helps authorities identify and share best practice. road Controlling authorities (rCas) do not have meaningful accountability and key performance
indicators (KpIs) around cycling safety outcomes
and participation. the panel would like to see more accountability linking funding to safety outcomes regarding cycling safety in particular. the panel is concerned that there is an ad hoc and
inconsistent approach to cycling and would like to
see some assurance that rCas are building fit for purpose, value for money, well-assessed cycling infrastructure. better design auditing of cycling provision in all transport projects would help.
unfair distributional impacts of polices and investment already occur in the transport sector. this includes both benefits (for example inequitable access to public transport services by income) and harms (for example greater exposure to injury by ethnicity). ensuring socio-economic and ethnic equity needs to be a key consideration when planning and delivering cycling infrastructure and services.
Local government investment: christchurch improving the safety and accessibility for cycling was a strong theme for recovery to emerge from the Share an idea discussion in 2011. people said they wanted the Council to invest in cycling infrastructure to provide more choices and safer routes for people travelling to work, study or play. the Council is planning on building 13
major cycle routes that will encourage the large group of people who think they would cycle, or cycle more, if it was safer.
to achieve this involves making some significant changes to the transport network in favour of cycling on these routes. in some locations this will result in cyclists having priority over cars at intersections and reduce on-street parking. Funding of $70 million for the major Cycle routes was approved in the Christchurch City three year plan 2013-16. in the 2014-15 annual plan, the Council committed to deliver the project over five years.
Work on some further elements of the major Cycleways is expected to begin in 2014.
Current Cycling Initiatives
• Consultation with the cycling sector to improve the visibility of existing guidance about safe cycling e.g. bike Wise.
• partial acknowledgement in the draft
Government policy Statement (GpS) on land transport Funding of cycling’s significant potential role in the transport system. • Some limited investment provision in
the draft Government policy Statement (GpS) on land transport Funding and the transport agency’s Statement of intent (Soi). (See Key Strategic Documents) • investment in the model Communities
in new plymouth and hastings.
• the provision of an additional $100m in Crown funding over 2014-2018 for cycling infrastructure with priority given to completing comprehensive cycling networks in major urban centres.
hIgh pRIORIty actIOns
i. Greater visibility and investment priority for safe provision for active modes in the GpS, the transport agency’s Soi, and national land transport
programme and other strategic documents. ii. inclusion of a wider range of costs and benefits
in the economic evaluation manual, including improving the ability to cycling net.
iii. providing safe and convenient routes for pedestrians and cyclists, especially to and from work and school, is reprioritised from “medium” to “high” in the Safer Journeys Strategy4 or the transport agency’s
investment criteria. high personal risk is reconciled with collective risk when prioritising projects. iv. help rCas access national land transport
programme funding by reviewing and monitoring the planning and investment criteria that are currently making it difficult for cycling projects to meet the “high strategic fit” criterion. Cycling must be considered in all integrated transport Strategies, plans and projects. this would include adjusting the application of the network operating Framework to give effect to cycling.5
medIum pRIORIty actIOns
v. Safe Cycling is a key consideration for road Controlling authorities, investment is transparent, accountable and open for external audit. For example, consider the introduction of cycling safety related Kpis for rCas and create a national team of visiting experts to provide guidance on Council projects and maintenance procedures to ensure a safe environment for cycling. vi. Develop consistent national standards and
descriptions for cycling infrastructure investment and align relevant legislation where this is necessary. vii. all road Controlling authorities participate in
benchmarking of their provision for safe cycling.
4 Safer Journeys priorities were calculated according to relative risk of death and serious injury, meaning that cycling was ranked as medium priority. this has made it difficult for some cycling projects to be ranked highly enough for funding approval. Without distorting the Safer Journeys rankings, the transport agency could review other strategic fit criteria to facilitate cycling investment consistently with the draft GpS and Crown funding announcement.
5 the purpose of a framework for network operations is to assist network managers to monitor the performance of road networks, identify gaps in performance and service delivery, and determine which measures may best address those gaps most efficiently against the needs of a broad range of road users. (https://www. onlinepublications.austroads.com.au/items/ap-r338-09)
2. Leadership and accountability - establish strong leadership and accountability practices for safe cycling
For the reasons noted in recommendation 1, the cycling sector lacks visibility in planning and investment due to the lack of strong leadership.
Current Cycling Initiatives
• Supporting this panel of experts.
• the transport agency has a small number of staff focused on cycling activity but they are overstretched and need additional resources. hIgh pRIORIty actIOns
i. the nZ transport agency and ministry of transport establish and resource dedicated teams, with senior leaders, staff and funding, to plan, implement and evaluate investments in cycling. [local government is encouraged to do the same where resources permit] ii. overhaul of cycling infrastructure guidelines to
update them in keeping with international best evidence about the effectiveness of different kinds of infrastructure and include minimum standards of continuity, consistency and quality. iii. introduce Kpis for safe provision for cycling
for road Controlling authorities. medIum pRIORIty actIOns
iv. improving the road safety auditing process to take more account of cycling and walking requirements. emerging cycling cities and their Leaders
new york & London
the 2002 new york mayoral election may have been a case of the right person at the right time when new yorkers wanted a more liveable city following the terrorist attacks on the World trade Centre. michael bloomberg and his transportation Commissioner, Janette Sadik-Khan, have proven to be strong, effective and visionary leaders. a city once known for dysfunction, high crime rates and congested streets has been transformed with the creation of cycle lanes and a successful bike hire scheme. london’s mayor, boris Johnson, is also a great cycling advocate who has done much to improve cycling by extending the cycling infrastructure and mandate side under-run protection on trucks. london’s cycling success is also a question of timing; after the london tube and bus bombings, commuters were ready to look to cycling as a safe and viable alternative travel mode.
3. Information collection systems relating to cycling safety be improved and expanded
Data capture in new Zealand is better than in most peer countries, however, it is weak and incomplete on many levels. Cycling accidents are under-reported, especially non motor vehicle crashes, in the transport agency’s Crash analysis System, making it difficult to measure the size of the problem. Data suggests two-thirds of on road injury crashes don’t involve a motorised vehicle, but we have limited understanding of what is causing these crashes. We don’t know how many people are cycling, to a fine-grained level, which inhibits planning and investment for cycling infrastructure. unlike safe workplace measures, no facility exists to report bicycle related hazards and near misses.6 additional
questions to ask at the scene of a cycling crash, or on hospital admission, could help prevent future crashes by better informing road planners and cyclists. there is no central database of dedicated cycling infrastructure provision and different road
controlling authorities may use different definitions of terms such as ‘segregated cycle path’, ‘separated cycle path’, ‘cycleway’, ‘cycle lane’, etc.
Current Cycling Initiatives
• the Crash analysis System (CaS) is a database managed by the transport agency. it contains all the police traffic Crash reports received by the agency together with crash analysis software and basic road data. until recently on-road cycling deaths that did not involve a motor vehicle were not required to be notified to CaS. local Councils conduct annual road user surveys, and some of them count cyclists. • the ministry of health collects hospitalisation
data, and aCC collects injury claims data. however, the categorisation and information collected for cycle crashes can be inconsistent.
• the mot collects household travel Survey data, which are invaluable for measuring cycling participation at a national level; without this data we would struggle to express cycling injuries as rates (e.g. per km travelled).
• Sport nZ collects cycling participation data • a number of cities, including auckland, hamilton,
palmerston north and Christchurch have continuous automatic bicycle counters, which provide detailed and consistent information on cycle traffic at key sites. the results have been very good for raising awareness and communicating with the media. medIum pRIORIty actIOns
i. in order to measure cycling participation, more sophisticated data collection processes are needed that accurately measure usage through hours and kilometres cycled.7 expanding the
installation of strategically located bicycle counters is one example of how this could be achieved. ii. road Controlling authorities undertake
ongoing monitoring of numbers of cyclists, trip lengths, injuries leading to hospital visits, public perceptions of cycling safety and satisfaction with cycling facilities provided
iii. infrastructure stocktake with consistent definitions and guidelines, including revising and updating the Cycling Stocktake 2008, Design Standards and non-motorised users interim Guidelines. iv. improve cycling crash reporting in CaS by
recording more latent contributing factors, e.g. what provision of lighting cyclists had at the time of a crash. make greater use of hospital and aCC cycling injury data so we can learn more about off road and cycle-only crashes. v. improve understanding of the distributional impacts of cycling participation and injury by socio-economic status and ethnicity through improved collection of these data in the new Zealand household travel survey and CaS.
7 For example, the household travel and road Safety attitude Surveys sample size could be increased. it would be valuable to have a sample size that gives statistically significant results for cycling
vi. Facility to report near misses, and tools to report hazards, e.g. www.fixmystreet.com with an assurance that it will be appropriately monitored. vii. analysis of police Community roadwatch
reports featuring cycling.
viii. Further research on specific areas of interest. For example, the evidence base is lacking to determine whether cycle skills training improves cycling safety or participation.
safe system approach
- Roads and Roadsides
4. minimise crash risk - Rcas take action to minimise conflict (crash risk) between people who cycle and other road users, especially heavy vehicles
Deaths for cyclists mostly result from cycles and motor vehicles crashing – cyclist only crashes tend to have less serious injuries, although they are more common. motor vehicle vs. cyclist crashes are often caused by confusion and impatience at intersections, not seeing (or looking for) other parties misjudging speed or intentions of other practices, poor infrastructure design or maintenance, design guidance that balances speed and safety (as opposed to prioritising safety over throughput), motorists infringing upon cycle lanes, road works pushing cyclists into busy traffic, and obstructions that hide cyclists from traffic. Also see the Safe Vehicles section for recommended enhancements to in-vehicle features.
intersections and driveways are the most hazardous
locations for urban cycling representing 74% of all cyclist deaths and serious injury crashes. Commonly, this is because a motorist has failed to give way to a cyclist. Cycling safety would be greatly improved by creating a consistent, continuous, convenient network of best practice cycling infrastructure that improves both actual and perceived safety, with extra consideration given to intersection design.
but even improvements to intersections on their own would significantly improve cycling safety. a particularly difficult area is the safe provision for people on bikes using roundabouts, especially multi-lane roundabouts. there is a fundamental difference to roundabout design philosophy between some continental european and english-speaking countries. english-speaking countries maximise capacity, whilst the radial design philosophy of continental european countries maximises safety of all users. this divergence in european practice was brought about by unacceptably high crash rates for cyclists. Cyclists make up one third of killed and seriously injured roundabout users in new Zealand, whereas at other forms of intersection control, the casualty rate is about seven per cent8. roundabouts in new
Zealand are designed to austroads guidelines, and there is a need to research whether european guidelines should be tried in new Zealand (or australasia). radial design philosophy is a significant departure from the status quo, and this is an area where much further australasian research is needed. in the meantime, we ought to be careful where to build multi-lane roundabouts, and how cycling is accommodated in that part of the network. to cycle through a multi-lane roundabout on the carriageway is incompatible with safe system principles.
international experience and evidence demonstrates that it is possible to worsen safety with poor
quality infrastructure. the strongest evidence supports the following kinds of infrastructure: • physical separation on arterial and busy collector
roads, so long as this is accompanied by continued infrastructure through carefully designed
intersections. elevation at side roads has also been shown to be a helpful accompaniment. • advanced stop boxes and hook-turn boxes at
intersections appear to improve cycling safety and are likely also to protect cyclists from high exposure to vehicular air pollution.
8 Wilke, a., et al. (2014). assessment of the effectiveness of on-road bicycle lanes at roundabouts in australia and new Zealand. Sydney, australia; table 7.
386 210 Driveway Roundabout Traffic Signals Other X junction Other T junction Not at a junction 131 124 153 461
Junction type in urban cyclist
fatal and serious crashes 2003-12
• aesthetically pleasing low speed local streets (e.g. ‘self-explaining roads’) very effectively reduce crash risks for all road users and can create attractive routes where cyclists are able to mix with slow moving, low volume vehicular traffic. on the other hand, further research is needed to understand the potentially negative
impacts on safety of narrow on-road marked lanes and off-road shared paths.
Current Cycling Initiatives
• provision of an additional $100m over 2014-2018 from Crown funding for cycling infrastructure, with priority to be given to comprehensive, complete cycling networks in major urban centres. • trialling sharrows (shared lane cycle marking).
this pavement marking includes a bicycle symbol and two white chevrons and is used to remind motorists that cyclists can share the lane.
• a national active modes infrastructure Group has been set up by the road Controlling authorities Forum. the group is looking to achieve a more nationally consistent approach to implementing cycle-lane markings, signage and treatments. • nZta urban design guidelines on
providing for walking and cycling.
• Cycle network and route planning Guide. • non-motorised users review interim guidelines. • model Communities, i.e. hastings
and new plymouth.
• Future Streets (the research element of this project is funded by ministry of business, innovation & employment). • Cycling specific projects within the national
land transport programme, and cycling
• austroads, of which the transport agency is a member, has commissioned a study on roundabout safety.
hIgh pRIORIty actIOns
i. identify urban and rural freight routes popular with cyclists. Where possible, consider alternative routing, for either freight or cycling. Where this is not possible, special care is needed to reduce heavy vehicle speeds and provide physical separation, intensive intersection treatments and wide protected turning and passing. align and prioritise this work with the new Zealand Cycle trail’s network expansion project. ii. Create consistent, continuous, convenient and
complete urban cycle networks, in keeping with the best evidence – a whole of journey approach. iii. parking: progressively remove parking from
arterial routes, which is consistent with the one network road Classification. Develop nationally consistent parking guidelines for arterial roads and other key cycling routes. iv. research whether european roundabout design
guidelines should be tried in new Zealand. v. Safe provision for cycling at other
complex intersections, in keeping with international best practice.
vi. rural space management which includes shoulder widening and smooth surfacing, sight distance improvements, road markings, maintenance and regular debris removal on key cycling routes. align this work with Kiwirap.
case study
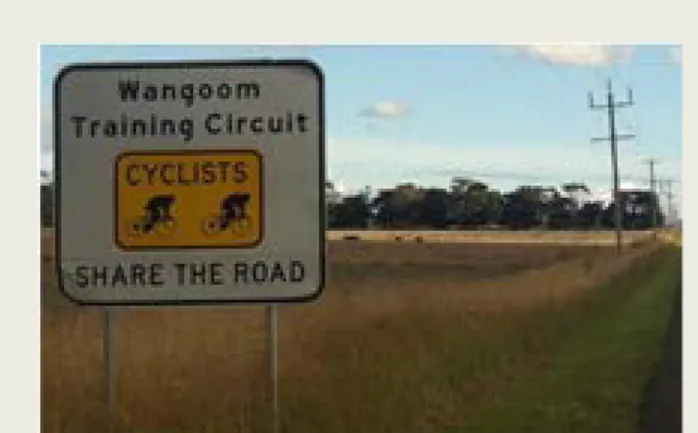
a Victorian study found that many drivers held negative views towards cyclists which ranged from unease and discomfort to impatience and frustration. Some aggressive respondents were adamant that cyclists should not be on the roads at all. they felt that cyclists were taking a risk and therefore any harm was the cyclist’s own fault. a majority of drivers weren’t aware that cyclists are permitted to ride two abreast and there were knowledge gaps in relation to other cycled related road rules. attempts to overcome this attitude towards cycle athletes have been made in the Western Victorian region. a cycling training route around Wangoom, near Warrnambool, is clearly signed to alert drivers that cyclists will be in the area. this does not mean that cyclists have priority and are able to spread across the road, rather that drivers should expect to be sharing the roads at the signed times.9
adopting this approach and marking certain roads that are popular with cyclists could overcome safety concerns for both cyclists and motorists. Some of taupo’s popular cycle routes would be a good place to trial the Wangoom signage, together with applying appropriate speeds and removing pinch points.
9 monash (2012)
medIum pRIORIty actIOns
vii. road markings – identify and provide signage to advise motorists they are driving along a popular cycle route. identify and provide signage to advise where roads are unsuitable for cycling in a no fault way. viii. minimum standards are developed for width
delineation, colour, maintenance and safe entry and exit points for on-road cycling lanes and off-road paths. in some instances this includes a requirement for broken yellow lines along kerbside cycle lanes to clarify to motorists that parking in cycle lanes is not permitted. ix. require managers of road works and building sites
to be considerate of cyclists and allow adequate space for them when undertaking temporary traffic management on roads. Strengthen the requirements for providing safe passage for cycling in the Code of practice for temporary traffic management. x. Set up a system to support and encourage rCas
through a benchmarking process that provides constructive feedback and peer support. xi. investigate the feasibility and cost benefit of
introducing temporal restrictions on heavy vehicles in urban areas (network operating Frameworks).
the findings of a portland study found that businesses see great value in replacing car parking with bicycle parking and are requesting the City Council to install bicycle corrals. portland businesses recognise that urban spaces that attract pedestrians and bicyclists encourage higher levels of shopping and dining. two thirds of businesses surveyed responded that the bike corrals increased foot and bike traffic in the area.10
10 meisel (undated)
5. Road controlling authorities provide safe on-road connections to the nZ cycle trail and other nationally significant cycle trails
Safety is compromised when cycle paths end and exposure to traffic is inevitable in order to reach the next path. a continuous facility (be it on-road or off-road) greatly enhances the safety and enjoyment of the cycling experience.
Current Cycling Initiatives
in February 2009 building a network of cycle trails was proposed. the network would not only provide a healthy and enjoyable way for Kiwis
and international visitors to see the country, but would also generate economic, social and environmental benefits for our communities. So far, $50 million has been invested by Government and a further $30 million by local communities, with further funding committed by Government. medIum pRIORIty actIOns
the panel endorses nZCt’s network expansion project, which aspires to link all the cycle trails, and other nationally significant cycle trails and touring routes, into one national network.
example of auckland off-road connections the nZ transport agency is working with auckland Council and auckland transport to connect the northwestern cycleway to the waterfront, in the heart of auckland City. the northwestern Cycleway is one of the most popular cycleways in auckland, with over 700 people on average using it each day. the existing route is approximately 9 kilometres in length and generally follows the alignment of the north-western motorway (Sh16), running from the western edge of auckland’s city centre to the te atatu peninsula.
With the recent completion of the Grafton Gully & beach road sections connecting to the Kingsland Cycleway, cyclists are now able to enjoy an almost entirely off-road journey between Waitakere and auckland. this route will also be part of the nZ Cycle trails first urban cycle route connecting auckland international airport and auckland CbD. the recent completion of the beach road portion of the project demonstrates a positive
safe speeds
6. manage motor vehicle speed – to minimise crash risk and severity
increases in speed disproportionately affect crash severity and also increase the likelihood of a crash happening. impact speed influences the survivability of a crash – particularly for cyclists, who do not have the protective shell of a car or truck. occasionally, tools intended to manage speed, such as pinch points, can also add to cycling’s safety risk if not well designed. new Zealand’s default speed limits of 50 km/h and 100 km/h are incompatible with cycling mixing with motor vehicles. Where it is not possible (or pragmatic) to physically separate these modes, then lower motor vehicle speeds are required to reduce the speed differential. in countries noted for their strong cycling culture, a key part of their success is due to their adoption of lower speed environments. Safer Journeys action plan requires that speeds support both safety and economic productivity, and that they are appropriate for road function, design, safety and use. the new one network road Classification (onrC) system provides the opportunity to better align travelling speed with road function because the classifications are based on traffic and
freight volumes.11 the speed relationship with fuel
consumption has been shown to be more complex than current curves suggest. travel time reliability is more important economically than travel times per se – unpredictable congestion stop starts in 60km/hr zones are worse than travelling smoothly at 30km/hr for instance. on the other hand, there are direct economic upsides to lowering speeds, including creating urban places that attract greater foot traffic and lingering – both of which increase local business custom. the Safer Speeds programme recently adopted by the national road Safety Committee aims to reduce DSi and support economic productivity by establishing safe and appropriate speeds.
Current Cycling Initiatives
• under the Safer Journeys action plan 2013-2015, the Safer Speeds programme is being developed jointly by the ministry of transport and the transport agency in consultation with stakeholders. When implemented this will include clearer guidelines for appropriate travel speeds on different kinds of roads, and campaigns to change the public conversation about speed. the panel supports the implementation of this programme.
11 Safer Speeds: new Zealand national Speed management programme 2014
• 40km/h part-time school speed zones have been implemented in many cities around new Zealand since 2001. • Speed reduction awareness campaigns. • traffic calming and other physical speed
management treatments are reasonably common around new Zealand; however there is little national guidance on these and hence treatments are inconsistent and sporadic. • Some local authorities have introduced lower
speed (<50km/h) speed limits, including hamilton’s Safer Speed residential areas and Wellington’s shopping streets.
• Speed management in shared spaces (where cars are supposed to give way to cyclists and pedestrians), however this lacks consistency. • expanding the network of speed cameras
and red-light cameras through the road policing programme, in partnership with the transport agency and local government. high priority actions
i. reduced motor vehicle speeds (using traffic calming, self-explaining street treatments and lower speed limits) around key destinations, such as schools and shops, along key cycling network routes where separated facilities are not present and in local neighbourhood streets. ii. reduced motor vehicle speeds in conjunction
with physical separation where cycle and freight routes are unable to be separated. iii. reduced and more appropriate speeds on
rural roads where cyclists are most at risk. medium priority actions
iv. elevate the following actions in the Safer
• reducing vehicle speeds on roads currently used frequently by pedestrians and cyclists • achieve complete coverage of temporary
lower speed limits around schools
safe Road use
many crashes are caused by inattention, inappropriate behaviour (whether intentional or not) and lack of knowledge by both motorists and cyclists. the Safe System approach starts from the principle that “people make mistakes”, meaning that human error needs to be accommodated within a forgiving road system that manages crash forces to survivable levels.
the safe Road use element of the approach aims to
reduce human error or to minimise its effects, while recognising that it cannot be entirely eliminated. although Safe road use can be encouraged through safe roads and roadsides, safe travel speeds and safe vehicles, this section considers actions aimed mainly at attitudes, behaviour and regulation. 7. minimum passing distances – mandated via the
Land transport act and Regulations
Cyclists, particularly those on the open road who are being overtaken at high speeds, are vulnerable to being squeezed off the road, sucked towards passing trucks or hit by the vehicle overtaking them. Cyclists are reliant upon balance, and will wobble and fall if their space is impinged upon. in conjunction with the ontario Coronial Cycling Death review in 2010, an amendment to the ontario highway traffic act was proposed to include safe passing distances between motorists and cyclists. The purpose of this Act is to educate the public and in particular motorists about the safe passing of cyclists and to provide the police with both an educational and enforcement tool that will reduce injuries and fatalities.12
on 7 april 2014, Queensland introduced legislation to trial a minimum passing distance of at least 1m in a 60km/hr or less speed zone and 1.5m if the speed limit is over 60km/h for motorists passing cyclists.
Other road rules have also been changed to allow motorists to cross centre lines, straddle lane lines or drive on painted traffic islands to make it easier for them to pass cyclists, when it is safe to do so.
This change will be trialled for 2 years to test how the 1m and 1.5m minimum passing distance works in practice.13
australian Drivers will be penalised 3 demerit points and a au$341 fine if in breach of the minimum distance when passing a cyclist. if the matter goes to court, a maximum fine of au$4,554 can apply. in 1973, Wisconsin became the first uS state to enact such a law. many states in the united States of america have since passed minimum three feet
13 Department of transport and main roads, Queensland Government (2014)
(0.9 metre) passing distance laws. pennsylvania has extended this distance to four feet (1.2 metres). While enforcement can be challenging, there are instances, akin to the following distance rules, where this law will be of value when witnesses can report that there was no question that an event resulted from a passing distance of significantly less than one metre. Such a law also helps to inform conversations about appropriate driving behaviours, such as motorists waiting behind cyclists if necessary, or clearly using the opposing traffic lane to overtake rather than trying to ‘squeeze’ past in the same lane.
WA CA LA OK UT MT CO NE MO IA SD NV AR TN KY WV VA MD PA NJ NY VT NH ME MA RI CT NC SC GA FL AL MS AZ OR ND MN WI OH IL MI IN KS NM WY ID DE DC HI AK TX
States with 0.9m (3ft) minimum passing distance
States with 1.2m (4ft) minimum passing distance States with general safe distance passing requirement
States with no specific law for passing a bicyclist
Figure 4 map of States with Statutes regarding motorists passing cyclists http://www.ncsl.org/research/transportation/safely-passing-bicyclists.aspx
Current Cycling Initiatives
minimum passing distances are included as a guideline in the road Code.
hIgh pRIORIty actIOns
legislate for a minimum space when drivers overtake cyclists [1 metre is suggested for speed limits up to 60 km/h, and 1.5m for more than 60 km/h roads]. use such legislation as the foundation for road safety education and enforcement
campaigns that support active mobility. although enforcement is subject to proving a breach of the minimum, it is a tool the police can use that sends a strong message to motorists. 8. school travel plans and cycle skills training –
increased support from the transport agency and local government
only a small percentage of children are being taught cycling skills and these skills are often not adequate to cope with most traffic. the majority of skills training is at Grade 1 level, which has no on-road component. the Grade two courses give children
confidence and the skills to cycle in a variety of traffic environments and the panel would like to see more of Grade two delivered. adults are even less likely to have received some formal cycle skills training, and currently there are very few opportunities around the country for adult riders of any level of experience to obtain training by certified instructors. high quality international assessments of the current evidence about cycle skills training and school travel planning conclude a lack of effectiveness at improving safety or participation outcomes for both these interventions. there continues to be a need for further research in this area, particularly to understand whether cycle skills training is helpful for encouraging participation in cycling where good infrastructure is present, as well as to ensure training does not encourage over-confident cycling by children in dangerous environments. Despite the lack of solid evidence in this area the panel believes cycle skills training and education regarding the key risks for people who cycle will improve safety outcomes. a 2009 study found that 8.6 per cent of intermediate school students cycled to school, but 22.2 per cent wanted to. 14
14 mackie (2009)
School approx % cycling
% of students who would like to bike to school theoretical max % cycling a (a) theoretical max % cycling b (b) avondale intermediate 1% 17% 20% 55% Kowhai intermediate 7% 24% 14% 23% Wesley intermediate 2% 13% 31% 58% (c) (d) Devon intermediate 14% 35% 29% 58% tauranga intermediate 8% 23% 17% 34%
mount maunganui intermediate 20% n/a 16% 36%
average (SD) 8.6% (6.3%) 22.2% (8.3%) 21.5% (8.6%) 44% (15.0%)
Current Cycling Initiatives
Government is co-investing in Cycle skills training and providing guidance on school travel planning. however, delivery is inconsistent and limited. there are three levels of training.
grade one cycle skills training is targeted to
8+ years old (year 4,) takes 3 hours and is held in a non-traffic environment (e.g. playground, netball court). the trainee to instructor ratio is 30:1 (theory) and 15:1 (practical).
grade two training takes 7-8 hours in total (30
minutes theory and 6 hours riding on local roads). the trainee to instructor ratio is 30:1 (theory and 6:1 (practical). target group is 10+ years old (year 6)
grade three training takes 2 – 8 hours and takes
place in more challenging traffic environments. it is aimed at 12+ year olds (year 8) and requires a trainee to instructor ratio of 3:1. because of instructor ratio, these classes are very expensive to deliver.
hIgh pRIORIty actIOns
i. increase cycle skills training in schools and increase the effectiveness of road user education to make it safer to walk and cycle is reprioritised from medium to high in the Safer Journeys road Strategy. Cycle skills training should have an increased focus on Grade 2 and above to school aged children, as this level has a greater emphasis on on road riding and dealing with traffic and intersections. medIum pRIORIty actIOns
ii. encourage wider delivery and increased funding of ‘bikes in Schools’ as it provides a very good introduction to cycling for many children who may not otherwise have the opportunity.
iii. ensure school travel planning initiatives integrate roading infrastructure improvements with cycling, parking and travel speed. instil a principle of shared responsibility between schools, communities and their councils. make existing travel planning guidance more accessible to schools.
bikes in Schools is a complete biking package implemented within a school that enables all students to ride a bike on a regular basis.
the full package includes: • a fleet of new bikes
• a bike helmet for every child
• combination of riding, pump and bike skills tracks • bike storage facility (where needed)
• bike coach to introduce the programme and teach basic riding skills all the bikes and helmets are owned by the school and remain on the school property. the tracks are built within the school property. the storage facility (e.g. converted shipping container or bike shed) is also owned by the school.
this package can be complemented by a travelwise Safe School travel plan (in auckland) or other local Council school road safety programmes, and also a cycle skills training programme from a range of different providers.