Department of Animal Breeding and Genetics
Novel workflow for Metagenomics and
transcriptomics analysis of Anaerobic
Digestive systems.
Renaud Van Damme
Novel workflow for Metagenomics and transcriptomics analysis
of A.D. systems.
Renaud Van Damme
Supervisor: Erik Bongcam-Rudloff, Swedish University of Agricultural Sciences, Department of Animal Breeding and Genetics, section Bioinformatics Assistant supervisor: Bettina Müller, Swedish University of Agricultural Sciences, Department
of Molecular Sciences
Assistant supervisor: Christian Brandt, Swedish University of Agricultural Sciences, Department of Molecular Sciences
Examiner: Johan Dicksved, Swedish University of Agricultural Sciences, Department of Animal Nutrition and Management
Credits: 30 credits
Level: Second cycle, A2E
Course title: Independent project in Biology, A2E
Course code: EX0871
Course coordinating department: Department of Animal Breeding and Genetics
Place of publication: Uppsala
Year of publication: 2020
Online publication: https://stud.epsilon.slu.se
Keywords: Metagenomics, transcriptomics, pipeline, A.D systems, Biogas, Bioinformatics
The A.D. systems (anaerobic digestion), when used in biogas reactors, are an ad-vanced ecological way to produce energy while treating waste. The majority of the microbial community of the reactor remains unknown to this day, due to the impos-sibility to culture most of the bacteria individually. Metagenomics and transcriptom-ics aim to discover those bacteria and understand the interactions within the commu-nity. HTS (high throughput sequencing) technology opens new possibilities in terms of length of the reads sequenced and accuracy. Sequencing done by Oxford Nanopore machines can produce long reads while having a slightly worse accuracy than other machines, where Illumina sequencing machines have a higher accuracy to the detri-ment of lengths. The two sequencing methods compledetri-ment each other, and the hybrid assembly uses both long and short reads to create longer and more accurate contigs that can then be further analysed.
Here is presented a metagenomics pipeline (MUFFIN) based on the hybrid assem-bly of short and long reads followed by multiple differential binning methods and refinement to produce high-quality bins and their annotations. The pipeline is written by using Nextflow to achieve high reproducibility and fast and straightforward use of the pipeline. This pipeline also produces the taxonomic classification of the bins as well as a transcription, quantification and annotation of RNAseq data. The pipeline was tested using one biogas reactor as an example to assess the capacity of MUFFIN to process and output relevant files needed to analyse the microbial community and their function. A parsing script was developed to analyse and summarise the annota-tions files. The script outputs a quantification file of the transcripts annotated, an HTML file summarising the pathways across the bins and transcripts, and an HTML file for each bin summarising the annotation.
Keywords: Metagenomics, transcriptomics, pipeline, A.D systems, Biogas
List of tables 5 List of figures 6 Abbreviations 7 1 Introduction 9 2 Background 11 2.1 Biogas reactor 11
2.2 The anaerobic food chain in biogas processes 11
2.3 Cloacimonetes 14
2.4 Sequencing approaches 14
2.4.1 Oxford Nanopore MinIon 14
2.4.2 Illumina Sequencing 15 2.4.3 RNA sequencing 15 2.4.4 Metagenomics 15 2.5 Hybrid Assembly 16 2.6 Reproducibility 16 2.7 Nextflow 17 3 Aim 18
4 Material and method: 19
4.1 Sample used 19
4.2 Nanopore DNA extraction, library preparation, and sequencing 19
4.2.1 Basecalling 19
4.3 Illumina DNA extraction, library preparation, and sequencing 20 4.4 mRNA extraction, library preparation, and Illumina sequencing 20
4.5 Bioinformatic Workflow: 20
4.5.1 Making the pipeline 20
4.5.2 The pipeline (MUFFIN) 22
4.5.3 Assemble 23
4.5.4 Classify 23
4.5.5 Annotate 24
4.5.6 The databases 26
5 Results 28 5.1 Quality Control 28 5.1.1 Nanopore 28 5.1.2 Illumina 29 5.1.3 RNA 30 5.2 Assembly 30 5.3 Binning 31
5.4 CheckM vs Sourmash (GTDB) classification 31
5.5 RNA de novo Transcripts 33
5.6 EggNOG annotation parsed. 33
5.6.1 The glycolysis 34
5.6.2 The methane metabolism 35
5.6.3 The carbon metabolism 36
6 Discussion 38
6.1 Using Hybrid assembly 38
6.2 Using three binning methods and a binning refiner 38
6.3 Use GTDB with sourmash for classification 38
6.4 Why use eggNOG to annotate 39
6.5 Gene expression 39
6.6 Graphical display 39
6.7 MUFFIN limitations 39
7 Conclusion and further perspectives 41
Acknowledgments 43
References 44
Appendix 1 - CheckM and sourmash (GTDB) results 49
Appendix 2 – Parser results 53
A. The glycolysis 53
B. Methane metabolism 56
C. Carbon Metabolism 59
Table 1- Software used in MUFFIN 24 Table 2- Bins with their respective lineage from CheckM and sourmash (GTDB).
Sourmash was limited to the class level, see Appendix n°1 for the
complete taxonomic resolution. 31
Appendix 1; Table 1 - CheckM quality check 49
Appendix 1; Table 2 - CheckM Lineage 50
Appendix 1; Table 3 - Sourmash taxonomic lineage (superkingdom to order) 51 Appendix 1; Table 4 - Sourmash taxonomic classification (family to species) 52
Appendix 2; Table 1 - the gene “expression.” of the glycolysis pathway in the bins 53 Appendix 2; Table 2 - the gene “expression.” of the methane metabolism pathway
in the bins 56
Appendix 2; Table 3 - the gene “expression.” of the carbon metabolism pathway in
the bins 59
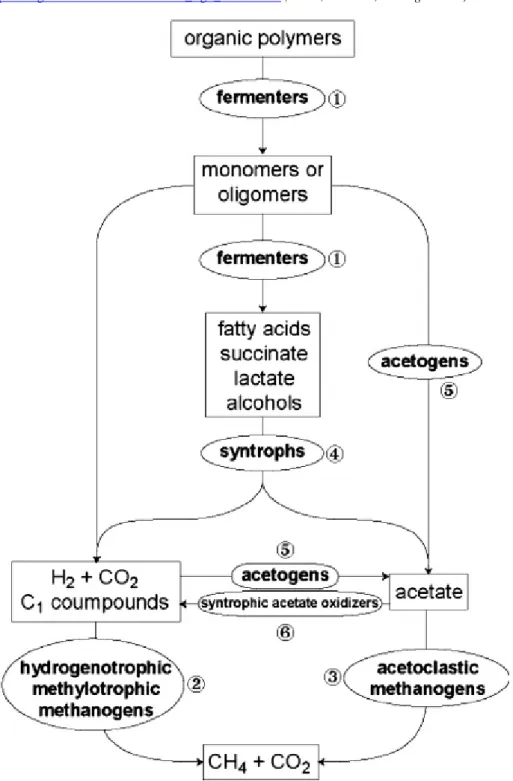
Figure 1 - Schematic of the anaerobic degradation of organic matter into methane. Source https://www.researchgate.net/figure/Schematic-anaerobic-food-
chain-for-the-conversion-of-complex-organic-matter-to-methane-in_fig1_250924004 (Mesle, Dromart, and Oger 2013) 13
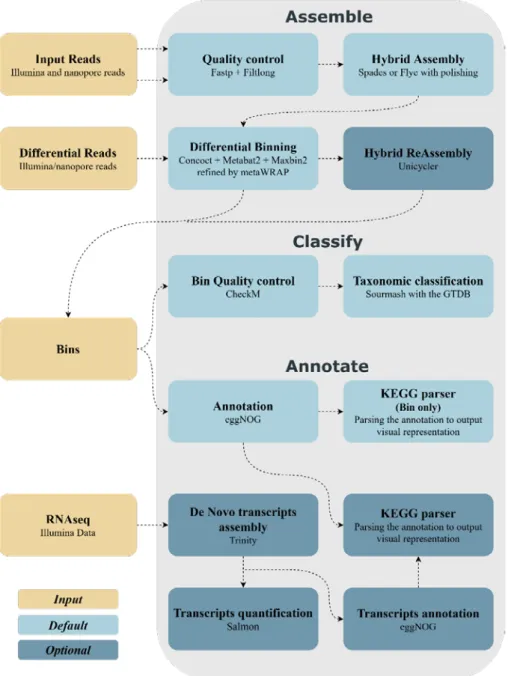
Figure 2- The chart of the MUFFIN pipeline. 22
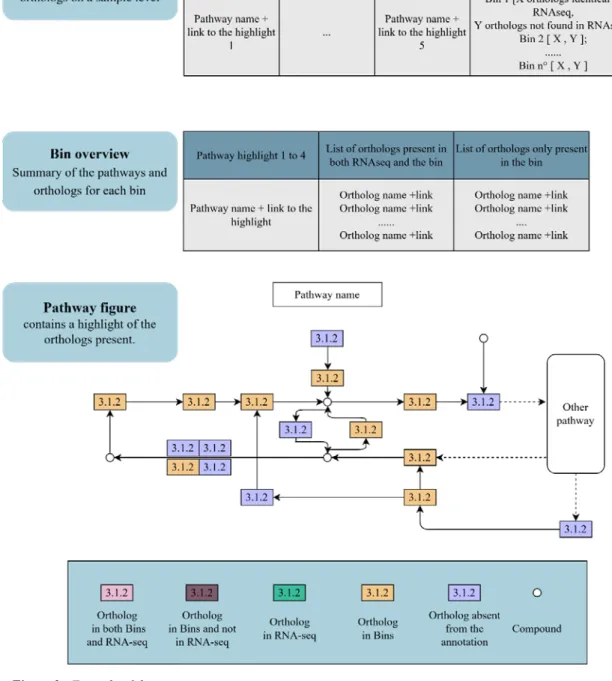
Figure 3 - Example of the parser output 26
Figure 4 - The quality control output of nanopore sequencing after guppy
basecalling. 28
Figure 5 - The per sequence quality of the Illumina R1 read before any quality
improvement with fastp. 29
Figure 6 - The per sequence quality of the RNAseq R1 read before any quality
improvement with fastp. 30
Figure 7- The glycolysis pathway with 119 out of 136 “genes” highlighted in purple 35
Figure 8- The methane metabolism pathway with the “expressed genes” highlighted in green and the “non-expressed genes” highlighted in orange. 36
Figure 9- The carbon metabolism pathway with the “expressed genes” highlighted in
green. 37
Appendix 2; Figure 1- The glycolysis pathway with the “expressed genes”
highlighted in green. 54
Appendix 2; Figure 2 - The glycolysis pathway with the “non-expressed genes”
highlighted in orange. 55
Appendix 2; Figure 3 - The methane metabolism pathway with the RNAseq “genes
highlighted in purple. 57
Appendix 2; Figure 4 - The methane metabolism pathway with all the genes present in the bins high-lighted in red. No distinction between “expressed”
and “non-expressed.” 58
Appendix 2; Figure 5 - The carbon metabolism pathway with the “non-expressed
genes” highlighted in orange. 60
Appendix 2; Figure 6 - The carbon metabolism pathway with the RNAseq “genes”
highlighted in purple. 61
16s 16s rRNA sequencing A.D. system Anaerobic digestion systems Cloacimonetes candidatus cloacimonetes
HTS High Throughput Sequencing
MAGs Metagenome-assembled genomes
mRNA messenger RNA
NGS Next-generation sequencing
RNAseq RNA sequencing
SNVs Single nucleotide variants
To treat any kind of organic wastestreams, different methods are available where each of them has pros and cons (Eriksson, Strid, and Hansson 2015; Arafat, Jijakli, and Ahsan 2015). Amongst those, one stands out in terms of low environmental impact as it goes along with sustainable energy production: This method is called engineered anaerobic digestion (A.D.), that use bacteria and archaea to degrade dif-ferent kinds of organic waste while producing, e.g. methane (biogas) in so-called biogas reactor (Wellinger, Murphy, and Baxter 2013; Atelge et al. 2018).
The biogas plants are used to produce biomethane (methane from a biological source) and are implanted in various countries of the world as a sustainable alterna-tive for energy production. These countries include Germany, Italy, Sweden, Fin-land, France, Belgium (Torrijos 2016) but also China, India, Canada, and other countries (Raboni and Urbini 2014). The global use of A.D. systems, make the study of the microorganisms and their interactions in those worldwide systems a potential key to understanding the function of lesser known bacteria. Retrieving the genome and functions of those bacteria could lead to an increase of the production as well as some new critical discoveries. Biogas can be generated by using different organic resources such as agricultural waste, sewage sludge, manure, industrial food waste, organic household waste and crops. Methane can be either upgraded to biofuel or used to produce electricity or heat.
The production of methane by microorganisms is called methanogenesis and is realised by methanogenic archaea in strictly anaerobic conditions. However, the whole anaerobic degradation process into methane and carbon dioxide is more com-plex and requires the harmonised and combined activities of a vast number of dif-ferent microorganisms. It involves multiple trophic levels, responsible for de-polymerization, primary and secondary fermentation, acidogenesis, acetogenesis, and methanogenesis (Pelletier et al. 2008). The microbial community of the reactor should be complementary and depends strongly on syntrophic interaction in order to complete the entire degradation (Solli et al. 2014). Thus, knowing the composi-tion of the microbial communities of the reactors helps to understand the metabolic mechanism and interactions and also helps in the optimisation of biogas production.
The analysis of a microbial community relies on the use of metagenomics anal-yses as most of the microorganisms cannot be cultivated for individual analysis. The use of metagenomics already much helped in the discoveries of new bacteria, be-longing even to new, undescribed phyla.
For example, one of the new phyla discovered through metagenomics analysis is the “Candidatus Cloacimonetes” phylum, which has been deduced from the ge-nome reconstruction of “Candidatus Cloacamonas acidaminovorans” (Pelletier et al. 2008). Candidatus Cloacimonetes has been found at significant abundances in different biogas reactor samples; ranging from 10% to 15% (Botello Suárez et al. 2018; Lee et al. 2018; Solli et al. 2014; Pelletier et al. 2008). The use of meta-genomics and high throughput sequencing are prerequisites as most of the unknown bacteria are unculturable as they can be profoundly complex to be cultured and might require the presence of other microorganisms (Steen et al. 2019). The phylum ‘Candidatus Cloacimonetes” might be involved in the degradation of organic waste and also involved in the methanogenesis step: a hypothesis endorsed by the increase of population through time in biogas reactor (Solli et al. 2014). Investigating the potential role of such bacteria in this complex degradation can be crucial to the op-timisation of the production of biogas.
Summarised, metagenomics and transcriptomics analyses are critical elements in research when it comes to unculturable bacteria and their functions and interac-tions within complex microbial consortia (Parks et al. 2017; Sunagawa et al. 2015). In that sense, reproducibility and convenient handling of such bioinformatics anal-yses are of crucial importance for scientific research since it lightens the bioinfor-matics workload put on the researcher.
Metagenomics analysis is the sequencing of a microbiome without distinc-tion/selection of a specific organism. Using tools specific for metagenomics, we can reconstruct and polish “potential” organisms each of those is then compared to known organisms to assess their existence, potential existence (through similarities) or if they are error due to the process of creation. The potential obtention of infor-mation about uncultured and unknown bacteria as well as about the functional po-tential of known bacteria, make metagenomics a suitable analysis method in this specific study.
2.1 Biogas reactor
A biogas reactor is a fermentation chamber with a controlled environment used to produce biogas. This consists of the main chamber equipped with different sensors to control the environment, a heating system to maintain the optimal temperature, a gas exit to harvest the biogas produced and a matter entry to input the organic matter. Biogas reactors can range from household-scale (China) to large-scale as typically found in Europe. For research purposes, lab-scale reactors with a volume ranging from one to five L can be used to mimic large-scale processes in order to explore the relationship between microbial community, function and process performance. A variety of feedstocks can be used ranging from agricultural waste, industrial waste from food production, organic household waste, to sewage sludge. The gas can then be stored for external usage or used directly to produce electricity and heat or up-graded to biofuel.
2.2 The anaerobic food chain in biogas processes
The methane production requires the collaboration of diverse trophic levels, includ-ing de-polymerization, primary and secondary fermentation, acido-genesis, aceto-genesis, and methanogenesis (Pelletier et al. 2008).
The de-polymerization, also called hydrolysis, is involved in the reduction of complex and large organic compounds into smaller and simpler compounds (such as peptides, amino acids, fatty acid, sugars), which will be further digested in the following steps (Angelidaki et al. 2011).
The acidogenesis is the transformation of amino acids and sugar into hydrogen and diverse organic acid , required by the acetogenesis to produce the next interme-diate product.
The acetogenesis is both the synthesis of acetate from the reduction of carbon dioxide or further oxidation of organic acids produced in the previous steps (Rags-dale and Pierce 2008).
The methanogenesis is the last step in the production of methane from organic waste. It uses either acetate or hydrogen and carbon dioxide to produce methane and carbon dioxide. The two different pathways occur depending on the present Ar-chaea, which produces methane. The first is the use of carbon dioxide with hydrogen to produce methane. It can be produced by different groups of Archaea but is under low ammonia conditions not the most productive. The second is the cleavage of acetate into carbon dioxide and methane. It is estimated that two-thirds of the me-thane produced globally comes from this reaction; only a few genera are known to use this pathway (Liu and Whitman 2008).
Figure 1 - Schematic of the anaerobic degradation of organic matter into methane. Source https://www.researchgate.net/figure/Schematic-anaerobic-food-chain-for-the-conversion-of-com-plex-organic-matter-to-methane-in_fig1_250924004 (Mesle, Dromart, and Oger 2013)
2.3 Cloacimonetes
The “Candidatus Cloacimonetes” phylum is present in different anaerobic environ-ment partly up to 10% to 15% of the environenviron-mental bacterial population according to some articles and has been found at partly high abundance in WWTP and biogas plants (Solli et al. 2014; Botello Suárez et al. 2018; Lee et al. 2018). It could repre-sent a new bacterial division that is up to 10% of the bacterial community (Pelletier et al. 2008). The “Candidatus Cloacamonas acidaminovorans” genome recon-structed in 2008 provided the first evidence of this potential new division. As this bacterium is not culturable and did not receive much interest in the past, there is little information about it. However, this phylum might be of great importance to the biogas processes. There are indications that they are involved in syntrophic in-teractions and it was found to be present in many anaerobic degradation systems that revolve around the fermentation of amino acids (Pelletier et al. 2008).
2.4 Sequencing approaches
In this study, we sequenced metagenomes using three different methods. An Oxford Nanopore MinIon sequencing, Illumina DNA Miseq sequencing, and RNA se-quencing using Illumina Miseq.
2.4.1 Oxford Nanopore MinIon
The MinIon sequencing is a long-read sequencing method that consists of the library preparation of the sample, followed by the direct sequencing of the sample. The sequencing is not synthesis based, but it sequences by passing through the DNA strands through pores where all bases are read in real-time by the pore mentioned.
This method allows the sequencing of longer reads since there is no limitation due to a synthesis of the read. After the sequencing comes the basecalling execution that converts the signal received from the sequencing machine to nucleotides, this method eliminates the PCR bias as there is no PCR amplification. The use of long reads also circumvents issues in the reconstruction of genomes since the reads are longer and issues like repeats, gaps or contamination have less probability of influ-encing the assembly of the reads. However, this sequinflu-encing method also has disad-vantages, such as a lower precision on the base level. While it is easier to assemble and map long sequences of DNA together, the lack of precision on the base level makes the MinIon a lower argument when it comes for instance, to single nucleotide variants (SNVs).
2.4.2 Illumina Sequencing
The Illumina sequencing is a short-reads sequencing method that consists of the library preparation (including shearing, PCR, adding adapters). Then in the sequenc-ing machine, clusters of strands are created, followed by the synthesis of the strand clusters start. To each nucleotide-binding event, fluorescent light is emitted, and the reading of this sequential colour emission creates the reads. This method has many restrictions in terms of reads size as well as speed. However, it is more accurate on the base level than the long read NGS, which enables analysis of SNVs on a better and more accurate level.
2.4.3 RNA sequencing
RNA represents the active functions of the cell, where the DNA represents all the information of the organism (all structure and function the organism contains). There are mainly three essential types of RNA involved in the creation of the pro-teins that serves the activity of the cell. The mRNA that encodes the sequence of amino acids translated in proteins, the rRNA when combined with ribosomal pro-teins, forms the ribosomes which translate the mRNA into proteins and the tRNA that transport amino acids to the ribosome during the translation (Bastide and David 2018).
The more traditional RNA sequencing consists of the sampling of genetic mate-rial followed by isolation of the total RNA and removal of any residual DNA by DNase digestion. According to the RNA targeted (mRNA, rRNA), the use of spe-cific beads can be executed. This allows keeping only the targeted RNA, for in-stance, the mRNA. The RNA is then reverse transcripted to obtain cDNA(Sessitsch et al. 2002) that will be sheared, amplified and then sequenced in a short-read se-quencing machine.
The use of long-read sequencing machine can significantly reduce the library preparation, as it does not require any PCR amplification. When the sequencing of RNA is done in a Nanopore sequencing machine, the use of cDNA is not mandatory, and the use of native RNA is possible.
2.4.4 Metagenomics
Metagenomics in a broad term, includes two different methods to analyse the pop-ulation of a microbiome. One is the whole metagenomics shotgun sequencing, and the other is the 16s rRNA gene amplicon sequencing (Ghosh, Mehta, and Khan 2019).
Whole metagenomics shotgun sequencing consists of the sequencing of all DNA information of a microbiome sample without any isolation or culture of a specific organism.
The 16s rRNA gene sequencing is not a metagenomics method since the purpose is not to retrieve genomes of organisms in the microbiome. Nevertheless, it aims to identify organisms present in a microbiome by relying on the taxonomic information obtained from partial sequences of the 16s rRNA genes. The 16s method is based on the sequencing of amplicons retrieved by PCR of the 16s rRNA gene of all the organisms present in the sample. The procedure includes DNA extraction followed by a 16s rRNA gene amplification (Nurul et al. 2019) and sequencing (long or short reads).
2.5 Hybrid Assembly
A hybrid assembly is an assembly approach that uses both long and short reads. The assembly of long-reads alone is useful to avoid repeats and gaps in the reconstruc-tion of the genomes, but it also has flaws like the higher error rate on a base level, ranging from 15% to 40% (Ma et al. 2019). The short reads assembly does not pos-sess such an error rate and thus is useful for a base level analysis. In the case of the short reads assembly, the flaws are the gaps and repeats.
The hybrid assembly is tentative to combine the advantages of both sequencing methods to produce assemblies/genomes of a higher quality while trying to avoid their respective disadvantages.
2.6 Reproducibility
The reproducibility and ease to analyse are critical to scientific research. Automated pipelines are developed to lighten the charge of informatic work put on the searcher. Various pipelines already exist to automate the research (e.g., the nf-core collection of pipelines (Ewels et al. 2019)). They are based on workflow management systems such as nextflow or snakemake, and those management systems allow to create from scratch a pipeline but also make through the use of software containers that have everything ready for the use of the pipeline. Another advantage is the possibility to parallelise the work to speed up the process but also to use the workflow on high performance computing clusters and clouds. Making those pipelines highly porta-ble, adaptaporta-ble, powerful and easy to use.
2.7 Nextflow
Nextflow (Tommaso et al. 2017) is a workflow management system allowing high reproducibility through the use of software containers (such as docker or singular-ity). It is also oriented to the portable optimisation, and the pipeline is separated from the configuration of the system at use. Nextflow is developed to work on most HPC and server executors (SGE, SLURM,…) and also on cloud computing (Google Life Science, Amazon AWS). Nextflow is an efficient workflow management sys-tem with simplified utilisation both as developers and users. Indeed, it uses a global DSL regarding the construction of the pipeline while at the same time allowing the use of various programming languages (Python, Perl, R, Ruby) and scripting lan-guage (Bash script). It also provides tools to abstract and manages file naming in global variables to reduce the ambiguity (Leipzig 2017).
Part of the development of Nextflow is to create a new syntax that aims to sim-plify the conception and use of pipelines by changing the creation of a unique pro-cess for each task to the invocation of the said propro-cess from modules in a specific order. A module is simply a function or task saved in a different file that can be called in the main script. The creation of “modules” that can be used multiple times and use in different pipelines without the need to rewrite everything is the key to simplification.
This work aimed at the creation of a metagenomics and transcriptomics pipeline for microbial analysis. Moreover, it will be tested on the analysis of an anaerobic diges-tion system. The pipeline shall be able to be run by anyone that has access to a computer with basic Linux knowledge and biological data of interest.
It shall produce helpful and informative result files for the microbial analysis of an environmental sample or specific bacteria of interest. To achieve this, different objectives were decided:
- Find or create an ergonomic, automated, and reproducible analysing pipeline that would be able to combine the information of both the Illumina and MinIon sequencing.
- Obtain Metagenome-assembled genomes (MAGs) of good quality from this pipeline, as well as useful taxonomic classifications and functional annotations.
- Through the use of RNAseq, data obtain good quality and complementary transcriptomes.
- Access quickly results browsing summary files from the different objectives mentioned above.
4.1 Sample used
Out of all the samples prepared by Christian Brandt and Bettina Müller, only one DNA sample (Nanopore and Illumina) and one RNA sample (Illumina) from the same reactor was used in the Pipeline and will have the result display in “Results”. The samples are from a biogas reactor present in Uppsala. The following chapters (4.2 to 4.4) describe the extraction, library preparation and sequencing of different samples processed at the same time. In total for the DNA (nanopore and Illumina), 20 samples from 20 different biogas reactor (10 Swedish and 10 Germans) where sequenced. For the RNA, six samples from five different reactors where sequenced.
4.2 Nanopore DNA extraction, library preparation, and
sequencing
DNA extraction, library preparation, and sequencing were done by Christian Brandt (postdoc at SLU) for Nanopore sequencing.
This protocol for DNA extraction and Nanopore sequencing can be found in the submitted manuscript of Christian Brandt article 10.21203/rs.2.17734/v1 (Abun-dance Tracking by Long-Read Nanopore Sequencing of Complex Microbial Com-munities in Samples from 20 Different Biogas/Wastewater Plants).
All samples were sequenced using a MinION Sequencer for 72 hours or until no sequencing activity was observed, using either an R.4.9.1 or R.4.9 flow cell (FLO-MIN106) for each sample. The MinKNOW software was used with active channel selection enabled and basecalling deactivated. A ‘flow cell-refuel’ step after approx. 18-20 hours of runtime by adding 75 µL of a 1:1 water-SQB-Buffer mixture to the flow cell via the SpotON port. SQB-Buffer is part of the Oxford-Nanopore SQK-LSK109 Kit.
4.2.1 Basecalling
Basecalling was performed using the GPU accelerated guppy basecaller with the high accuracy model and adapter trimming (available at https://nanoporetech.com).
4.3 Illumina DNA extraction, library preparation, and
sequencing
Illumina sequencing was performed using the same DNA material (purified by Christian Brand) as it was used for nanopore sequencing.
4.4 mRNA extraction, library preparation, and Illumina
sequencing
mRNA preparation was done by Bettina Muller (associate Professor at SLU) as de-scribed in (Manzoor et al. 2016). 200 mg fresh digester sludge has been used as starting material.
Library preparation and sequencing were performed by Scilifelab using the TruSeq stranded mRNA library preparation kit (Illumina Inc.). In total, six mRNA pools were sequenced on one Miseq lane. After the cluster generation, the sequenc-ing was done and was a 75 cycles paired-end sequencsequenc-ing in one run.
4.5 Bioinformatic Workflow:
Having a functional and reproducible workflow to analyse the sample is essential as the complexity of the metagenomics tools and the interconnections between them is not always straightforward. Various workflows are already available such as MetaWRAP(Uritskiy, DiRuggiero, and Taylor 2018), Anvi’o (Eren et al. 2015), SAMSA2 (Westreich et al. 2018), Humann (Abubucker et al. 2012) or MG-RAST (Meyer et al. 2008) but none of them uses a hybrid approach. Creating a pipeline was the solution.
4.5.1 Making the pipeline
The pipeline should have a hybrid approach of the assembly of the reads, should be versatile (run on different Unix systems and configuration), easy to use, parallelised and should not require multiple additional installations.
To address the versatility and the parallelisation, the use of nextflow (Tommaso et al. 2017) as the workflow manager system appeared to be the best choice. It pro-vides an abstraction layer making the pipeline an unspecific script with the config-uration related to the platform used independently.
The use of Docker for the software containers makes the pipeline reproducible and not sensitive to the machine or software versions. Docker loads the required container, executes the software, output the result and closes itself, with no version
control or compatibility issues. In addition to Docker, we use conda as an environ-ment manager. It creates a dedicated environenviron-ment for the software to run, installs it, runs and done.
4.5.2 The pipeline (MUFFIN)
The pipeline called MUFFIN consists of three different steps that can be run to-gether or independently; the steps are “assemble,” “classify” and “annotate.” For the paper about MUFFIN, see Appendix n°3.
4.5.3 Assemble
Assemble is the first step; it requires the Illumina and nanopore reads as input. The first substep is the quality control, for the Illumina data by fastp (Chen et al. 2018), and for the nanopore, the default is a discard of the shortest reads (under 2000bp) and the use of Filtlong (https://github.com/rrwick/Filtlong ) as an option.
The second substep is the assembly of the reads. Two different assembly meth-ods are available. The one used in the example is the metagenomic and hybrid ap-proach of SPAdes (Bankevich et al. 2012; Nurk et al. 2017). The other method avail-able is the long read assembly using Flye (Kolmogorov et al. 2019) metagenomics approach. Flye is followed by a polishing of the contigs with, Racon (Vaser et al. 2017) , medaka (https://github.com/nanoporetech/medaka) and Pilon (Walker et al. 2014).
The third substep is the binning of the contigs obtained. Three different binning methods followed by a refining of the bins compose the substep. The binning meth-ods are CONCOCT (Alneberg et al. 2014), a binning method based on nucleotide composition – kmer frequencies and coverage data, MaxBin2 (Wu et al. 2014) using depth-of-coverage, nucleotide composition, and marker genes and MetaBAT2 (Kang et al. 2015) an adaptive binning algorithm. CONCOCT and MetaBAT2 can if provided, accept additional reads set to improve the binning through the use of differential binning. The result of those three binning is then inputted in the refining step of the MetaWRAP pipeline (Uritskiy, DiRuggiero, and Taylor 2018).
Once those bins obtain, an optional re-assembly substep remains. This substep consists of the mapping of the reads against the bins using SAMtools (Li et al. 2009) Minimap2 (Li 2018) and BWA (Li and Durbin 2009). Followed by the retrieval of the reads maps to each bin with seqtk (https://github.com/lh3/seqtk). Those re-trieved reads (Illumina and Nanopore) are then re-assembled using the Unicycler hybrid approach (Wick et al. 2017).
4.5.4 Classify
The classify step, requires either the bins or reassembled bins from the assemble step or bins submitted by the user.
The first substep is the quality assessment of the bins done by CheckM (Parks et al. 2015) using the CheckM database.
The second substep is the taxonomic classification of the bins by sourmash (Brown and Irber 2016) using the GT-DataBase (Parks et al. 2018).
4.5.5 Annotate
The last step requires the bins or reassembled bins from the assemble step or sub-mitted bins. It also can accept in addition to the bins, RNAseq data.
The annotation of the bins is done by eggNOG (Huerta-Cepas et al. 2017) using the eggNOG database version 5 (Huerta-Cepas et al. 2019). EggNOG is a powerful tool providing in the output KEGG (pathway, ko, module, reaction), Gene Ontology terms, EC numbers, COG, and other information.
The RNAseq data is quality controlled using fastp (Chen et al. 2018) followed by a de novo transcriptome assembly using Trinity (Haas et al. 2013) and Salmon
(Patro et al. 2017) the transcripts are then annotated by eggNOG (Huerta-Cepas et
al. 2017) using the eggNOG database version 5 (Huerta-Cepas et al. 2019).
The final substep is the execution of a parser for the annotation files that will create HTML files regrouping in an easily readable way the pathways present in the bins as well as the genes using the KEGG ID outputted in the annotation file with the KEGG PATHWAY database (see Figure n°3).
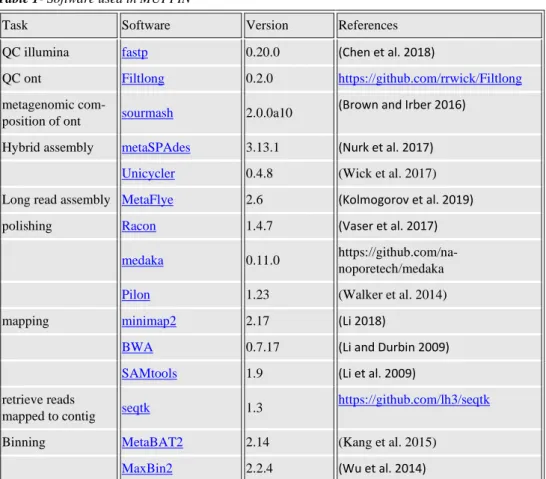
Table 1- Software used in MUFFIN
Task Software Version References
QC illumina fastp 0.20.0 (Chen et al. 2018)
QC ont Filtlong 0.2.0 https://github.com/rrwick/Filtlong
metagenomic
com-position of ont sourmash 2.0.0a10
(Brown and Irber 2016) Hybrid assembly metaSPAdes 3.13.1 (Nurk et al. 2017)
Unicycler 0.4.8 (Wick et al. 2017)
Long read assembly MetaFlye 2.6 (Kolmogorov et al. 2019)
polishing Racon 1.4.7 (Vaser et al. 2017)
medaka 0.11.0 https://github.com/na-noporetech/medaka
Pilon 1.23 (Walker et al. 2014)
mapping minimap2 2.17 (Li 2018)
BWA 0.7.17 (Li and Durbin 2009)
SAMtools 1.9 (Li et al. 2009)
retrieve reads
mapped to contig seqtk 1.3
https://github.com/lh3/seqtk
Binning MetaBAT2 2.14 (Kang et al. 2015)
Task Software Version References
CONCOCT 1.0.0 (Alneberg et al. 2014)
MetaWRAP 1.2.1 (Uritskiy, DiRuggiero, and Taylor 2018)
QC binning CheckM 1.0.18 (Parks et al. 2015)
Taxonomic Classifi-cation
sourmash using the GT-DataBase
Sour-mash:2.0.0a10 GTDB is ver-sion R89
(Brown and Irber 2016)(Parks et al. 2018)
Annotations (bin and
RNA) eggNOG
eggNOG db v5.0 eggNOG mapper v2.0.1
(Huerta-Cepas et al. 2017) (Huerta-Cepas et al. 2019)
De novo transcript
and quantification Trinity 2.8.5
(Haas et al. 2013)
4.5.6 The databases
The CheckM database is a collection of precalculated data used by CheckM to as-sign taxonomy and check the completeness and contamination of a bin. It is com-posed of markers genes grouped into lineage-specific collocated markers sets. Those markers sets are the critical element of CheckM to assess the completeness and con-tamination of a bin(Parks et al. 2015). CheckM database is limited to known markers
from known lineages and should be used as an indicator of the quality of the bins. If the work is on oriented lesser-known or unknown bacteria, CheckM results might not reflect the actual quality of the bin but only a grade of similarities between the bin and a potentially close lineage.
GT database (GTDB) or genome taxonomy database is a standardised microbial taxonomy database based on phylogeny. This database constructs its phylogeny us-ing genomes from RefSeq (O’Leary et al. 2016) and GenBank (Clark et al. 2016) but increasingly also using draft genomes of metagenomics and single-cell uncul-tured organisms trying to improve the genomic representation of the microbial world(source: https://gtdb.ecogenomic.org/about ).
eggNOG 5.0 database is a database of ortholog relationships, functional annota-tion, and gene evolutionary histories(Huerta-Cepas et al. 2019). Used by the egg-NOG annotation tool (eggegg-NOG mapper V2)(Huerta-Cepas et al. 2017), it forms both for the eggNOG service. EggNOG is a system for automated construction and annotation of orthologous groups of genes, using phylogenetic resolution, automat-ically updated, and contains a hierarchy of orthologous groups to balance phyloge-netic coverage and resolution(Jensen et al. 2008).
The KEGG PATHWAY database “is a database resource for understanding high-level functions and utilities of the biological system, such as the cell, the or-ganism and the ecosystem, from molecular-level information, especially large-scale molecular datasets generated by genome sequencing and other high-throughput ex-perimental technologies.” (source: https://www.kegg.jp/ ). It contains the different pathways as well as modules of those pathways, reaction, enzyme, gene, genomes.
The samples analysed are labelled “02-SW” biogas sample for the DNA and “BM03” sample for the RNA. 02-SW is a thermophilic (52°C) biogas reactor using slaughter and food waste.
5.1 Quality Control
5.1.1 Nanopore
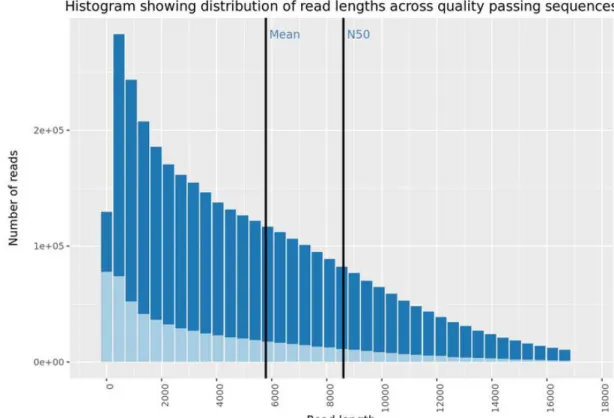
The quality of the nanopore sequencing was good with over 3.6 million reads pro-duced, 20 gigabases called, and 81.4% of reads passing the QC filter. The mean read length is 5.786bp, an N50 of 8.604, and the mean read quality (QV) is 10.3. The quality report was produced by Nanoplot (De Coster et al. 2018).
Figure 4 - The quality control output of nanopore sequencing after guppy basecalling.
The quality control of the pipeline was a strict removal of reads under 2000bp length.
5.1.2 Illumina
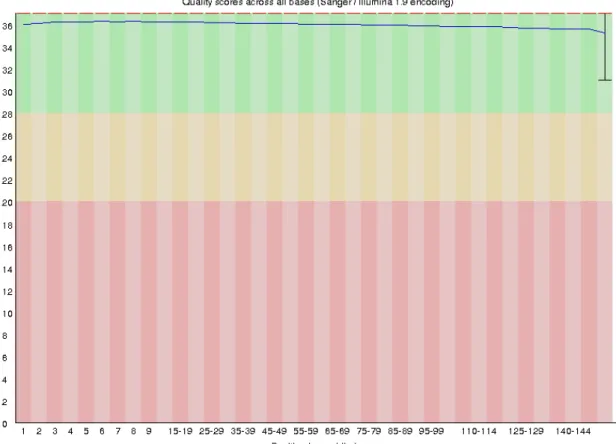
The quality of the raw Illumina reads was for R1 and R2, 18 946 658 reads with 46%GC, and a 151bp read length, the mean quality per read was 36 (Phred score).
Figure 5 - The per sequence quality of the Illumina R1 read before any quality improvement with fastp.
The changes after fastp are the discard of the reads under 20 Phred score quality and the removal of an overrepresented sequence, a G nucleotide repetition present over 21 000 times.
5.1.3 RNA
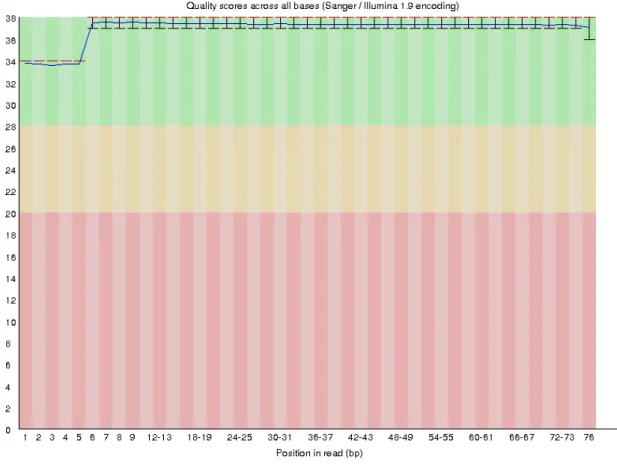
The quality of the raw Illumina reads was for R1 and R2, 4973956 reads with 48%GC, and a 76bp read length, the mean quality per read was 37 (Phred score).
Figure 6 - The per sequence quality of the RNAseq R1 read before any quality improvement with fastp.
The changes after fastp are the discard of the reads under 19 Phred score quality and a slight diminution of the overrepresented sequences.
The quality results were computed by FastQC(Andrews et al. 2012).
5.2 Assembly
The assembly longest read is 266.071bp long, and there are 4.149 contigs longer than 10.000bp (26 306 contigs longer than 1000bp).
5.3 Binning
Two significant elements are used to assess the quality by CheckM: 1) The com-pleteness. This is the % of gene markers sets of an organism in the CheckM database present in the bin. 2) The contamination. This is the % of gene markers sets of for-eign organisms from the one attributed by CheckM in the bin.
The binning substep produced a total of 35 bins with completeness estimated by CheckM of 71.16% at lowest (bin 20) and 99.60% at highest (bin 16) and with con-tamination of 6.78% at the highest (bin 18) and lowest 0% concon-tamination. The mean percentage of completeness is 90.99%, and for the contamination, it is 1.38%.
MaxBin2 produced 51 bins; MetaBAT2 produced 60 bins, and CONCOCT pro-duced 138 bins. The binning and binning refinement only keeps the contigs they deem appropriate to the bins. MUFFIN can take the unbinned data and retrieve the reads from the sample that are not part of the bins. This can be very convenient as in the analysis of metagenomics, the genomic data of some organisms with a low population can be “hidden” in the analysis by organisms that represent a high pro-portion of the communities. MUFFIN allows the preservation of the unbinned data to rerun the analysis once the data of the highly present organism has been analysed. The second run of MUFFIN would then be more specific to lowly abundant organ-isms.
5.4 CheckM vs Sourmash (GTDB) classification
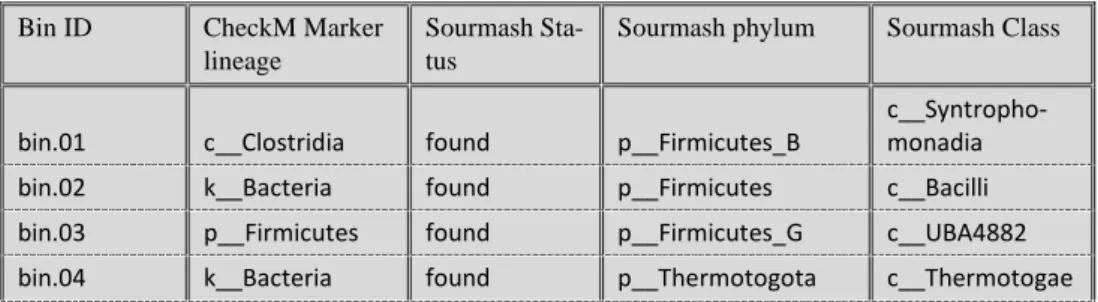
CheckM database is limited compared to the GTDB, but the comparison of the 2 showed that sourmash classify on a more specific level while also showing some disagreement between CheckM hit and sourmash (using the GTDB). GTDB also distinguishes the Firmicutes phylum in different phylum (e.g., Firmicutes_A, Fir-micutes_b, Firmicutes_G). The complete table including CheckM quality control and Sourmash with the complete taxonomic resolution can be found in Appendix n°1
Table 2- Bins with their respective lineage from CheckM and sourmash (GTDB). Sourmash was lim-ited to the class level, see Appendix n°1 for the complete taxonomic resolution.
Bin ID CheckM Marker lineage
Sourmash Sta-tus
Sourmash phylum Sourmash Class
bin.01 c__Clostridia found p__Firmicutes_B c__Syntropho-monadia bin.02 k__Bacteria found p__Firmicutes c__Bacilli bin.03 p__Firmicutes found p__Firmicutes_G c__UBA4882 bin.04 k__Bacteria found p__Thermotogota c__Thermotogae
bin.05 o__Clostridiales found p__Firmicutes_A c__Clostridia bin.06 p__Firmicutes found p__Firmicutes_B c__Syntropho-monadia bin.07 c__Clostridia found p__Firmicutes_A c__Clostridia bin.08 o__Clostridiales nomatch
bin.09 p__Firmicutes found p__Firmicutes_G c__SHA-98 bin.10 p__Euryarchae-ota found p__Halobacterota c__Methanomi-crobia bin.11 p__Firmicutes found p__Firmicutes_G c__Limnochordia bin.12 k__Bacteria found p__Thermotogota c__Thermotogae bin.13 k__Bacteria disagree p__Bacteroidota c__Bacteroidia bin.14 o__Clostridiales found p__Firmicutes_A c__Clostridia
bin.15 p__Firmicutes found p__DTU030 c__DTU030
bin.16 p__Euryarchae-ota found p__Thermoplasma-tota c__Thermoplas-mata bin.17 p__Firmicutes nomatch
bin.18 k__Bacteria found p__Caldatribacteri-ota c__Caldatribac-teriia bin.19 p__Bacteroide-tes found p__Bacteroidota c__Bacteroidia bin.20 k__Bacteria nomatch
bin.21 p__Firmicutes found p__Firmicutes_G c__Limnochordia bin.22 p__Firmicutes nomatch
bin.23 k__Bacteria found p__Caldatribacteri-ota c__Caldatribac-teriia bin.24 k__Bacteria found p__Firmicutes c__Bacilli bin.25 p__Firmicutes found p__Firmicutes_G c__SHA-98 bin.26 p__Firmicutes disagree p__Firmicutes_G
bin.27 p__Firmicutes found p__Firmicutes_E c__DTU015 bin.28 p__Firmicutes nomatch
bin.29 p__Firmicutes found p__Firmicutes_A c__Thermove-nabulia bin.30 p__Firmicutes found p__Firmicutes_G c__Limnochordia bin.31 p__Firmicutes nomatch
bin.32 p__Firmicutes found p__Firmicutes_F c__Halanaero-biia bin.33 p__Firmicutes found p__Firmicutes_D c__Dethiobacte-ria bin.34 p__Firmicutes found p__Firmicutes_G c__DTU065 bin.35 k__Bacteria nomatch
5.5 RNA
de novo
Transcripts
The de novo transcript file produced by Trinity contained 48 283 transcripts and 43 426 “genes” with 44.26%GC. Based on all transcript contigs, the contig N50 is 899, the average contig length was 615.85, and the total assembled bases were 29 735 097 bases. Based on only the longest isoform per “gene,” the N50 is 640, the average contig length is 529.44, and the total of assembled bases is 22 991 484 bases.
Those results are from the TrinityStats.pl scripts of Trinity (Haas et al. 2013). The quantification of all the transcripts is normalised using the TPM methods and done by Salmon (Patro et al. 2017). We can deduce, from the total of assembled bases, that of the four million reads with a length of 75bp, most of them were used in the transcript assembly.
5.6 EggNOG annotation parsed.
The annotation of the RNAseq was done on all the transcripts produced, and there was no threshold of minimum quantification required. The annotation of the bins and RNAseq data by eggNOG gives as an output both ID of the KEGG pathway and ID of the KEGG orthology in the result files the said orthology ID (ko number) are called “genes” to simplify the explanations, each ko number represent one or multiple genes that are registered as different entries for different organisms. In the intent of making them more transparent and more straightforward for the HTML, the use of the ko number was chosen over the use of the gene name or entry of an arbitrary organism.
In the annotation of the bins, a total of 249 different pathways were found. In the annotation of the RNAseq data, 305 pathways were found. This difference of path-ways found could be due to the use of only a majority of the initial genomic data as during the binning, some portion of the data was not associated with one of the 35 bins. There is also a difference in sequence depth. The depleted RNA was sequenced with more depth than the DNA.
Moreover, a part of the data was also not annotated. This could be due to a lack of information for those DNA sequences in the database or the fact that those se-quences are incomplete as well as in regards to the annotation, a non-utility of those sequences. Only further research about those sequences could answer this. Se-quences that did not contain annotation information about pathway while still being annotated for another database (GO term, BiGG Reaction, BRITE, CAZy).
The number of pathways being substantial, only a few will be shown here as an example(chapters 5.6.1 to 5.6.3). The chosen pathways are methane metabo-lism(ko00680), carbon metabolism(ko01200) that contains Acetogen module
(M00618), and glycolysis (ko00010). Those three pathways are involved in anaer-obic degradation process to produce methane.
The point 5.6.1 to 5.6.3 are a rough representation of the presence of “gene” in the pathways. Unfortunately, the system put in place to give visual representation is limited to a total of 119 highlighted “genes” at a time in the pathway. This means that in the case of a number of genes superior to 119, the list must be reduced to 119 or lower to create the figure, and you can repeat the creation of the figure as much as needed with other subsets of the list. Here only 1 figure is shown so if the gene is highlighted it show the presence but if it is not highlighted, the creation of the other figure is required to assess graphically the absence of the said “gene.”
5.6.1 The glycolysis
The glycolysis pathway is an example of a pathway highlighted by the parser. In the sample tested, the glycolysis pathway contains a total of 136 “genes” in the RNAseq data. We can see from figure n°7 that the RNAseq data express most of the pathway genes. The number of “genes” present in both the bins and the RNAseq (denominated as “expressed”) as well as the number of “genes” present in only in the bins but not in the RNAseq data (denominated as “non-expressed”) are in the APPENDIX n° 2. In the APPENDIX n°2 is also present the figure of the “expressed genes” and the figure of the “non-expressed genes.”
Figure 7- The glycolysis pathway with 119 out of 136 “genes” highlighted in purple
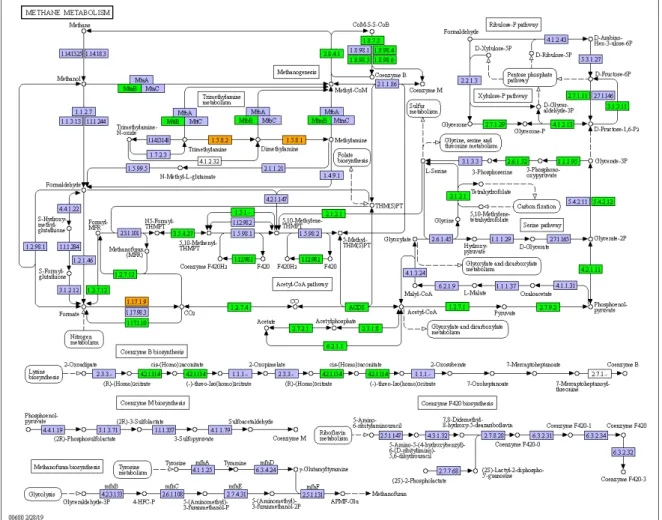
5.6.2 The methane metabolism
The methane metabolism pathway is an example of a pathway highlighted by the parser. In the sample tested, the methane metabolism contains a total of 206 “genes” in the RNAseq data. We can see from figure n°8 that a majority of the gene present in the bins are present in the RNAseq data (green). The number of “genes” present
in both the bins and the RNAseq data (denominated as “expressed”) as well as the number of “genes” present in only in the bins but not in the RNAseq data (denomi-nated as “non-expressed”) are in the APPENDIX n°2. In the APPENDIX n°2 is also present the figure of the RNA “genes” and the figure of the bins “genes” without distinction by the presence of it in RNAseq data.
Figure 8- The methane metabolism pathway with the “expressed genes” highlighted in green and the “non-expressed genes” highlighted in orange.
5.6.3 The carbon metabolism
The carbon metabolism pathway is an example of a pathway highlighted by the par-ser. In the sample tested, the carbon metabolism contains a total of 383 “genes” in
the RNAseq data. We can see from figure n°9 that most of the pathway is expressed by the RNAseq data while being present in the bins MAGs. The number of “genes” present in both the bins and the RNAseq data (denominated as “expressed”) as well as the number of “genes” present only in the bins but not in the RNAseq data (de-nominated as “non-expressed”) are in the APPENDIX n°2. In the APPENDIX n° 2 is also present the figure of the “non-expressed genes” and the figure of the RNA “genes.”
6.1 Using Hybrid assembly
The long-read assembly has the advantages of avoiding the repeats and the gaps that can be produced in the assembly of the short reads. While short-read assembly is more accurate on the base level but has a higher risk of misassemblies through gaps and repeats.
6.2 Using three binning methods and a binning refiner
The different binning algorithms all have errors and weaknesses. That is why the use of binning refinement such as in MetaWRAP (Uritskiy, DiRuggiero, and Taylor 2018), DAS_Tool (Sieber et al. 2018), and Binning refiner (Song and Thomas 2017) is developed. The bin refinement uses the bins obtained from different methods to analyse and characterise their accuracy and then use the best elements of each method to output the best bins. This is showed by an improvement of the complete-ness and a diminution of the contamination assessed by CheckM.6.3 Use GTDB with sourmash for classification
Two factors motivated the use of sourmash with the genome taxonomy database (GTDB). Sourmash is proven to be an efficient classification software using Min-Hash sketches of genomic data. The main advantages of this software are the high processing speed of sourmash as it is based on hashes produced from public data-bases and not the said datadata-bases. This also helps in the size of the database and the accessibility; a laptop can run sourmash on a database with no issue whatsoever and in an acceptable time (Breitwieser, Lu, and Salzberg 2019).
The GTDB was converted to a sourmash database with sourmash. The use of the GTDB is essential in the classification of MAGs from biogas reactor as GTDB in-clude good quality draft genomes from such samples besides the RefSeq and Gen-bank databases.
6.4 Why use eggNOG to annotate
The eggNOG-Mapper is a tool that revolves around the adaptation of the annotation requirement (speed, accuracy). It can use both a HMMs database with HMMer3 (Eddy 2011) to map the query sequence then creates orthologous groups, or it can use a protein database with diamond to obtain the seed eggNOG orthologs that are then analysed the same way (Buchfink, Xie, and Huson 2015).
The use of the diamond method combined with the eggNOG 5.0 database leads to a fast and accurate annotation. Where Blast and InterProScan show a slightly worse result for a higher computational time (Huerta-Cepas et al. 2017).
6.5 Gene expression
The gene expression of the RNAseq data has a limited reach. Indeed, the output of the quantification only gives a TPM normalized quantification of the transcripts in the sample. Thus, the quantification can solely be useful for the understanding of expression level in the sample at a specific time. Due to the RNA sequencing of the microbial community in the sample and not independent organisms, only interpre-tation on the sample level can be made.
6.6 Graphical display
One of the significant issues with the actual display of the pathway with “genes” presence is the limitation of 119 “genes” entry at a time for the graphical display. It was chosen to redirect the pathway directly to the online KEGG DB as the number of figures to download and store to display with an offline mode would be too ex-cessive.
The graphical display of the pathway is an additional feature that is helpful for the visualisation and comprehension of the “genes” involvement in the pathways activities. Nevertheless, when it is impossible to access, the use of manual search or reduction of the list of genes to display can offer more limited information.
6.7 MUFFIN limitations
Creating an automated pipeline also leads to some limitations. The use of the three steps of the pipeline can increase the computational charge when the aim is on a smaller number of bins or a particular organism. That is why each step can also be run individually, making a stop after the first and second steps to allow the manual narrowing of the data to analyse. For example, a sample gives 42 bins. You can
decide either to use all of them in the next steps, or reduce the number of bins, or decide after the CheckM quality check and the taxonomic classification to keep only the bins over XX% of completeness and from the YY lineage.
Another limitation is the lack of liberty for the user to tweak each software, and this was a choice made to have an ergonomic and straightforward pipeline. People who will want to configure everything manually will tend to run each software in-dividually with the desired parameter.
This project results in the creation of a metagenomics analysis pipeline supported by de novo transcriptomics (MUFFIN). That is reproducible, automated, and simple of utilisation. This pipeline can use hybrid assembly methods to increase the com-pleteness but also the base level quality of the MAGs produced. It also produces taxonomic classification and bin qualities, bin and transcript annotation, transcript expression on the number of reads for each transcript (TPM normalised), and finally simple HTML summary files to show the pathway present in the bins and the in-volvement of the said bin in the pathways.
The data used to test this pipeline showed that the assembly and the binning steps produced a fair number of bins (35 bins) with overall good quality, over 70% com-pleteness and less than 2% contamination for all bins. The taxonomic classification showed similar hits as in other studies while also opening to new potential discov-eries. The annotation is also a source of various information that can be utilized for further and more in-depth researches on the microbial population and interaction.
Further research on bins 6, 21 and 23 could be of great interest as the result of the pipeline show a good level of completeness with low contamination (APPEN-DIX n°1). The classification indicates them as “Thermacetogeniaceae,” “unclassi-fied clostridium,” and “Caldatribacteriaceae,” respectively (Appendix n°1), and the annotation shows their substantial involvement in the methane and carbon metabo-lism pathways (APPENDIX n°2).
MUFFIN could benefit in the future of different improvements such as a file that summarises all the taxonomic classification effectuate by MetaWRAP, CheckM, eggNOG, and Sourmash; creating a list of all the found ko IDs (from KEGG DB) that are not involved in a pathway according to the eggNOG annotation.
It could also benefit of the addition some more statistics and information in the HTML such as the total of ko IDs found versus the ko IDs found with a KEGG pathway; the percentage of ko present in the pathway versus what is found in the RNA, bins, individual bin; a distribution of the pathways (e.g., the most abundant pathways in the bins).
To place the classified bin in a graphical phylogenetic tree, create the option to output the graphical pathway with the complete set of genes.
Another improvement would be to create an advance user and wizard user con-figuration file that would allow the user to tweak all the different parameters of all the software as desired.
MUFFIN could also benefit from the addition of new analysis software such as differential expression analysis, short reads assembly methods. Another improve-ment of the MUFFIN pipeline would be to diversify the sources for the reads input. The use of Pacific Biosciences sequenced reads for example.
I would first like to thank my supervisors Erik Bongcam-Rudlof, Bettina Müller and Christian Brandt for their support through this work, the different suggestion to im-prove the pipeline, the exciting discussion, and the opportunity to integrate into their groups at the Swedish University of Agricultural Sciences.
I would like to thanks Hadrien Gourlé and Mortiz Buck for their advice and sug-gestions.
Also, I would like to thanks David Coornaert, Françoise Besanger and Aline Le-onet for being the sparks of my motivation toward scientific research and bioinfor-matics. I also thank them for the chance they gave me to discover Uppsala and the SLU during my bachelor internship.
Lastly, I would like to thanks my family for their support through this journey and especially my dad for making me curious about everything and giving me the stubbornness of continuing my projects no matter what.
Abubucker, Sahar, Nicola Segata, Johannes Goll, Alyxandria M. Schubert, Jacques Izard, Brandi L. Cantarel, Beltran Rodriguez-Mueller, et al. 2012. ‘Metabolic Reconstruction for Metagenomic Data and Its Application to the Human Microbiome’. PLOS Computational Biology 8 (6): e1002358. https://doi.org/10.1371/journal.pcbi.1002358.
Alneberg, Johannes, Brynjar Smári Bjarnason, Ino de Bruijn, Melanie Schirmer, Joshua Quick, Umer Z. Ijaz, Leo Lahti, Nicholas J. Loman, Anders F. Andersson, and Christopher Quince. 2014. ‘Binning Metagenomic Contigs by Coverage and Composition’. Nature Methods 11 (11): 1144– 46. https://doi.org/10.1038/nmeth.3103.
Andrews, Simon, Felix Krueger, Anne Segonds-Pichon, Laura Biggins, Christel Krueger, and Steven Wingett. 2012. FastQC. Babraham, UK.
Angelidaki, Irini, Dimitar Karakashev, Damien J. Batstone, Caroline M. Plugge, and Alfons J. M. Stams. 2011. ‘Chapter Sixteen - Biomethanation and Its Potential’. In Methods in Enzymology, edited by Amy C. Rosenzweig and Stephen W. Ragsdale, 494:327–51. Methods in Methane Me-tabolism, Part A. Academic Press. https://doi.org/10.1016/B978-0-12-385112-3.00016-0. Arafat, Hassan A., Kenan Jijakli, and Amimul Ahsan. 2015. ‘Environmental Performance and
En-ergy Recovery Potential of Five Processes for Municipal Solid Waste Treatment’. Journal of Cleaner Production, Decision-support models and tools for helping to make real progress to more sustainable societies, 105 (October): 233–40. https://doi.org/10.1016/j.jclepro.2013.11.071. Atelge, M. R., David Krisa, Gopalakrishnan Kumar, Cigdem Eskicioglu, Dinh Duc Nguyen, Soon
Woong Chang, A. E. Atabani, Alaa H. Al-Muhtaseb, and S. Unalan. 2018. ‘Biogas Production from Organic Waste: Recent Progress and Perspectives’. Waste and Biomass Valorization, De-cember. https://doi.org/10.1007/s12649-018-00546-0.
Bankevich, Anton, Sergey Nurk, Dmitry Antipov, Alexey A. Gurevich, Mikhail Dvorkin, Alexander S. Kulikov, Valery M. Lesin, et al. 2012. ‘SPAdes: A New Genome Assembly Algorithm and Its Applications to Single-Cell Sequencing’. Journal of Computational Biology 19 (5): 455–77. https://doi.org/10.1089/cmb.2012.0021.
Bastide, Amandine, and Alexandre David. 2018. ‘Interaction of RRNA with MRNA and TRNA in Translating Mammalian Ribosome: Functional Implications in Health and Disease’. Biomole-cules 8 (4). https://doi.org/10.3390/biom8040100.
Botello Suárez, Wilmar Alirio, Juliana da Silva Vantini, Rose Maria Duda, Poliana Fernanda Giachetto, Leandro Carrijo Cintra, Maria Inês Tiraboschi Ferro, and Roberto Alves de Oliveira. 2018. ‘Predominance of Syntrophic Bacteria, Methanosaeta and Methanoculleus in a Two-Stage up-Flow Anaerobic Sludge Blanket Reactor Treating Coffee Processing Wastewater at High Or-ganic Loading Rate’. Bioresource Technology 268 (November): 158–68.
https://doi.org/10.1016/j.biortech.2018.06.091.
Breitwieser, Florian P, Jennifer Lu, and Steven L Salzberg. 2019. ‘A Review of Methods and Data-bases for Metagenomic Classification and Assembly’. Briefings in Bioinformatics 20 (4): 1125– 36. https://doi.org/10.1093/bib/bbx120.
Brown, C., and Luiz Irber. 2016. ‘Sourmash: A Library for MinHash Sketching of DNA’. Journal of Open Source Software. 14 September 2016. https://doi.org/10.21105/joss.00027.
Buchfink, Benjamin, Chao Xie, and Daniel H. Huson. 2015. ‘Fast and Sensitive Protein Alignment Using DIAMOND’. Nature Methods 12 (1): 59–60. https://doi.org/10.1038/nmeth.3176. Chen, Shifu, Yanqing Zhou, Yaru Chen, and Jia Gu. 2018. ‘Fastp: An Ultra-Fast All-in-One FASTQ
Preprocessor’. Bioinformatics 34 (17): i884–90. https://doi.org/10.1093/bioinformatics/bty560. Clark, Karen, Ilene Karsch-Mizrachi, David J. Lipman, James Ostell, and Eric W. Sayers. 2016.
‘GenBank’. Nucleic Acids Research 44 (D1): D67–72. https://doi.org/10.1093/nar/gkv1276. De Coster, Wouter, Svenn D’Hert, Darrin T. Schultz, Marc Cruts, and Christine Van Broeckhoven.
2018. ‘NanoPack: Visualizing and Processing Long-Read Sequencing Data’. Bioinformatics 34 (15): 2666–69. https://doi.org/10.1093/bioinformatics/bty149.
Eddy, Sean R. 2011. ‘Accelerated Profile HMM Searches’. PLoS Computational Biology 7 (10): e1002195. https://doi.org/10.1371/journal.pcbi.1002195.
Eren, A. Murat, Özcan C. Esen, Christopher Quince, Joseph H. Vineis, Hilary G. Morrison, Mitchell L. Sogin, and Tom O. Delmont. 2015. ‘Anvi’o: An Advanced Analysis and Visualization Plat-form for ‘omics Data’. PeerJ 3 (October): e1319. https://doi.org/10.7717/peerj.1319. Eriksson, Mattias, Ingrid Strid, and Per-Anders Hansson. 2015. ‘Carbon Footprint of Food Waste
Management Options in the Waste Hierarchy – a Swedish Case Study’. Journal of Cleaner Pro-duction 93 (April): 115–25. https://doi.org/10.1016/j.jclepro.2015.01.026.
Ewels, Philip A., Alexander Peltzer, Sven Fillinger, Johannes Alneberg, Harshil Patel, Andreas Wilm, Maxime Ulysse Garcia, Paolo Di Tommaso, and Sven Nahnsen. 2019. ‘Nf-Core: Commu-nity Curated Bioinformatics Pipelines’. BioRxiv, April, 610741. https://doi.org/10.1101/610741. Ghosh, Arpita, Aditya Mehta, and Asif M. Khan. 2019. ‘Metagenomic Analysis and Its
Applica-tions’. In Encyclopedia of Bioinformatics and Computational Biology, edited by Shoba Ranga-nathan, Michael Gribskov, Kenta Nakai, and Christian Schönbach, 184–93. Oxford: Academic Press. https://doi.org/10.1016/B978-0-12-809633-8.20178-7.
Haas, Brian J., Alexie Papanicolaou, Moran Yassour, Manfred Grabherr, Philip D. Blood, Joshua Bowden, Matthew Brian Couger, et al. 2013. ‘De Novo Transcript Sequence Reconstruction from RNA-Seq Using the Trinity Platform for Reference Generation and Analysis’. Nature Pro-tocols 8 (8): 1494–1512. https://doi.org/10.1038/nprot.2013.084.
Huerta-Cepas, Jaime, Kristoffer Forslund, Luis Pedro Coelho, Damian Szklarczyk, Lars Juhl Jensen, Christian von Mering, and Peer Bork. 2017. ‘Fast Genome-Wide Functional Annotation through Orthology Assignment by EggNOG-Mapper’. Molecular Biology and Evolution 34 (8): 2115– 22. https://doi.org/10.1093/molbev/msx148.
Huerta-Cepas, Jaime, Damian Szklarczyk, Davide Heller, Ana Hernández-Plaza, Sofia K. Forslund, Helen Cook, Daniel R. Mende, et al. 2019. ‘EggNOG 5.0: A Hierarchical, Functionally and Phy-logenetically Annotated Orthology Resource Based on 5090 Organisms and 2502 Viruses’. Nu-cleic Acids Research 47 (D1): D309–14. https://doi.org/10.1093/nar/gky1085.
Jensen, Lars Juhl, Philippe Julien, Michael Kuhn, Christian von Mering, Jean Muller, Tobias Doerks, and Peer Bork. 2008. ‘EggNOG: Automated Construction and Annotation of Orthologous Groups of Genes’. Nucleic Acids Research 36 (Database issue): D250–54.
https://doi.org/10.1093/nar/gkm796.
Kang, Dongwan D., Jeff Froula, Rob Egan, and Zhong Wang. 2015. ‘MetaBAT, an Efficient Tool for Accurately Reconstructing Single Genomes from Complex Microbial Communities’. PeerJ 3: e1165. https://doi.org/10.7717/peerj.1165.
Kolmogorov, Mikhail, Jeffrey Yuan, Yu Lin, and Pavel A. Pevzner. 2019. ‘Assembly of Long, Er-ror-Prone Reads Using Repeat Graphs’. Nature Biotechnology 37 (5): 540–46.
https://doi.org/10.1038/s41587-019-0072-8.
Lee, Joonyeob, Eunji Kim, Gyuseong Han, Jovale Vincent Tongco, Seung Gu Shin, and Seokhwan Hwang. 2018. ‘Microbial Communities Underpinning Mesophilic Anaerobic Digesters Treating
Food Wastewater or Sewage Sludge: A Full-Scale Study’. Bioresource Technology 259 (March). https://doi.org/10.1016/j.biortech.2018.03.052.
Leipzig, Jeremy. 2017. ‘A Review of Bioinformatic Pipeline Frameworks’. Briefings in Bioinformat-ics 18 (3): 530–36. https://doi.org/10.1093/bib/bbw020.
Li, Heng. 2018. ‘Minimap2: Pairwise Alignment for Nucleotide Sequences’. Bioinformatics 34 (18): 3094–3100. https://doi.org/10.1093/bioinformatics/bty191.
Li, Heng, and Richard Durbin. 2009. ‘Fast and Accurate Short Read Alignment with Burrows– Wheeler Transform’. Bioinformatics 25 (14): 1754–60. https://doi.org/10.1093/bioinformat-ics/btp324.
Li, Heng, Bob Handsaker, Alec Wysoker, Tim Fennell, Jue Ruan, Nils Homer, Gabor Marth, Gon-calo Abecasis, and Richard Durbin. 2009. ‘The Sequence Alignment/Map Format and SAMtools’. Bioinformatics 25 (16): 2078–79. https://doi.org/10.1093/bioinformatics/btp352. Liu, Yuchen, and William B. Whitman. 2008. ‘Metabolic, Phylogenetic, and Ecological Diversity of
the Methanogenic Archaea’. Annals of the New York Academy of Sciences 1125 (1): 171–89. https://doi.org/10.1196/annals.1419.019.
Ma, Zhanshan (Sam), Lianwei Li, Chengxi Ye, Minsheng Peng, and Ya-Ping Zhang. 2019. ‘Hybrid Assembly of Ultra-Long Nanopore Reads Augmented with 10x-Genomics Contigs: Demon-strated with a Human Genome’. Genomics 111 (6): 1896–1901. https://doi.org/10.1016/j.yg-eno.2018.12.013.
Manzoor, Shahid, Erik Bongcam-Rudloff, Anna Schnürer, and Bettina Müller. 2016. ‘Genome-Guided Analysis and Whole Transcriptome Profiling of the Mesophilic Syntrophic Acetate Oxi-dising Bacterium Syntrophaceticus Schinkii’. PLOS ONE 11 (11): e0166520.
https://doi.org/10.1371/journal.pone.0166520.
Mesle, Margaux, Gilles Dromart, and Phil Oger. 2013. ‘Microbial Methanogenesis in Subsurface Oil and Coal’. Research in Microbiology 164 (July). https://doi.org/10.1016/j.resmic.2013.07.004. Meyer, F., D. Paarmann, M. D’Souza, R. Olson, EM Glass, M. Kubal, T. Paczian, et al. 2008. ‘The
Metagenomics RAST Server – a Public Resource for the Automatic Phylogenetic and Functional Analysis of Metagenomes’. BMC Bioinformatics 9 (1): 386. https://doi.org/10.1186/1471-2105-9-386.
Nurk, Sergey, Dmitry Meleshko, Anton Korobeynikov, and Pavel A. Pevzner. 2017. ‘MetaSPAdes: A New Versatile Metagenomic Assembler’. Genome Research 27 (5): 824–34.
https://doi.org/10.1101/gr.213959.116.
Nurul, Ashyikin Noor Ahmad, Danish-Daniel Muhammad, Victor Tosin Okomoda, and Ariffin Asma Bt. Nur. 2019. ‘16S RRNA-Based Metagenomic Analysis of Microbial Communities As-sociated with Wild Labroides Dimidiatus from Karah Island, Terengganu, Malaysia’. Biotechnol-ogy Reports 21 (January). https://doi.org/10.1016/j.btre.2019.e00303.
O’Leary, Nuala A., Mathew W. Wright, J. Rodney Brister, Stacy Ciufo, Diana Haddad, Rich McVeigh, Bhanu Rajput, et al. 2016. ‘Reference Sequence (RefSeq) Database at NCBI: Current Status, Taxonomic Expansion, and Functional Annotation’. Nucleic Acids Research 44 (D1): D733-745. https://doi.org/10.1093/nar/gkv1189.
Parks, Donovan H., Maria Chuvochina, David W. Waite, Christian Rinke, Adam Skarshewski, Pierre-Alain Chaumeil, and Philip Hugenholtz. 2018. ‘A Standardized Bacterial Taxonomy Based on Genome Phylogeny Substantially Revises the Tree of Life’. Nature Biotechnology 36 (10): 996–1004. https://doi.org/10.1038/nbt.4229.
Parks, Donovan H., Michael Imelfort, Connor T. Skennerton, Philip Hugenholtz, and Gene W. Ty-son. 2015. ‘CheckM: Assessing the Quality of Microbial Genomes Recovered from Isolates, Sin-gle Cells, and Metagenomes’. Genome Research 25 (7): 1043–55.