1-2011
Enhancing Bag-of-Words Models by Efficient
Semantics-Preserving Metric Learning
Lei WU
Michigan State University
Steven C. H. HOI
Singapore Management University
, [email protected]
DOI:
https://doi.org/10.1109/MMUL.2011.7
Follow this and additional works at:
https://ink.library.smu.edu.sg/sis_research
Part of the
Databases and Information Systems Commons
, and the
Theory and Algorithms
Commons
This Journal Article is brought to you for free and open access by the School of Information Systems at Institutional Knowledge at Singapore Management University. It has been accepted for inclusion in Research Collection School Of Information Systems by an authorized administrator of Institutional Knowledge at Singapore Management University. For more information, please [email protected].
Citation
WU, Lei and HOI, Steven C. H.. Enhancing Bag-of-Words Models by Efficient Semantics-Preserving Metric Learning. (2011).IEEE Multimedia. 18, (1), 24-37. Research Collection School Of Information Systems.
Enhancing
Bag-of-Words Models
with
Semantics-Preserving
Metric Learning
Lei Wu Michigan State University Steven C.H. Hoi Nanyang Technological UniversityI
mage annotation is an importanttech-nique to enable users to search massive, unlabeled images using existing text-retrieval tools. Recent years have witnessed intensive research on image annotation and object recognition. For exam-ple, some studies have employed search-based annotation methods to annotate an image with common tags of similar images retrieved
from tagged image databases,1and some
stud-ies have formulated image annotation as a
stan-dard classification problem.2,3 One of the key
issues for existing image-annotation methods is to find an effective feature representation for images. Recently, the bag-of-words (BoW)
model4has been actively studied for image
rep-resentation. The BoW approach takes advan-tages of some recent advances in computer vision, such as the powerful scale invariant feature transform (SIFT) feature descriptor
technique.5
In the SIFT method, BoW first builds a code-book by collecting SIFT descriptors and
cluster-ing them intokclusters using some existing
clustering algorithm (for example,k-means6).
With the codebook that is formed by the
centroids of the resultingkclusters, BoW
repre-sents any image as a histogram of the code-words, which can be adopted for any existing classification or annotation methods. One key limitation of the existing BoW model is that semantics are lost during the codebook-generation process, which may considerably harm the discrimination capabilities of the BoW representation due to the well-known issue of the semantic gap.
To overcome the drawback of the regular BoW model, this article introduces a promising scheme of semantics-preserving metric learning (SPML), which considers the distance between the semantically identical features as a mea-surement of the semantic gap, and is designed to learn an optimized metric by minimizing this semantic gap to build more effective code-books for BoW. The task can be formulated as a distance-metric learning problem with side in-formation, which is generally a semidefinite programming problem. We first discuss a batch optimization algorithm to effectively
resolve the optimization task,7 followed by
presenting a novel, online SPML algorithm (OSPML) to ensure our technique is efficient and scalable for large-scale applications.
In this article we investigate the challenge of reducing the semantic gap for building BoW models for image representation; propose a novel OSPML algorithm for enhancing BoW by minimizing the semantic loss, which is effi-cient and scalable for enhancing BoW models for large-scale applications; apply the proposed technique for large-scale image annotation and object recognition; and compare it to the state of the art.
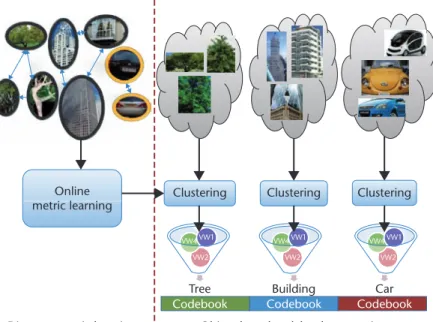
Algorithm framework
We propose an SPML algorithm for improv-ing the process of BoW’s visual-words genera-tion. Figure 1 illustrates the flowchart of the proposed framework. First of all, in the metric-learning process, objects in the images are seg-mented and tagged by users. SIFT features are extracted from the images to represent the objects. The SIFT features that are located at the same semantic parts of the objects are con-sidered relevant to each other, and will be used as the similar pairwise constraints in our metric-learning task; on the other hand, any two SIFT features that are located at different semantic parts of the objects are considered irrelevant, and will be treated as the dissimilar pairwise
The authors present an online semantics-preserving, metric-learning technique for improving the bag-of-words model and addressing the semantic-gap issue.
constraints in our metric-learning task. We refer to such a collection of similar and
dissim-ilar pairwise constraints as side information,
which is critical to the metric-learning task. We propose a novel scheme to optimize the distance metric from the side information by minimizing the semantic loss. We define the semantic loss as the following two cases:
two features with different semantics are
mapped into the same visual word, and
two features with the same semantics are
mapped into different visual words. The semantic loss is mainly due to the well-known semantic gap. That is, the similar-ity between low-level features doesn’t reflect the correlation between their semantics. We propose to measure the semantic gap by com-puting the distance between semantically iden-tical features, illustrated in Figure 2. In the figure, the two tires drawn on the car are semantically identical features, and their dis-tance in feature space is defined as the measure-ment of the semantic gap. The idea of our work is to search for a proper distance metric so that the semantically identical features are mapped to the same (or very close) place, while the semantically different features are mapped to diverse places (far from each other). Such an optimized distance metric is used to build the semantics-preserving codebook (SPC), which is essential to the BoW representation for image annotation and object categorization.
In traditional BoW, an image is represented by the histogram of visual words from a code-book. This simple representation has some drawbacks. First of all, both the visual words extracted from the object regions and the visual words extracted from the background regions are all incorporated for generating the BoW model. Such a simple approach, however, brings the background noise into the resulting model, which is supposed to describe only the object. Moreover, this representation might be influenced if an image contains multiple objects. However, many real-world images usu-ally contain multiple objects. As a result, all other irrelevant objects in the images will be-come noises when building the regular BoW model for certain objects. Although this prob-lem may be partially resolved by some latent topic analysis, it suffers from several challenges,
for example, it’s often difficult to determine an appropriate number of latent topics for such approaches.
For the reasons discussed previously, our new SPML approach aims to preserve the se-mantics by modeling each individual object rather than simply modeling a whole image. In particular, we adopt some training images labeled by human beings, for example, MIT’s
Labelme testbed8 where the objects are all
well-segmented and labeled by real users. VW1
Clustering Clustering Clustering
Tree Building
Object-based codebook generation Distance-metric learning
Online metric learning
Car
Codebook Codebook Codebook
VW4 VW2 VW1 VW4 VW2 VW1 VW4 VW2
Figure 1. The key process of building the semantics-preserving, bag-of-words model. The method consists of two key steps: semantics-preserving distance metric learning, and object-based codebook generation.
Semantic gap
Figure 2. Illustration for the measurement of a semantic gap. For the same semantic parts of objects, the ideal way is to map them to the same place (as shown on the left side), while regular approaches often map them into different places (as shown in the right side), leading to the semantic-gap problem. Janua ry March 2011
By the proposed SPML framework, we first apply SIFT to extract local features from each image. The SIFT features that are located at the regions of the same semantics (labels) in all the images are collected to represent the se-mantics. To preserve the semantics in the BoW model, all the collected features related to the same semantics are clustered into one or several discriminative visual words for representing the object, where the clustering process adopts an optimized distance metric designed to mini-mize the overall semantic loss.
It’s worth noting that the metric is learned on the basis of a sample of features, and will be fixed and used for the whole feature set. The visual words used for representing an ob-ject might describe different semantic parts or different views of the object. Finally, the set of visual words used for one object is often dif-ferent from the set used for another difdif-ferent object. This process is different from the regular BoW model where all objects share the same set of visual words. Next, we present a novel learn-ing technique designed to find an optimal dis-tance metric to overcome the limitation of semantic loss during the codebook-generation process.
Learning to optimize metrics for enhancing BoW
Codebook generation is a critical step in building the BoW model. Instead of generating
the codebook by applying simplek-means
clus-tering in Euclidean space, which often leads to much semantic loss, we suggest a novel metric-learning scheme that exploits side information for minimizing the semantic loss in the code-book-generation process.
Problem formulation
We first introduce the concept of side infor-mation. Consider a set of pairwise feature
instancesfðxi1,xi2ÞgNi¼1and a set of
correspond-ing instance constraintsfðzi1,zi2,yiÞgNi¼1, where
xi12Rdandxi22Rdare twod-dimensional
fea-ture instances, for example, SIFT feafea-ture
vec-tors. Here,xi1indicates the first feature vector
in the pair, andxi2is the second feature vector
in the pair;zi1andzi2 are binary indicators to
indicate whether a feature instance is located at the object region or the background region
in the image. The variableyiindicates whether
the feature instances in pairðxi1,xi2Þare of the
same semantics. If both xi1 and xi2 are on
the same semantic part, then yi¼ þ1;
other-wise,yi¼ 1.
In general, side information can be gener-ated automatically from locations of feature points in well-segmented images. For example, in Labelme, objects and background regions are manually separated for each image, and differ-ent parts of the objects are also manually seg-mented by users. Hence, if two feature vectors are located at the same region or at the regions of the same semantic label, they will be consid-ered as having the same semantic meaning, that
is,yi¼1. Similarly, in the Pascal visual object
classes (VOC) 2006 datasets (see http://www. pascal-network.org/challenges/VOC/voc2006/ results.pdf), objects in each image are separated from the background by a bounding box. Thus, two features that are in the same bound-ing box or in the boundbound-ing boxes with the same label are treated as having the same semantic meanings.
Given the side information, the goal of our
task is to learn a distance metricAto measure
distance between any two visual features
xi1 and xi2 represented in the following
framework: d xð i1;xi2Þ ¼ ffiffiffiffiffiffiffiffiffiffiffiffiffiffiffiffiffiffiffiffiffiffiffiffiffiffiffiffiffiffiffiffiffiffiffiffiffiffiffiffiffiffiffiffiffiffiffiffi ðxi1xi2Þ > Aðxi1xi2Þ q
where matrix A2Rdxd is the target distance
metric that must be positive and semidefinite with respect to the properties of a valid metric,
that is,A0. To find an optimal metricA, the
basic principle of our metric-learning task is that distances between visual feature vectors of the same semantics should be minimized, and distances between feature vectors of differ-ent semantics should be maximized. On the basis of this principle, we can search for the optimal metric that facilitates clustering the feature vectors of the same semantics into the same visual words, so each visual word has a certain specific semantic meaning. To this end, we formulate our distance-metric
learning problem into the following
optimization: min A0;b X i zi1zi2iþ 2trðAA > Þ s:t:yiðkxi1xi2kAbÞ i; i0;i¼1;. . .;n
where k kA is the Mahanalobis distance
be-tween two features under metric A, tr() is
a trace operator, and is a regularization
IEEE
parameter. The first term of the objective func-tion consists of the slack variables that ac-count for the semantic loss with respect to
the side information ofnpairwise constraints
fðxi1,xi2,zi1,zi2,yiÞgNi¼1. With the first
inequal-ity constraint, minimizing this term makes the distance between two semantically identi-cal features closer, and thus more likely to be mapped into the same visual word. The second term of the objective function is a regulariza-tion term, which is designed to prevent over-fitting by minimizing the model complexity. By solving the optimization problem, we can
obtain the optimized distance metricA and
the threshold variablebthat could be used to
determine whether two features are similar or dissimilar. In general, this optimization belongs to a general semidefinite program, which is often hard to solve with global optima for large applications.
Batch algorithm
We first introduce a batch gradient descent al-gorithm by combining with an active constraint selection scheme to solve the optimization effi-ciently. To simplify the notation, we denote
the feature matrix as X2RNtrd, where N
tr is the number of SIFT features in the training set,
anddis the feature dimension. We also represent
all the feature pairsðxi1,xi2Þin the training data
by two feature matricesX1¼ ½x11,x21, ,xn1
>
and X2¼ ½x12,x22, ,xn2
>
, and similarly
their constraints by three matrices Z1¼
diagðz11,z21, ,zn1Þ,Z2¼diagðz12,z22, ,zn2Þ,
andY¼diag½y1, ,yn. The proposed iterative
optimization algorithm is described as follows. Firstly, we choose an active subset of infor-mative side information from the training
data as the training instances. We denoteSt as
the active set at thet-th iteration. The
informa-tive training instances inStsatisfy either one of
the two conditions: features are of the same se-mantics but with large distance in the current metric space; or features are of different seman-tics but with small distance in the current
met-ric space. Specifically,Stis found by combining
the following two subsets:
Sþt ¼ ðxi1;xi2;yiÞjð1þyiÞ kxi1xi2k2A 41
;
St ¼ fðxi1;xi2;yiÞjð1yiÞ kxi1xi2k2A 51g
Secondly, on the basis of the active setSt
at the t-th iteration, we then apply the
gradient descent technique to search for the
optimal metricAand thresholdbas follows:
Atþ1 At trAL,btþ1 bt trbL, where
rAL A þDXZ1Z2Y>DX,DX ¼ X1 X2,
rbL trðZ1Z2YÞ, andis a learning rate. Finally, to enforce the valid metric con-straint, at the end of each iteration, we project
the current solution of metric A back to a
positive semidefinite cone by an eigen decom-position approach.
Online algorithm
We now present a more efficient and scalable algorithm to solve the metric-learning problem with an online-learning approach. We denote
byAtandbtthe solution at thet-th step. For
online learning, we assume the pairwise con-straints are given sequentially. For each
received pairwise constraintðxi1,xi2,zi1,zi2,yiÞ,
we use current solutionAtandbtto make
pre-dictions on the constraint, and then measure the incurred loss. Whenever the loss is
non-zero, that is,zi1zi2i40, we update the
solu-tion with the following optimizasolu-tion: min A0;biþ 2tr AA > tr AA >t1 2kbbt k 2 ð1Þ s:t:yiðkxi1xi2kAbÞ i; i0
where bothandare regularization
parame-ters. In Equation 1, we add the last regulariza-tion term to prevent the new soluregulariza-tion from deviating too much from the previous
solu-tion, and simplify zi1zi2iinto i since zi1zi2
will be1 for any nonzero loss.
The following theorem gives the optimal solution for each step of the proposed OSPML algorithm: Atþ1¼ At Gt; and btþ1¼btþ
whereGt¼yiðxi1xi2Þðxi1xi2Þ>and the
opti-mal is
¼min 1;
tr GtG>t
yiðkxi1xi2kAtbtÞ
!
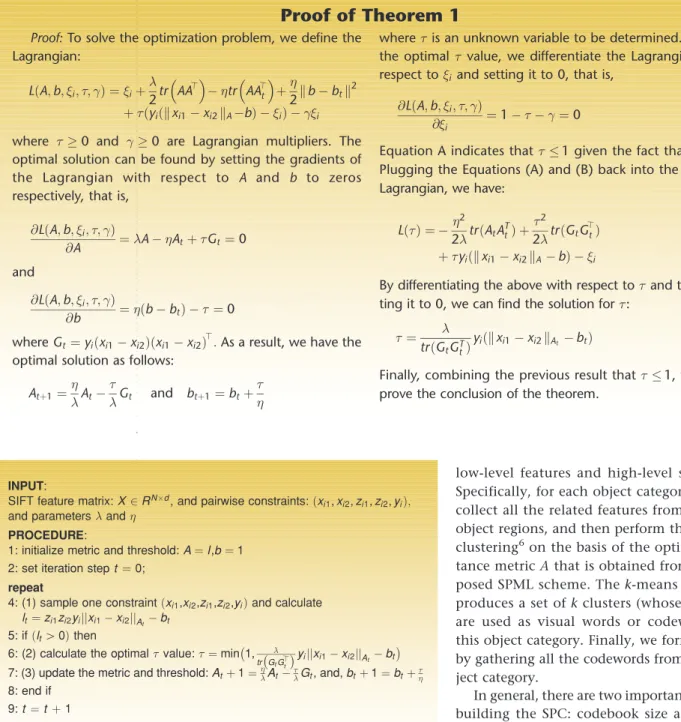
The details of the proof to the above theo-rem can be found in the ‘‘Proof of Theotheo-rem 1’’ sidebar (next page). Finally, Algorithm1, shown in Figure 3, illustrates the process of the OSPML algorithm. Janua ry March 2011
Application to codebook generation
The codebook for BoW can be generated by clustering SIFT features into visual words (or codewords) under the optimized metric. Differ-ent visual words can represDiffer-ent differDiffer-ent views or different parts of an object. We propose to generate the codebook for each object category so that the linkage between the codewords in the codebook and the high-level semantics of object category can be effectively established, which is essential to bridge the gap between
low-level features and high-level semantics. Specifically, for each object category, we first collect all the related features from the same
object regions, and then perform thek-means
clustering6on the basis of the optimized
dis-tance metricAthat is obtained from the
pro-posed SPML scheme. Thek-means clustering
produces a set ofkclusters (whose centroids
are used as visual words or codewords) for this object category. Finally, we form the SPC by gathering all the codewords from every ob-ject category.
In general, there are two important issues for building the SPC: codebook size assignment and visual word generation.
Codebook size assignment
One key challenge of our codebook genera-tion is to assign varied numbers of codes for di-verse objects of different complexity. In our codebook size assignment approach, we follow two principles: the number of codes increases linearly with respect to the visual complexity of an object category; and the visual complex-ity of an object category can be measured by the diversity of its associated features.
In our solution, we apply information theory to measure the visual complexity of an
Proof of Theorem 1
Proof:To solve the optimization problem, we define the Lagrangian: L Að ;b; i; ; Þ ¼iþ 2tr AA > tr AA >tþ 2kbbtk 2 þðyiðkxi1xi2kAbÞ iÞ i
where 0 and 0 are Lagrangian multipliers. The
optimal solution can be found by setting the gradients of
the Lagrangian with respect to A and b to zeros
respectively, that is,
@L Að ;b; i; ; Þ @A ¼AAtþGt¼0 and @L Að ;b; i; ; Þ @b ¼ðbbtÞ ¼0 whereGt¼yiðxi1xi2Þðxi1xi2Þ >
:As a result, we have the
optimal solution as follows:
Atþ1¼ At Gt and btþ1¼btþ
where is an unknown variable to be determined. To find
the optimal value, we differentiate the Lagrangian with
respect toi and setting it to 0, that is,
@L Að ;b; i; ; Þ
@i
¼1¼0 ðAÞ
Equation A indicates that1 given the fact that0.
Plugging the Equations (A) and (B) back into the original Lagrangian, we have: LðÞ ¼ 2 2trðAtA T tÞ þ 2 2trðGtG > tÞ þyiðkxi1xi2kAbÞ i ðBÞ
By differentiating the above with respect toand then
set-ting it to 0, we can find the solution for:
¼
trðGtGTtÞ
yiðkxi1xi2kAt btÞ
Finally, combining the previous result that1, we thus
prove the conclusion of the theorem.
INPUT:
SIFT feature matrix:X2RNd, and pairwise constraints:ðx
i1,xi2,zi1,zi2,yiÞ; and parametersand
PROCEDURE:
1: initialize metric and threshold:A¼I,b¼1 2: set iteration stept ¼0;
repeat
4: (1) sample one constraintðxi1,xi2,zi1,zi2,yiÞand calculate lt¼zi1zi2yijjxi1xi2jjA
tbt 5: ifðlt40Þthen
6: (2) calculate the optimalvalue:¼min1, tr GtG>t
yijjxi1xi2jjAtbt
7: (3) update the metric and threshold:Atþ1¼At
Gt, and,btþ1¼btþ 8: end if
9:t ¼tþ1 untilconvergence
OUTPUT:feature metricA¼PSD(Atþ1), threshold variablebtþ1
Figure 3. The online semantics-preserving metric learning (OSPML) algorithm.
object category. Given an object category that contains a bag of features from their associated images, we assume that each feature in the cat-egory can be generated from the bag in some
probability. Specifically, we denote byCian
ob-ject category and byxjsome feature. The
gener-ative probabilitypðxjjCiÞcan be estimated as
follows: pðxjjCiÞ ¼ 1 ffiffiffiffiffiffi 2 p exp jjxjx^jj 2 A 22 where ^ x¼ 1 nCi X xj2Ci xj
andnCiis the total number of features related
to the objects from Ci. On the basis of this
probability, we calculate the entropy of the bag as a measurement of the object’s visual complexity
HðCiÞ ¼
X
xj2Ci
pðxjjCiÞlogpðxjjCiÞ
Finally, we assign objectCithe number of
codes LCi that are proportional to its visual
complexity, that is,
LCi ¼ Lmax HðCiÞ
lognCi
whereLmaxis the maximum size of the SPC for
each category. The total number of visual
words for all categories isLmaxM, whereM
is the number of categories.
Visual word generation
Visual word generation is a key step of
code-book generation for producing a set ofLCi
vi-sual words for each object category Ci by
applyingk-means clustering on the associated
features. Specifically, we denote byXia
collec-tion of features belonging to object category
Ci, that is, Xi¼ fðx;yÞjx2X;y¼Ci;Ci2C,
wherey denotes the object category label of
featurex,Xis the feature space, andCis the
label space. The algorithm first applies thek
-means clustering on Xi with the optimized
metric A to generate a set of K clusters,
denoted by fcij;rijjj¼1 ;Kg, whereK is set
to be larger thanmaxiLCi,cijdenotes the center
of the j-th cluster, andrijdenotes the range
radius of the cluster, which is defined as the largest distance from the features to the cluster center.
Moreover, to reduce noisy clusters, we sort
the K clusters by their sizes Sij computed as
follows: Sij¼ X x kxcijkA;rij where ða;bÞ ¼ 1 ab 0 otherwise (
The algorithm then chooses topLCi largest
clusters as the set of visual words to form the
codebook for categoryCi. Finally, the algorithm
combines all the visual words from every object category and outputs the set of visual words
along with their ranges, that is,fwk;rkgLmaxk¼1 , as
the final SPC.
Visual word histogram
To apply SPC during the test phase, the key is to generate a visual word histogram for each novel test image. We first extract SIFT features from a novel image, and map each of the
extracted SIFT featuresx2Rdto a visual word
IDkin the cookbook. Each visual feature can
be assigned to multiple visual words among dif-ferent object categories because the ranges of visual words may overlap each other and the same semantics may appear in different objects. In our approach, we assign a feature to a visual word when the distance between them is smaller than some range radius.
Specifically, we define some mapping
func-tionðx;kÞbetween featurexand visual word
wkas follows:
ðx;kÞ ¼ 1 jjxwkjjA5rk
0 otherwise
(
We apply this mapping function to compute
the frequency of a visual wordwkappearing in
imageIas
fIðkÞ ¼
X
x2Iðx;kÞ
Finally, we can obtain the visual word histogram by normalizing the visual word frequencies as follows:
hIðwkÞ ¼
fIðkÞ
PLmax v¼1 fIðvÞ
With this representation, we can annotate an image simply by adopting a Bayes classifier
similar to the approach used in Wu et al.3
Experiments
This section presents our extensive experi-ments to empirically evaluate the performance
Janua
ry
March
of the proposed SPML method and the existing BoW model for image annotation and object categorization. In addition to testing the pro-posed metric-learning algorithm, we show that the proposed semantics-preserving BoW framework can be integrated with other exist-ing distance metric learnexist-ing (DML) techniques. We evaluate different implementations by adapting other existing DML algorithms to our framework.
Experimental testbed
We formed a large and diverse image testbed consisting of 1,073 different object categories and 10,000 images, of which 6,964 images were from Labelme and the rest were from Flickr. The objects in our testbed included cars, trees, buildings, persons, lights, ladders, sidewalks, air conditioners, mailboxes, signs, bicycles, umbrellas, and so on. For feature traction, we adopted the SIFT descriptor to ex-tract local visual features from the images. Each image contained about 1,000 SIFT features represented in 128-dimensional space. In total, the entire data set consisted of about 13,570,000 SIFT features, which presented a great challenge for applying machine learning techniques.
We chose this data set for several reasons. First of all, images from the Labelme data set have high-quality, user-generated object mentation and labeling information. The seg-mentation and labeling information can be as detailed as parts of the objects, such as the
front light of a car, the door of a building, and so on. Such detailed labeling information can help generate high-quality side informa-tion for learning distance metrics. Secondly, this data set is large in that it has over 1,000 common categories and 10,000 images with 13 million SIFT features. Third, these object cat-egories commonly appear in daily life. Specifi-cally, for each image, there are on average 20 objects positioned and occluded as they exist in the real world. And for each category, there are on average 20 instances. The distribution of the categories and tags and their frequency values are shown in Figure 4. It’s a great chal-lenge for any model to detect and annotate these objects in such a complex situation. Fi-nally, the data set consisting of images from both Labelme and Flickr enables us to examine if the learned distance metric from one data set could also be applied or generalized to another data set.
Experimental settings
We compare the proposed SPML method with state-of-the-art DML methods. In particu-lar, we implemented two SPML algorithms: a
batch algorithm (SPML)7and an online
algo-rithm (OSPML). We compare these against other metric-learning algorithms, including
rel-evant component analysis (RCA),9information
theoretic metric learning (ITML),10large margin
nearest neighbor (LMNN),11and neighborhood
components analysis (NCA).12 We
imple-mented these under the same settings.
RCA is parameter-free. For ITML, we set the
algorithm convergence threshold to 104, and
the slack variable to 1. For LMNN, we set the
step size 109, the multiplicative factor to 1.1,
and the cut-off threshold to 1022. For NCA,
we set the length to 5, the Wolfe-Powell param-eters RHO and SIG to 0.01 and 0.5, and the slope ratio to 100.
Experiment 1: annotation performance
The ground truth of annotation was gener-ated by Web users from the Labelme project. We adopted standard performance metrics, that is, average precision and average recall, to evaluate the annotation performance at the
topNannotations.
In our experiment, we performed distance metric learning by five-fold cross validation on Labelme data, in which four folds are used for building the codebook and one fold is
Figure 4. The
distribution of the tags and their frequency values in our image data collection. Frequency 0 200 400 600 800 1,000 1,200 1,400 1,600 1,800 2,000 1,000 900 800 700 600 500 Tags 400 300 200 100 0 IEEE MultiMedia
used for testing the annotation performance. Then we applied the learned metric on the Flickr data. In our methods, there are two key parameters: the constraint size (that is, the number of sampled pairwise constraints) and the codebook size. In this experiment, we sim-ply fixed the constraint’s size to 10,000 and the codebook size to 2,500. Figure 5 shows the comparison results of different approaches, including a regular BoW method and several implementations of our semantics-preserving BoW scheme using different DML algorithms.
As Figure 5 shows, we found that most DML-based algorithms significantly improve the an-notation performance of the regular BoW in terms of both precision and recall. Compared to the other existing DML algorithms, the pro-posed SPML and OSPML algorithms also have
clear advantages. These results show that the codebook generated with our SPML technique is more discriminative than the regular BoW, and that SPML is effective in reducing the semantic loss during codebook generation.
Experiment 2: object vs. general codebook
Our SPML scheme in general adopts an object-based codebook, which is denoted as
object codebook. Unlike the regular BoW that adopts a general codebook without considering specific objects, our object codebook enjoys several advantages, such as high efficiency and excellent scalability. In addition, as with regular BoW, we can generate a general code-book by applying the similar metric-learning technique as used in the SPML scheme. This experiment is designed to compare the
A verage precision 0.0 (a) 0.1 0.2 0.3 0.4 0.5 0.6 0.7 Top N annotations 100 90 80 70 60 50 40 30 20 10 BOW RCA ITML LMNN NCA SPML OSPML A verage recall 0.0 (b) 0.1 0.2 0.3 0.4 0.5 0.6 0.7 0.8 0.9 Top N annotations 100 90 80 70 60 50 40 30 20 10 Figure 5. Performance comparison of different approaches for image annotation: (a) average precision and (b) average recall.
Janua
ry
March
performance between object codebook and general codebook.
We have implemented two kinds of semantics-preserving codebooks. One is an object codebook similar to the previous exper-iment, and the other is a global semantics-preserving codebook similar to the regular BoW except for the usage of the optimized metric. Finally, we compared a regular BoW
codebook, denoted asBoW, and an improved
BoW model with a soft codeword
assign-ment,13denoted asBoW(soft).
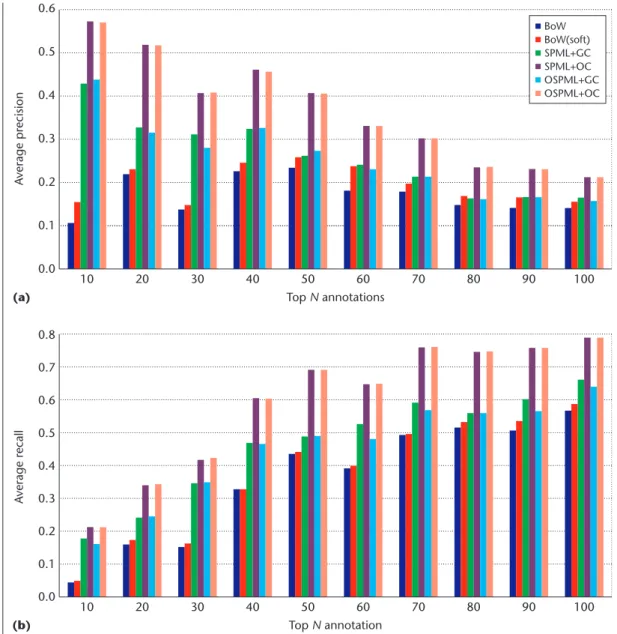
Figure 6 summarizes the comparison results. Both SPC approaches performed considerably better than the regular BoW codebook. Further, by comparing object-based and global codebooks, we found that both of the two object codebooks consistently surpassed their
corresponding global codebooks in all top an-notation results. These results again validate the effectiveness of the SPML technique.
Experiment 3: annotation performance of varied codebook sizes
This experiment evaluates the performance under different codebook sizes. We fixed the size of the tag corpus at 1,000 and gradually increased the size of the codebook to evaluate the average precision and average recall of the top 50 annotations under each codebook. The performance evaluation results are shown in Figure 7.
As shown in Figure 7, we found that the codebook size could influence the perfor-mance. If the codebook size is too small, it might not be discriminative enough. If the
A verage precision 0.0 (a) 0.1 0.2 0.3 0.4 0.5 0.6 Top N annotations 100 90 80 70 60 50 40 30 20 10 A verage recall 0.0 (b) 0.1 0.2 0.3 0.4 0.5 0.6 0.7 0.8 Top N annotation 100 90 80 70 60 50 40 30 20 10 BoW BoW(soft) SPML+GC SPML+OC OSPML+GC OSPML+OC Figure 6. Comparison between general codebook and object codebook: (a) average precision and (b) average recall.
IEEE
codebook size is too large, it may bring noise. Typically, the optimal size of the codebook may depend on the data set, which could be chosen by cross validation in practice.
Also we found that the number of codes for each category is small. It seems the discrimina-tive of visual words is not on the number, but whether these visual words exactly describe the specific object. Even for the global code-book, we might find for some objects, the high frequent visual word is not much. An-other fact is the number of codes also deter-mined by the visual complexity of the object. In Labelme data, most of the objects, such as a window, road, lake, sky, cloud, railing, and so on, are not complex. For those visually sim-ple objects, we found that one code is enough. For the global codebook, we found that not all
visual words are useful. In the Bayes classifier, we might use just a few high-frequency codes that can determine the objects. Besides, we found that other irrelevant codes might even decrease the performance. We often see that when the number of categories increase, the performance of the global codebook might decrease.
Experiment 4: annotation performance of varied number of tags
This experiment is to discover the relation between the number of tags and the annota-tion performance. We fixed the codebook size to 3,000, randomly chose the first 100 tags, and then gradually increased the tag corpus size. We then evaluated the annotation perfor-mance within each chosen tag corpus. Our goal
A verage precision 0 (a) 0.05 0.10 0.15 0.20 0.25 0.30 0.35 0.40 Size of codebook 5,000 3,000 4,000 2,000 1,000 Size of codebook 5,000 3,000 4,000 2,000 1,000
BOW RCA ITML LMNN NCA SPML OSPML
A verage recall 0 (b) 0.1 0.2 0.3 0.4 0.5 0.6 0.7 0.8 Figure 7. Performance evaluation of varied codebook sizes: (a) average precision and (b) average recall.
Janua
ry
March
was to examine how the tag corpus size influen-ces the performance. Figure 8 shows the evalu-ation results.
We found that the performance is improved when the number of tags increases. This is be-cause each image usually contains multiple objects, some of which might not appear in a small tag corpus. When increasing the tag cor-pus size, objects find their proper tags more eas-ily from the tag corpus, leading to a boost in the annotation performance. When the num-ber of tags is too small, it’s less likely to find an image with proper tags that describe the same object as the target image. Therefore, increasing the size of tag corpus generally improves the annotation performance of the target image.
Experiment 5: application to object recognition
To further examine the performance of the proposed online SPML technique for object rec-ognition, we applied the technique on the Pascal VOC 2006 object-recognition challenge. Unlike the Labelme data set where objects are manually well segmented, the objects in the VOC 2006 data set are only marked in the images with a rough bounding box. The num-ber of object categories is only 10 for the VOC 2006 data set, which is much smaller than the Labelme data set. Although this data set seems less challenging, we believe both of them could help to examine the robustness of our techniques as they generally have different data distributions. A verage precision 0.0 (a) 0.1 0.1 0.2 0.2 0.3 0.3 0.4 0.4 Number of tags 1,000 900 800 700 600 500 400 300 200 100 (b) Number of tags 1,000 900 800 700 600 500 400 300 200 100 A verage recall 0.0 0.1 0.2 0.3 0.4 0.5 0.6 0.7 0.8 BOW RCA ITML LMNN NCA SPML OSPML Figure 8. Performance evaluation of varied numbers of tags: (a) average precision and (b) average recall.
IEEE
For object recognition, we adopted discrimi-native classification models, that is, support vector machines (SVMs). In particular, all the VOC 2006 training data is used to train the codebook as well as a set of binary SVM classi-fiers in which each of the SVM classiclassi-fiers would be employed to detect one object cate-gory. Once the classifiers were trained, we tested the performance of the SVM classifiers on the VOC 2006 test set, and compared the results with the existing BoW model as well as some other state-of-the-art object-recognition
methods, including XRCE,14AP06-Lee,15and
QMUL-LSPCH.15Because there are only 10
ob-ject categories, we fixed the codebook size to 500 during the codebook-learning process. For the parameters in SVM training, we adopted
the default settings (C¼ 1) with the
radial-basis-function kernel of¼0:07. Finally, we
measured the detection performance by the area under the (receiver operating characteris-tic, or ROC) curve (AUC).
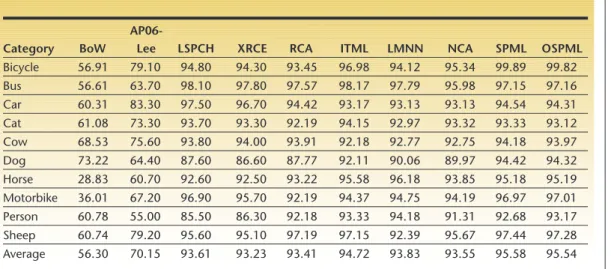
Table 1 shows the AUC results. First of all, we found that most DML-based approaches sig-nificantly outperformed the regular BoW with-out metric learning. Second, by examining different DML algorithms, we found that the SPML and OSPML algorithms achieved the best performance. Moreover, compared to the other state-of-the-art object-recognition approaches, the proposed algorithms often obtained the best results for most cases. Finally, we found that the proposed online SPML algo-rithm is mostly comparable to the batch SPML algorithm for most cases.
Experiment 6: evaluation of computational cost
As indicated, we adopted the five-fold cross validation approach in which four folds of the data are used to learn the metric and generate the codebook, and one fold is used for object annotation. In the experiment, we focused on comparing the computational time costs of the OSPML algorithm, which can efficiently learn the metrics in a scalable manner. We have extensively evaluated the performance of our technique on a large data set of millions of features with various DML algorithms to learn metrics for codebook generation.
By computing the average time costs of all the compared DML algorithms in the object-annotation experiments, we found RCA, an extremely simple algorithm, is most efficient, taking about 1.58 seconds. We found LMNN to be the least efficient algorithm, taking about 1,545.35 seconds for optimizing the metric. Among the rest, NCA, the second least-efficient algorithm, took about 391.13 sec-onds, and ITML took about 80.37 seconds. For the two semantics-preserving metric-learning algorithms, the batch SPML algorithm took about 8.28 seconds, while the proposed online algorithm OSPML took about 5.85 seconds, ranking the second most-efficient algorithm among all the compared algorithms.
Conclusion
Encouraging results indicated that our tech-nique is effective and promising for large-scale multimedia applications. In our future work,
Table 1. Comparison of area under the (receiver operating characteristic) curve results on the Pascal visual object classes 2006 data set.
Category BoW
AP06-Lee LSPCH XRCE RCA ITML LMNN NCA SPML OSPML
Bicycle 56.91 79.10 94.80 94.30 93.45 96.98 94.12 95.34 99.89 99.82 Bus 56.61 63.70 98.10 97.80 97.57 98.17 97.79 95.98 97.15 97.16 Car 60.31 83.30 97.50 96.70 94.42 93.17 93.13 93.13 94.54 94.31 Cat 61.08 73.30 93.70 93.30 92.19 94.15 92.97 93.32 93.33 93.12 Cow 68.53 75.60 93.80 94.00 93.91 92.18 92.77 92.75 94.18 93.97 Dog 73.22 64.40 87.60 86.60 87.77 92.11 90.06 89.97 94.42 94.32 Horse 28.83 60.70 92.60 92.50 93.22 95.58 96.18 93.85 95.18 95.19 Motorbike 36.01 67.20 96.90 95.70 92.19 94.37 94.75 94.19 96.97 97.01 Person 60.78 55.00 85.50 86.30 92.18 93.33 94.18 91.31 92.68 93.17 Sheep 60.74 79.20 95.60 95.10 97.19 97.15 92.39 95.67 97.44 97.28 Average 56.30 70.15 93.61 93.23 93.41 94.72 93.83 93.55 95.58 95.54 Janua ry March 2011
we plan to develop more effective algorithms to solve the optimization task of the distance met-ric learning problem to further improve the effi-ciency and scalability of the proposed BoW models. In addition, we plan to work on mining probabilistic constraints from noisy data of user-contributed photo collections, discovering the relation between visual words to reduce their re-dundancy, and applying our technique to other
real large-scale multimedia applications. MM
Acknowledgments
This work occurred when Lei Wu was a re-search assistant with Steven C.H. Hoi at NTU. The work was in part supported by Singapore MOE tier-1 research grant (RG67/07) and Singapore NRF Interactive Digital Media R&D
Program under research grant NRF2008IDM-IDM004-006.
References
1. L. Wu et al., ‘‘Distance Metric Learning from Un-certain Side Information with Application to Auto-mated Photo Tagging,’’Proc. 17th ACM Int’l Conf. Multimedia,ACM Press, 2009, pp. 135-144. 2. G. Carneiro and N. Vasconcelos, ‘‘Formulating
Se-mantic Image Annotation as a Supervised Learning Problem,’’Proc. IEEE Conf. Computer Vision and Pat-tern Recognition,IEEE CS Press, 2005, pp. 163-168. 3. L. Wu et al., ‘‘Scale-Invariant Visual Language
Modeling for Object Categorization,’’IEEE Trans. Multimedia,vol. 11, no. 2, 2009, pp. 286-294. 4. D.D. Lewis, ‘‘Naive (Bayes) At Forty: The
Indepen-dence Assumption in Information Retrieval,’’Proc.
Related Work
Our work is generally related to the bag-of-words
stud-ies,1,2for which we refer readers to a comprehensive survey
on BoW.1On the other hand, from a machine-learning
view-point, our work is related to supervised distance metric
learn-ing (DML). This work mainly follows our recent study.3This
article differs in that we propose a novel online semantics-preserving, metric-learning algorithm, which is more efficient and scalable for large-scale applications. Here, we briefly dis-cuss some related work on distance metric learning.
In the literature, DML has been actively studied. Existing DML studies can be roughly grouped into two major cate-gories. One category is to learn metrics with class labels,
such as neighborhood components analysis (NCA),4which
are often studied for classification.5NCA learns a distance
metric by extending the nearest-neighbor classifier. The
max-imum-margin nearest neighbor (LMNN) classifier6extends
NCA through a maximum margin framework.
Information-theoretic metric learning (ITML)7 presented the
metric-learning problem from the information-theory approach, and achieved the optimal metric by minimizing the differen-tial relative entropy between two multivariate Gaussians under constraints on the distance function.
The other category of DML is to learn metrics from pair-wise constraints that are mainly used for clustering and re-trieval. Examples include relevant components analysis
(RCA)8 and discriminative component analysis (DCA),9
among others. RCA learns a global linear transformation from the equivalence constraints. The learned linear trans-formation can be used directly to compute distance
be-tween any two examples. DCA and kernel DCA9improve
RCA by exploring negative constraints and capturing nonlin-ear relationships using contextual information. Essentially,
RCA and DCA can be viewed as extensions of linear discrim-inant analysis by exploiting the must-link constraints and cannot-link constraints.
References
1. J. Yang et al., ‘‘Evaluating Bag-of-Visual-Words Representa-tions in Scene Classification,’’Proc. Int’l Workshop Multime-dia Information Retrieval,ACM Press, 2007, pp. 197-206. 2. J.C. van Gemert et al., ‘‘Visual Word Ambiguity,’’IEEE Trans.
Pattern Analysis and Machine Intelligence,vol. 32, no. 7, 2010, pp. 1271-1283.
3. L. Wu, S.C.H. Hoi, and N. Yu, ‘‘Semantics-Preserving Bag-of-Words Models and Applications,’’IEEE Trans. Image Processing,vol. 19, no. 7, 2010, pp. 1908-1920.
4. J. Goldberger et al., ‘‘Neighborhood Component Analysis,’’
Advances in Neural Information Processing Systems,The MIT Press, 2004.
5. A. Globerson and S. Roweis, ‘‘Metric Learning by Collapsing Classes,’’Advances in Neural Information Processing Systems,
The MIT Press, 2005.
6. K. Weinberger, J. Blitzer, and L. Saul, ‘‘Distance Metric Learning for Large Margin Nearest Neighbor Classification,’’
Advances in Neural Information Processing Systems,vol. 18, 2006, pp. 1473-1480.
7. J.V. Davis et al., ‘‘Information-Theoretic Metric Learning,’’Proc. Int’l Conf. Machine Learning,ACM Press, 2007, pp. 209-216. 8. A. Bar-Hillel et al., ‘‘Learning Distance Functions Using
Equivalence Relations,’’Proc. Int’l Conf. Machine Learning,
AAAI Press, 2003, pp. 11-18.
9. S.C.H. Hoi et al., ‘‘Learning Distance Metrics with Contex-tual Constraints for Image Retrieval,’’Proc. IEEE Conf. Com-puter Vision and Pattern Recognition,IEEE CS Press, 2006.
IEEE
10th European Conf. Machine Learning,no. 1398, Assoc. Computational Linguistics, 1998, pp. 4-15. 5. D.G. Lowe, ‘‘Distinctive Image Features from
Scale-Invariant Key points,’’Int. J. Computer Vision,vol. 60, 2004, pp. 91-110.
6. J.A. Hartigan,Clustering Algorithms,John Wiley & Sons, 1975.
7. L. Wu, S.C.H. Hoi, and N. Yu, ‘‘Semantics-Preserving Bag-of-Words Models and Applications,’’IEEE Trans. Image Processing,vol. 19, no. 7, 2010, pp. 1908-1920.
8. B.C. Russell et al., ‘‘Labelme: A Database and Web-Based Tool for Image Annotation,’’Int. J. Computer Vision,vol. 77, nos. 1-3, 2008, pp. 157-173. 9. A. Bar-Hillel et al., ‘‘Learning Distance Functions
Using Equivalence Relations.’’Proc. Int’l Conf. on Machine Learning,AAAI Press, 2003, pp. 11-18. 10. J.V. Davis et al., ‘‘Information-Theoretic Metric
Learning,’’Proc. Int’l Conf. Machine Learning,
ACM Press, 2007, pp. 209-216.
11. K. Weinberger, J. Blitzer, and L. Saul, ‘‘Distance Metric Learning for Large Margin Nearest Neigh-bor Classification,’’Advances in Neural Information Processing Systems,vol. 18, 2006, pp. 1473-1480. 12. J. Goldberger et al., ‘‘Neighborhood Component
Analysis,’’Advances in Neural Information Process-ing Systems,The MIT Press, 2004.
13. J.C. van Gemert et al., ‘‘Visual Word Ambiguity,’’
IEEE Trans. Pattern Analysis and Machine Intelli-gence,vol. 32, no. 7, 2010, pp. 1271-1283.
14. F. Perronnin et al., ‘‘Adapted Vocabularies for Ge-neric Visual Categorization,’’Proc. European Conf. Computer Vision,IOS Press, 2006, pp. 464-475. 15. M. Everingham et al.,The PASCAL Visual Object Classes Challenge 2006 (VOC2006) Results,2006; http://www.pascal-network.org/challenges/VOC/ voc2006/results.pdf.
Lei Wuis a research scholar at Michigan State Univer-sity. His research interests include machine learning, multimedia retrieval, and computer vision. Wu has a PhD in electronic engineering and information science from the University of Science and Technol-ogy of China. He received a Microsoft Fellowship in 2007. Contact him at [email protected].
Steven C.H. Hoi is an assistant professor in the School of Computer Engineering of Nanyang Tech-nological University, Singapore. His research interests include machine learning and its application to mul-timedia retrieval, Web search, social media data min-ing, computer vision, and pattern recognition. Hoi has a PhD in computer science and engineering from The Chinese University of Hong Kong. Contact him at [email protected]. Janua ry March 2011