NOVEL FRAMEWORK FOR THE PORTFOLIO
DETERMINATION USING PSO ADOPTED CLUSTERING
TECHNIQUE
1B.UMADEVI, 2D.SUNDAR, 3DR.P.ALLI
1
Research Scholar, Manonmaniam Sundaranar University Assistant Prof., Raja Doraisingam Govt. Arts College, Sivagangai
2
Assistant Prof., Thiagarajar School of Management, Madurai 3
Prof., and Head CSE Department, Velammal College of Engineering and Tech., Madurai E-mail: [email protected], 2 [email protected]
ABSTRACT
Methods based on the Econometrics, Statistics, Machine learning, heuristics and data mining methods are used to predict the market behavior and investment decisions. In this paper we have presented a novel approach for the portfolio creation using the PSO adopted K-Means. Then the NARX and the Markowitz model have been employed to carry over the efficient determination of the portfolio. The data from the Nifty from March 2010 to October 2010 has been used. The Stocks from various sectors are used to build the portfolio. The proposed work is promising and the results obtained are outperforming. Future work could be concentrated on the various multi objective optimizations as the Markowitz model paves the way to the future research.
Keywords: PSO K Means, Nonlinear Autoregressive Exogenous (NARX) Network, Markowitz Model. 1. INTRODUCTION
Decision making for choosing and Investment in the stocks are very critical and challenging task [1] because the stock market is a complex, non stationary, chaotic and non-linear dynamic system. Portfolio management is a key issue to be considered when one wants to increase their assets by using the stock market. The pain of managing the portfolio by the investor paved the way of research in this area. The dynamic nature of the stock market makes this problem an interesting and challenging one. Portfolio is the basket consisting of the stocks, securities and the bonds related to the asset creation held by the particular investor for the game to play and win money from the market.
In this paper we have dealt with the methodology for the portfolio determination using the PSO adopted K-Means algorithm for the creation of the clusters from the stock data considered. This is the important novel approach used in the paper. The seeding of K-Means is an important problem in the research. In this paper we have attempted to solve this issue by using the
PSO. Then the NARX based algorithm is used for the calculation of the expected returns of the stocks. Then the modern portfolio theory by the Markowitz model has been used by the minimization of the covariance of the stocks to build the portfolio. Portfolio created by Means and PSO adopted K-Means has been demonstrated and compared with the Nifty returns.
2. RELATED WORKS
This section deals with the related works of the proposed methodology. The clustering algorithm is used as the back bone of the method. It is adapted with the particle swarm optimization to improve its effectiveness. Here we talk about the PSO theory in detail and the basic working model of the PSO in section 2.1. Clustering concepts are surveyed in 2.2. The hybrid technique of clustering using PSO is discussed in section 2.3.
2.1 Particle Swarm Optimization
Eberhart and Kennedy [2-4]. It is based on the social behaviors of birds flocking or fish schooling. The major advantage of this PSO is it doesn’t use the gradient of the problem to be optimized; hence it could be used for the variety of the optimization problem [5]. Particle swarm optimization [6] is a global optimization algorithm for dealing with problems in which a best solution can be represented as a point or surface in an n– dimensional space[6]. Hypothesis are plotted in this gap and seeded with an preliminary velocity, as well as communication channel between [6] the particles. Particles then move through the solution[14] space and are evaluated according to some fitness function after each timestamp.[14] Over time particles are accelerated towards those particles within their grouping which have better fitness values[6].
PSO performs a population-based search, using particles to represent potential solutions within the search space. Each particle is characterized by its position, velocity, and a record of its past performance. Particles are influenced by their leaders, which are the best performers either from the entire swarm or their neighborhood. At each flight cycle, the objective function is evaluated for each particle, with respect to its current position, and that information is used to measure the quality of the particle and to determine the leader in the sub-swarms and the entire population [14].
2.1.1 Pseudo Code for PSO
The pseudo code of the PSO algorithm is stated [9][15] as given below.
FOR each particle
initialize the particle END
Do
FOR each particle
Calculate the fitness value
If the fitness value is better[14] than the best fitness value(pBest) [15]
set the current value as the new pBest End
Choose the particle [15] with the best fitness [14]
value of all the particles as the gBest FOR each particle
Calculate particle velocity Update particle position
End
WHILE maximum iterations or minimum error criteria [14][15] is not attained.
The particle velocity is calculated[12] based on the following formula,
v[] = v[] + c1 * rand() * (pbest[] - present[]) + c2 * rand() * (gbest[] - present[]) [15]
The particle position is given by,
present[] = present[] + v[] [15]
where, v[] is the particle velocity, present[] is the current particle (solution). pbest[] and gbest[] are defined as stated before. rand () is a random number between (0,1). c1, c2 are learning factors (usually c1 = c2 = 2).
PSO is initialized with a group of random particles (solutions) and then searches for optima by updating generations. At every iteration, [15]each particle is updated by following two "best" values. The first one is the best solution (fitness) it has achieved so far. (The fitness value is also stored.) This value is called pbest. Another "best" value that is tracked by the particle swarm optimizer is the best value,[15] obtained so far by any particle in the population. [13][15]This best value is a global best and called gbest.[14][15] When a particle takes part of the population as its topological neighbours, [15] the best value is a local best and is called lbest.
The features that attract towards PSO is its ease of implementation, fewer parameters to adjust, each particle remembers its own previous best as well as neighborhood best and it is efficient in maintaining diversity.
2.2 Cluster Analysis of a Dataset
detection,[17] designing recommender systems etc [14][19].
The principle is of maximizing intraclass similarity and minimizing the inter class similarity is based on clustering in which objects are clustered and grouped in collectively [19]. Clustering is an unsupervised process i.e., it analyze the data set without the knowledge of the labels under which it must be grouped. Clustering is used to divide a data set into classes (by generating labels for them) using the principle of maximizing the intra class similarity. Within the data set clusters[13] are formed so that objects which are similar are grouped together and objects that are very different fall into other clusters.
Cluster analysis is the automatic identification of groups of similar objects or patterns. For example, if a set of data denoted by x, is very similar to a few other sets of data,[9] we may intuitively tend to group x and these sets of data into a natural cluster. By maximizing inter group similarity [18] and minimizing intra group similarity, a number of clusters would form on the measurement/observation space. We can then easily recognize and assign to the clusters suitable label or feature description. There are generally two types of learning approaches relevant to cluster analysis. The parametric partitioned approach attempts to cluster the set directly, in a manner that depends on a set of parameters. These parameters are then adjusted to optimally satisfy a chosen criterion of separation and compactness of clusters. Whereas, the nonparametric approach hierarchical approach proceeds from a provisional initial clustering and iteratively merges/or split clusters until a required degree of similarity holds for the elements of the clusters [14].
Partitioning [19] the unlabelled points are the basic problem of clustering. The clustering algorithms are classified by how they forms cluster groups. The hierarchical algorithms work on either divisive or agglomerative to from clusters of hierarchy depends on a specified measure[19] of distance or similarity exists among objects. On the other hand the distance[18] between the objects are used as a global measure by the partitioning algorithmsfor data optimization.
For the ease of its implementation K-means algorithm is used as the best iterative [14] algorithm. The K-Means algorithm requires low computation [14] level for producing high quality clusters. The K-means algorithm will perform
with the many data sets at the same time it is limited only with compact groups. The K-means minimizes the quantization error, when the points are drawn from the mixture of Gaussian distributions, since it is a gradient descent algorithm. As with many gradient descent algorithms, one downside of K-means [19] is that it can reach a local minimum of the objective function instead of the desired global minimum,[19] meaning that convergence is reached but the solution is not optimal.
2.3 Clustering using PSO
The PSO has been recognized to be the best one in effective and rapid to solve the optimization problem. It was productively applied in many research and application areas. The clustering research area, it is viewed that the clustering as an optimization problem which locates the optimal centroids of the clusters rather than to find an optimal partition. This outlook offers us an opening to pertain PSO algorithm on Clustering solution.
Like other partitional clustering algorithms, the PSO clustering algorithm [9] has the objective is to discover the proper centroids of the clusters for minimizing the intra-cluster distance as well as maximizing the distance between clusters. The PSO algorithm performs a globalized searching for solutions rather than the other partitional clustering procedures for localized searching. In localized searching, the solution is available within the surrounding area of the solution. The performance of the PSO clustering algorithm is categorized into two stages. They are global searching stage and a local refining stage. The hybrid approach is summarized [9] as
(a)Start the PSO clustering process until the maximum number of iterations is exceeded. (b) Inherit clustering result from PSO as the initial centroid vectors of K-means module.
(c)Start K-means process until maximum number of iterations is reached.
3. PROBLEM FORMULATION
by Markowitz [9]. This model is based on return of an asset is its mean return and the risk of an asset is the standard deviation of the asset returns. It aims to find an optimal allocation of capital among a set of assets by simultaneously minimizing the risk and maximizing the return of the investment. Risk was quantified such that investors could analyze risk return choices. Moreover, risk quantification [18] enabled investors to measure risk reduction generated by diversification of investment. So diversification of investment is essential to create an efficient portfolio [18].
To create the efficient portfolio and manage it, we need to have
i) Diversification - helps to identify the stock from various or less correlated stocks
ii) More stable portfolio - the insensitivity towards the daily changes of the market. This is an ideal situation but it more or less could be achievable by the deployment of new theories
iii) less risk – to condense the possibility that actual future returns[23] will be different from expected return, to reduce the volatility and to reduce the standard deviation from the asset returns.
iv) Rely on correlations between the stock to overcome the dependency on expected returns as the expected returns are tough to predict in the dynamic market situations
Thus the problem is formulated in such a way that the methodology must be able to find the diversified and more stable portfolio with less risk and results with more returns.
4. PROPOSED METHODOLOGY
The above problem could be encountered in two stages. The first stage concentrates on the diversification of the portfolio thus reducing the risk. The second stage is creation of the efficient portfolio. The proposed methodology could be depicted with the following frame work.
Stage 1: In this stage the stock data to be considered is taken. The data is applied with the PSO algorithm to determine the centroid for the forth coming clustering algorithm. This is the scrutinizing step where the following clustering algorithm will be seeded with the initial centroid.
The clustering algorithm here adopted is the K-Means algorithm, which is a partitioning based clustering algorithm. This PSO adopted clustering algorithm is used to find the Clusters in the initial stock data provided.
The clustering process aims for least diversity within a group and find most difference among groups is to be reached. The K-means algorithm is used for the clustering purpose since the K-means clustering algorithm offers a good compactness compared to other clustering techniques such as Self organizing maps and Fuzzy K- means [l]. But the K means algorithm suffer from the problem of fixing the initial centroid. In order to rectify this limitation, this paper uses the PSO to fix the centroids.
[image:4.595.307.540.413.598.2]The PSO globalized searching algorithm [24] and the fast convergence of the K-means algorithm are pooled together. At the initial stage the algorithm PSO is used to help discovering the vicinity [24] of the optimal solution by a global search. The PSO’s result is used as the initial seed of the K-Means algorithm.
Figure 1: Frame Work Of The Proposed Work
positive correlation, or better still,[23] a negative correlation.
5. PROPOSED ALGORITHM
The proposed algorithm for the efficient portfolio determination is presented as in the pseudo code format.
Stage 1(a) /* PSO to fix the initial seed of the
K-means [19] algorithm */
Input: Stock data
BEGIN
Each particle randomly chooses k numbers of vectors from the stock data as the cluster centroid vectors.
FOR EACH
Compute pBest and the gBest Calculate particle velocity Update particle position END FOR
Repeat until maximum iterations or a minimum error criterion is not attained.
END
OUTPUT : K Centroids
Stage 1(b) /* PSO Adopted K-means algorithm
*/
INPUT: Stock data, Initial centroids by PSO
BEGIN
Make initial partition of objects into K clusters[13] by assigning objects to closest K centroids given by PSO
Calculate the centroid(mean)of each of the K clusters. [25]
i)For object i, Calculate its distance to each of the centroids.
ii) Allocate object i to cluster with closest centroid. iii) If object was reallocated, recalculate centroids based on new clusters.
Repeat Until for object i= 1 to N Repeat until no reallocations occur END
OUTPUT: Clusters from Stock data
Stage 2: /* determination of efficient portfolio
through Markowitz model */
INPUT : Clusters from Stock data
/* stage 2(a) – determination of expected return of each stock */
FOR each cluster
/* Calculation of return of the ith stock,
is the anticipated return at time t per unit invested in security i.
is decided based on the Nonlinear
Autoregressive eXogenous (NARX) Network architecture in association with Levenberg Marquardt algorithm. */
Select the appropriate number of neurons, input delays and feedback delays in NARX.
Select the Levenberg Marquardt algorithm [26]. Select the appropriate performance function.
Perform the Training and Testing for all pairs of inputs
Generate the Network Output Y until it is equivalent to Target T.
If the network produced results for all pairs of input is good
Save it as
Else
Retrain the network END
// stage 2(b) Formulation of the portfolio
FOR every pair of stocks in a cluster
// Assignment of the weight to the stock =
* 100
// Calculation of expected return
/* Where, is the expected return of the
portfolio
is the weight of the stock i
is the expected return of
the stock I */
// calculation of the covariance
/* where , is the variance in portfolio return
is the covareince matrix between stock i and j
is the fraction of the portfolio
devoted to stock i
n is the number of stocks */ END
FOR Each cluster
Find the minimum
Construct the portfolio with minimum risk by the minimization of
OUTPUT: Portfolio with the stocks and the weights associated.
6. DATA DESCRIPTION
The data employed for the proposed approach is the historical data that has been collected between the periods of March 2010 to October 2010. The stocks from various sectors are collected to create a diversified portfolio. The various sector indices like financial, Healthcare, Basic materials, Automobiles were collected for the experiment purpose from the National Stock exchange.
7. EXPERIMENTAL DETAILS
The data were processed for the clustering process first using the k-means clustering, then the PSO adopted K means clustering is applied for the data.
7.1 Metrics
The various metrics used for the validity of the cluster is adopted from [l][26] is given as follows
Silhouette index[18]: Better quality of a clustering is indicated by a larger Silhouette value
Davies–Bouldin index[18]: The lower the value the better the cluster structures
Calinski–Harabasz index: It evaluates the clustering solution[28] by looking at how similar the objects are within each cluster and how dissimilar are different clusters. It is also called a pseudo Fstatistic
Krzanowski–Lai index1: Optimal clustering is indicated by maximum value
Dunn’s index (DI): This index is proposed to use for the identification of ‘‘compact and well-separated clusters”.[19] Large values indicate the presence of compact and well-separated clusters [26]
Alternative Dunn index (ADI): The aim of modifying the original Dunn’s index was that the calculation becomes simpler, when the dissimilarity functions between two clusters.
7.2 Building Of The Portfolio
The efficient portfolio has been built based on the clusters formed in the stage 1 and in the stage 2, Markowitz model is used for building the portfolio. The stage 2 is using the NARX model for the estimation of the returns; the returns are then used to find the return of the portfolio. The variance is then calculated based on the weights associated and the covariance.
8. RESULTS AND DISCUSSIONS
The results obtained based on the various cluster metrics are displayed as shown in Table 1. (Shown in Annexure).
[image:6.595.306.528.516.652.2]The Table 1 and Table 2 (Shown in Annexure) clearly shows the performance of the proposed method over the traditional K means algorithm. The PSO is suitably used to find the cluster centroid and the k means algorithm uses the initial seeding from the PSO. The K means are used to find the clusters among the stock, which is further used for the portfolio creation. The cluster produced must be a qualitative for backing such kind of applications, which is highly dynamic and involves the money of the investor.
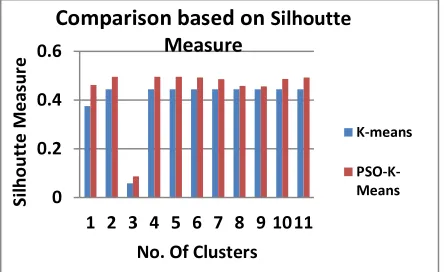
Figure 2: Comparison Based On Silhouetted Measure For Cluster Validity
0 0.2 0.4 0.6
1 2 3 4 5 6 7 8 9 10 11
S
il
h
o
u
tt
e
M
e
a
s
ur
e
No. Of Clusters
Comparison based on
Silhoutte
Measure
K-means
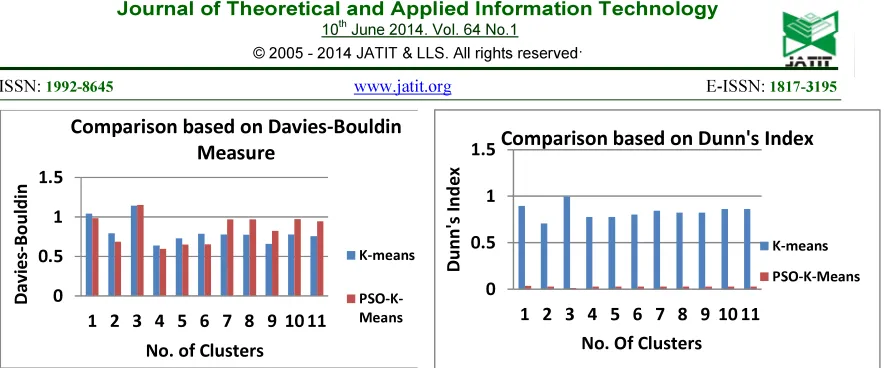
Figure 3: Comparison Based On Davies Bouldin Measure For Cluster Validity
Figure 4: Comparison Based On Calinski Harabasz Measure For Cluster Validity
Figure 5: Comparison Based On Krzanowski-Lai Measure For Cluster Validity
[image:7.595.87.533.88.416.2]Figure 6: Comparison Based On Dunn’s Index Measure For Cluster Validity
Figure 7: Comparison Based On Alternative Dunn’s Index Measure For Cluster Validity
The Figures from 2 to 7 clearly depicts the graphical representation for the differentiation between the K-Means enable clustering and the PSO adopted K- Means. The proposed method out performs the existing one.
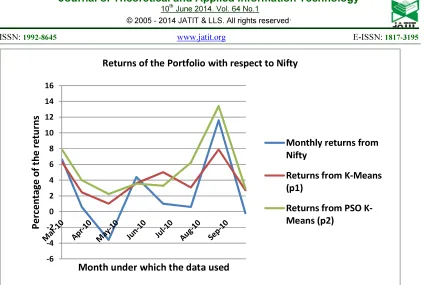
The portfolio has been identified by both the methods which are shown in Table 3 (Shown in Annexure). The monthly returns from the Nifty have been taken and the returns of the proposed method have been computed on the basis of K means and the PSO adopted K Means is shown in Table 4 (Shown in Annexure).
The Figure 8 (displayed in Annexure) clearly depicts the returns got along the mentioned time period for the portfolio depicted by K-Means and the PSO adopted K-Means. It has been compared with the returns from the Nifty at the time period under consideration.
9. CONCLUSION
A novel model for the portfolio creation through the PSO adopted K Means algorithm along 0
0.5 1 1.5
1 2 3 4 5 6 7 8 9 10 11
D av ie s -B o u ldin
No. of Clusters
Comparison based on Davies-Bouldin
Measure
K-means PSO-K-Means 0 10 20 30 40 501 2 3 4 5 6 7 8 9 1011
Cal in s k i-H ar ab a s z M e as u r e
No. Of Clusters
Comparison based on
Calinski-Harabasz Measure
K-means PSO-K-Means 0 0.5 1 1.5 21 2 3 4 5 6 7 8 9 10 11
K r z an o ws k i-Lai M e as u r e
No. Of Clusters
Comparison based on Krzanowski-Lai
Measure
K-means PSO-K-Means 0 0.5 1 1.51 2 3 4 5 6 7 8 9 10 11
D u n n' s I n d e x
No. Of Clusters
Comparison based on Dunn's Index
K-means PSO-K-Means 0 0.2 0.4 0.6 0.8
1 2 3 4 5 6 7 8 9 10 11
A lt e r n at iv e D u n n 's I n d e x
No. Of Clusters
Comparison based on Alternative
Dunn's Index
K-means
[image:7.595.90.296.483.622.2]
with the Markowitz model has been demonstrated. The need for the PSO for seeding the K Means is clearly stated and the results also ensure the novel approach adopted. The returns are slightly promoted by the proposed approach. This shows the need of improvement in the stage 2 of the algorithm discussed. The future work concentrates on the improvement of the portfolio creation method, which could be an alternate to the Markowitz model, but we can’t completely deny the modern portfolio theory. The problem could be adopted with the methods like multi objective optimizations through one of the evolutionary algorithms.
REFERENCES :
[1] N. Koochakzadeh, K. Kianmehr K, A. Sarraf, and R. Alhajj, "Stock Market Investment Advice: A Social Network Approach," Advances in Social Networks Analysis and Mining (ASONAM), IEEE/ACM International Conference on , Vol. No., Aug. 2012, pp.71,78, 26-29.
[2] J. Kennedy and R.C. Eberhart, “Particle Swarm Optimization”, In Proceedings of IEEE International Conference on Neural Networks, Piscataway, New Jersey, 1995, pp. 1942-1948. [3] M. Clerc and J. Kennedy, “The particle swarm explosion, stability, and convergence in a
multidimensional complex space”, IEEE Transactions on Evolutionary Computation, vol. 6(1), 2002, pp. 58-73.
[4] J. Kennedy, “Some issues and practices for particle swarms”, In IEEE Swarm Intelligence Symposium, , 2007, pp.162-9.
[5] Magnus Erik and Hvass Pedersen, “Good Parameters for Particle Swarm Optimization”, Technical Report no. HL1001, Hvass Laboratories, 2010.
[6] http://www.wikidoc.org/Swarm_intelligence [7] S. Hemlata Urade and Prof. Rahila Patel,
“Study and Analysis of Particle Swarm Optimization: A Review,” 2nd National
Conference on Information and
Communication Technology (NCICT) Proceedings published in International Journal of Computer Applications® (IJCA), 2011. [8] Julio Barrera and A. Carlos Coello. “A Review
of Particle Swarm Optimization Methods used for Multimodal Optimization Innovations in Swarm Intelligence”, Vol. 248 of Studies in Computational Intelligence, Springer, 2009.
[9] H. Markowitz and Portfolio selection , Journal of finance. 1952, 7, 77-91.
[10]
http://www.swarmintelligence.org/tutorials.php [11] Crina Grosan, Ajith Abraham and Monica Nicoara, “Search Optimization Using Hybrid Particle Subswarms And Evolutionary Algorithms”, I. J. Of Simulation, Vol. 6 No.10 and 11, ISSN 1473-804x online, 60 1473-8031. [12] Mingheng Li, Dan Shi, Panagiotis and D. Christofides, “Modeling and control of HVOF thermal spray processing of WC–Co coatings”, Powder Technolog, 21 July 2005, 156, 177 – 194.
[13] Sandeep Rana and Sanjay Jasola1 Rajesh Kumar, “A hybrid sequential approach for data clustering using K-Means and particle swarm optimization algorithm”, International Journal of Engineering, Science and Technology, Vol. 2, No. 6, 2010 pp. 167-176.
[14] Anderberg, M. R., “Cluster Analysis for Applications”, Academic Press, Inc., New
York, NY, 1973.
[15] Robert G. Reynolds, Bin Peng and Robert Whallon, “Emergent Social Structures in
Cultural Algorithms”.
[16] Fidan, Neslihan and Beyza Ahlatcioglu Ozkok. "A Review on Applied Data Mining Techniques to Stock Market Prediction." Enterprise Business Modeling, Optimization Techniques, and Flexible Information Systems. IGI Global, 2013. 108-026. Web. 28, Jan. 2014, doi:10.4018/978-1- 4666-3946-1.ch009. [17] Savinderjit Kaur and Veenu Mangat, “
Applications of Data Mining in Stock Market”, Journal of Information and Operations
Management, ISSN: 0976 – 7754 & E - ISSN: 0976 – 7762, Vol., 3, Issue 1, Jan. 2014, pp - 66- 68, 2012.
[18] S.R. Nanda, B. Mahanty and M.K. Tiwari, “Clustering Indian stock market data for
portfolio management, Expert Systems with Applications”, Vol., 37 (12), 2010, pp. 8793-8798.
[19] Lori Dalton, Virginia Ballarin and Marcel Brun, “Clustering Algorithms: On Learning, Validation, Performance, and Applications to Genomics”, Current genomics, , September 2009, 10(6):430- 445.
[20] M. Suresh Babu, N. Geethanjali and B. Satyanarayana, “Clustering Approach to Stock Market Prediction”, International Journal of
[21] L. Bottou and Y. Bengio, “Convergence properties of the K-means algorithm’, In: Tesauro G, Touretzky DS, Leen TK, editors. Adv. Neural. Inf. Process. Syst. 7. Cambridge MA: MIT Press,1995, pp. 585–592. [22] Xiaohui Cui, E. Thomas Potok and Paul
Palathingal , “Document Clustering using Particle Swarm Optimization”, IEEE Swarm Intelligence Symposium, The Westin , 2005. [23]
www.slideshare.net/portfolio-markowitz-model.
[24] Xiaohui Cui and E. Thomas Potok, “Document Clustering Analysis Based on Hybrid PSO+K- Means Algorithm”, Journal of Computer
Sciences (Special Issue): 27-33, 2005, ISSN 1549-3636.
[25]Anusuya Venkatesan and Latha Parthiban, “Clustering of dataset using PSO-K-Means and PCA-K-Means”, International journal of computational intelligence and informatics,
vol., 1 : no.3, October – December 2011. [26] B. Uma Devi, D.Sundar and P. Alli, “An
optimized approach to predict the stock market behavior and investment decision making using benchmark algorithms for Naïve investors”, Computationa Intelligence and Computing Research (ICCIC ) 2013 IEEE International Conference on Digital Object Identifier: 10.1109/ICCIC.2013.6724159, Publication Year, 2013, Page(s): 1- 5.
[27] Maria Halkidi, Yannis Batistakis and Michalis Vazirgiannis, “On Clustering Validation
Techniques”, Athens University of Economics & Business, Patision 76, 10434, Athens, Greece (Hellas).
ANNEXURE
Table 1: The Validity Metric Values Based On The K-Means Clustering
Cluster Metric
Number Of Clusters
2 3 4 5 6 7 8 9 10 11 12
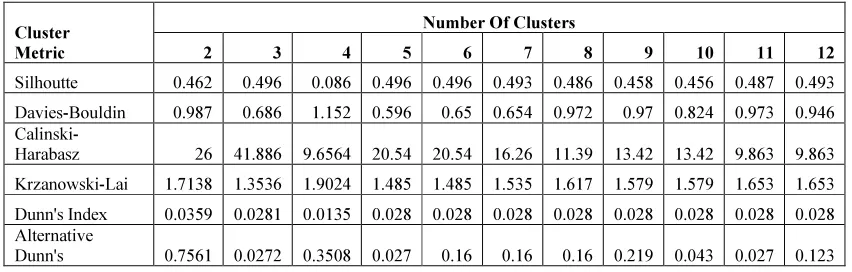
Silhoutte 0.375 0.444 0.058 0.444 0.444 0.444 0.444 0.444 0.444 0.444 0.444 Davies-Bouldin 1.042 0.794 1.143 0.639 0.73 0.788 0.778 0.776 0.659 0.778 0.757
Calinski-Harabasz 18.3 31.6 7.235 15.6 15.8 12.45 8.23 10.96 10.86 10.56 6.958 Krzanowski-Lai 1.119 0.884 1.242 0.97 0.97 1.002 1.056 1.031 1.031 1.079 1.079
Dunn's Index 0.895 0.707 0.994 0.776 0.776 0.802 0.845 0.825 0.825 0.863 0.863 Alternative
[image:10.595.85.511.317.453.2]Dunn's 0.422 0.015 0.196 0.015 0.09 0.09 0.09 0.122 0.024 0.015 0.069
Table 2: The Validity Metric Values Based On The PSO Adopted K-Means Clustering
Cluster Metric
Number Of Clusters
2 3 4 5 6 7 8 9 10 11 12
Silhoutte 0.462 0.496 0.086 0.496 0.496 0.493 0.486 0.458 0.456 0.487 0.493
Davies-Bouldin 0.987 0.686 1.152 0.596 0.65 0.654 0.972 0.97 0.824 0.973 0.946
Calinski-Harabasz 26 41.886 9.6564 20.54 20.54 16.26 11.39 13.42 13.42 9.863 9.863
Krzanowski-Lai 1.7138 1.3536 1.9024 1.485 1.485 1.535 1.617 1.579 1.579 1.653 1.653
Dunn's Index 0.0359 0.0281 0.0135 0.028 0.028 0.028 0.028 0.028 0.028 0.028 0.028 Alternative
Dunn's 0.7561 0.0272 0.3508 0.027 0.16 0.16 0.16 0.219 0.043 0.027 0.123
Table 3: Weights of stock taken for the portfolio by both the methods Portfolio by
K -means(P1)
Portfolio by
PSO K-means(P2)
Companies Weights Companies Weights
Reliance 0.15 SBI 0.32
Herohonda 0.29 Infosys 0.53
Bharti 0.06 Reliance 0.08
Tata steel 0.2 Ranboxy 0.03
Ranboxy 0.3 Tata steel 0.04
Table 4: Returns From The Portfolio Created
Mar-10 Apr-10 May-10 Jun-10 Jul-10 Aug-10 Sep-10 Oct-10
Monthly returns from
Nifty 6.6 0.6 -3.6 4.4 1 0.6 11.6 -0.2
Returns from K-Means
(p1) 6.261 2.4579 1.0132 3.5932 5.003 3.072 7.899 2.72
Returns from PSO
[image:10.595.83.294.482.619.2] [image:10.595.83.495.639.727.2]Figure 8: Comparison Based On Returns Of The Portfolios With Respect To The Nifty
-6 -4 -2 0 2 4 6 8 10 12 14 16
P
e
rce
n
ta
g
e
o
f
th
e
r
e
tu
rn
s
Month under which the data used
Returns of the Portfolio with respect to Nifty
Monthly returns from Nifty
Returns from K-Means (p1)