WBC IMAGE SEGMENTATION USING MODIFIED FUZZY
POSSIBILISTIC C-MEANS ALGORITHM
1S. RAVIKUMAR, 2Dr. A. SHANMUGAM
1 Assistant Professor, Department of Computer Applications,
Bannari Amman Institute of Technology, Sathyamangalam, Tamilnadu, India.
2Principal, Bannari Amman Institute of Technology,Sathyamangalam, Tamilnadu, India.
E-mail: [email protected] , [email protected]
ABSTRACT
Medical Image Segmentation becomes vital process for its proper detection and diagnosis of diseases. In which accurate White Blood Cells segmentation becomes important issue because differential counting, plays a major role in the determination the diseases and based on it the treatment is followed for the patients. To address this work here various fuzzy based clustering techniques are proposed. Already known that Clustering plays a major role for its further process and reduced results will affect its further classification or other processes. The Standard Fuzzy C Means and Standard Fuzzy Possibilistic C Means are modified and its performance is evaluated by various measures and proved as a successful technique.
Keywords:White Blood Cells (WBCs), Red Blood Cells (RBCs), Fuzzy C Means (FCM), Modified Fuzzy C Means (FCM), Fuzzy Possibilistic C Means (FPCM), Modified Fuzzy Possibilistic C Means (MFPCM).
1. INTRODUCTION
Medical Field is a very important field which has grown tremendously in recent years. With the technical progress in medical field, there is a need for faster and a more accurate analysis tool which is essential (e.g. x-ray machines, complete blood count machines…etc). These automated medical tools are necessary for diagnosing patients. They are essential for supporting doctors in accurately providing future prognoses of the conditions and how to cure them [1].
Due to increase in diseases today [1]. There is a need for more medical tools to help doctors to diagnoses fast and accurately. Most of the main laboratories requirements are automated today, and smart systems are used for bone marrow analysis and for differential count of blood components (e.g. to count the number of red and white blood cells, platelets etc..).
There are three types of cells in normal human blood: Red Blood Cells (RBCs), White Blood Cells (WBCs) and blood platelets. In which WBC automated detection and classification is a crucial step in diagnosis of several diseases like acute lymphoblastic Leukaemia. The conventional
procedure requires a haematologist to manually count and classify the cells with the help of a microscope which is a difficult process and not so accurate.
An automated diagnosis system will alleviate the workload and the influence of subjective factors. Automated detection works by removal of red blood cells and platelets from the background. The main drawback of the existing methods is their inefficiency in handling cell images originating from different sources and environment.
Human blood contains five major types of white blood cells or leukocytes. These are neutrophils, basophils, eosinophils, lymphocytes and monocytes. These can be divided into two major groups, distinguished by the presence or absence of granules in the cytoplasm (cell body). There are two major types of leukocyte without granules, these are lymphocytes and monocytes. The other three major types of leukocyte (neutrophils, basophils and eosinophils) differ in the way their cytoplasmic granules are affected by various stains. [2].
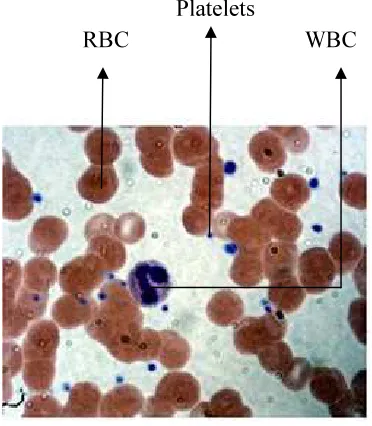
smear as seen by the medical microscope that demonstrates typical blood composition, including RBC, WBC and Platelets.
Platelets
[image:2.595.96.282.184.397.2]RBC
WBC
Figure. 1.1 Blood Smear Image
Most of the automatic white blood cell analysis composed of mainly three steps including cell component segmentation (clustering), feature extraction and cell type classification. Among those described steps, blood cell clustering plays a major role as the first essential step of blood cell counting process to separate a composition of white blood cell into nucleus region and cytoplasm region. Accuracy of the cell classification is affected from this segmentation. Various segmentation techniques were introduced and applied into white blood cell images and organ cell. The cell segmentation using fuzzy clustering technique show an interesting results as such fuzzy cellular network [3], fuzzy in bone marrow [4] and also with another living cell [5,6] and in liver cell [7].
This paper is arranged as follows. A brief description of white blood cell and short overview of this research are introduced in section 1 then followed by reviews of past works regarding this is given as Literature Survey in section 2 followed by clustering concept in section 3. The Standard FCM, Modification of FCM, Standard FPCM and Modification of FPCM clustering is explained for WBC. Experiment results for the proposed work are in section 4. And finally Conclusion is described in section 5.
2. LITERATURE SURVEY
Sonka et al, [8] thought thresholding as the simplest segmentation process, as it is computationally cheap and fast. They claim that thresholding is a suitable segmentation method where objects do not touch each other and where their grey levels are clearly distinct from background levels. Correct threshold selection is crucial for successful segmentation. They state that this can be useful in the case of segmenting images of microscopic blood cells where cytoplasm, nucleus and background each have their own distinctive grey levels. This technique can have problems where the lighting level varies from one image to another.
Ferdinand Van [9] proposes an image segmentation method for complete white blood cells, which is based upon multiple gray level thresholding. In this method, the white blood cell image is low pass filtered with a 5 x 5 pixel averaging filter. This method then uses a known set of conditional probabilities to segment the image into nuclear, cytoplasmic and background material. They show an eosinophilic granulocyte segmented in this manner. This method unfortunately falls down in the presence of erythrocytes (red blood cells) which can often have similar gray level values to leukocyte cytoplasm.
Bikhet et al. [11] applied segmentation and classification of the five types of WBC’s presented in peripheral blood. They used Gray image of blood smears. The use of hierarchical thresholding helps allocate and segment WBC. The ratio of nucleus to cell area, circularity measure average Gray level and area of nucleus and cytoplasm are used as features extracted from each WBC image. In their research, they achieved classification accuracy of 90% using 71 cells sample image. In their paper, there was no indication if the cells used are being healthy or diseased. Besides, the classifier used is not been disclosed.
Sabino and Costa [13] used the Green channel of the RGB model to segment WBC. On the other hand, Westpfalz applied HSI color model to separate WBC from background and de-cluster the clustered WBC [12]. Yang, Foran and Meer [14] improved the algorithm of IGDS to better segment WBC from other BCs presented in the smear image. They used LUV color model, color gradient and used “least square estimation algorithm” along with GVF snake algorithm. Sinha and Ramakrishnan [15] used color used HIS equivalent of the WBC image, K-Means clustering followed by EM-algorithm to segment WBC along with the cytoplasm nucleus. Ongun et al. [16] used fuzzy patch labeling to segment WBC from other blood elements.
3. CLUSTERING TECHNIQUES
The Clustering is the process used in data mining and image processing mostly. They are used to group the objects based on their values or distance etc. For Images the clustering work is to segment the required objects from other objects in an image. This plays a major role in medical image segmentation, satellite image segmentation and many others. In this paper clustering technique is used for WBC segmentation from cell images using various fuzzy based techniques to achieve best clustering technique for WBC segmentation.
3.1. Fuzzy C Means Clustering
Clustering using Fuzzy C-Means (FCM) algorithm is an unsupervised clustering technique which is mostly used in image segmentation since which is proposed [17]. When it is compared with hard c-means algorithm [18], FCM is able to preserve more information from the original image.
In FCM algorithm assigns pixels to each category by using fuzzy memberships. Let denotes an image with N pixels to be partitioned into classes, where
represents features data. The algorithm is an iterative optimization that minimizes the objective function defined in [21] as follows
(1)
with the following constraints:
(2)
Where represents the membership of pixel in the cluster, is the class center; denotes the Euclidean distance, is a weighting exponent on each fuzzy membership. The parameter controls the fuzziness of the resulting partition. The membership functions and cluster centers are updated by the following expressions:
(3)
And
(4)
In implementation, matrix V is randomly initialized, and then and are updated through an iterative process using equation (3) and (4) respectively.
3.2. Modified FCM Algorithm
Szilagyi et al proposed a fast FCM clustering algorithm, EnFCM [8], which is used for gray level image segmentation. The algorithm accounts for pixel spatial information. Before the algorithm implementation, a linearly weighted sum image , composed by original image and local neighboring average of each pixel in original image, was calculated as follows:
(5)
aims at keeping continuity on neighboring pixel values around . Accordingly, the modified objective function was described as follows:
(6)
Where is the data set rearranging from the image defined in equation (5) according to gray level. represents the prototype of
the cluster,
represents the fuzzy membership of gray value l with respect to cluster k. q denotes the number of the gray level equal to l, where l = 1, 2,…,q. Naturally,
Similar to the standard FCM algorithm, under the constraints that for any l, minimize defined in equation (6). Specifically, taking the first derivatives of with respect to and , and zeroing them, respectively, two necessary but not sufficient conditions for will be obtained as follows:
(7)
(8)
Obviously, in equation (6), gray level was viewed as the classified data. Hence, the number of classified data only depends on gray level, and doesn’t enlarge with the in-creasing of image size. However, equation (6) doesn’t take different gray level which has different influence on classifying results into consideration, i.e., equation (6) considers that every gray level has the same contribution to the classifying results. Actually, according to the gray level histogram of the fingerprint image, it is clear that the occurrence frequencies of different gray level are different. Therefore, different gray level has different contribution to clustering results. Based on above analysis, we modified the objective function in equation (6) as follows:
(9)
Where is the weighting coefficient of and can be computed by histogram as follows:
(10)
where q denotes the number of the gray level of the given image. is the number of the pixels having the gray value equal to l, where l = 1,2,…, q. Naturally, i.e., can be viewed as the occurrence probability of each gray level. Hence, from Eq (10), it is known that the weighting coefficient of each gray level can be given by the normalized image histogram.
Similarly, under the constraints that for any l, minimize defined in eq (9). Specifically, taking the first derivatives of with respect to and , and zeroing them, respectively, two necessary but not sufficient
conditions for will be obtained as follows:
(11)
(12)
From equation (12), it is known that the function of weighting coefficient lies in adjusting the clustering center. Equation (9) will degenerated to equation (6) while .
The modified FCM algorithm (spatially weighting FCM clustering algorithm, called SWFCM) can be summarized as follows:
Step 1: Fix and ; then select initial class prototypes ; set
to a very small value.
Step 2: Compute the new image in terms of equation (5) in advance.
Repeat:
Step 3: Compute/modify with by equation (11) and (12).
Step 4: Update with the modified by equation (12).
Until
3.3. Fuzzy Possibilistic C Means
memberships that have a good explanation for the degree of belonging for the data, Krishnapuram and Keller [19] relaxed the constrained condition of the fuzzy c-partition to obtain a Possibilistic type of membership function and propose PCM for unsupervised clustering. The component generated by the PCM corresponds to a dense region in the data set; each cluster is independent of the other clusters in the PCM strategy. The objective function of the PCM can be formulated in [20] as follows:
(13) Where
(14)
Is the scale parameter at the ith cluster,
(15)
is the possibilistic typicality value of training sample belonging to the cluster is a weighting factor called the possibilistic parameter. Typical of other cluster approaches, the PCM also depends on initialization. In PCM techniques, the clusters do not have a lot of mobility, since each data point is classified as only one cluster at a time rather than all the clusters simultaneously. Therefore, a suitable initialization is required for the algorithms to converge the early global minimum.
Pal defines a clustering algorithm that combines the characteristics of both fuzzy and possibilistic c-means [18]: Memberships and typicality are important for the correct feature of data substructure in clustering problem. Thus, an objective function in the FPCM depending on both memberships and typicality can be shown as:
(16)
With the following constraints:
(17)
(18)
A solution of the objective function can be obtained via an iterative process where the degrees of membership, typicality and the cluster centers are update via:
,
(19)
,
(20)
(21)
PFCM produces memberships and possibilities simultaneously, along with the usual point prototypes or cluster centers for each cluster. PFCM is a hybridization of possibilistic c-means (PCM) and fuzzy c-means (FCM) that often avoids various problems of PCM, FCM and FPCM. PFCM solves the noise sensitivity defect of FCM, overcomes the coincident clusters problem of PCM. But the noise data have an influence on the estimation of centroids.
3.4. Modified Fuzzy Possibilistic C Means
Linearly weighted sum image is already described in modified FCM and the equation of it is provided in equation (5). By using that linearly weighted sum the objective function of FPCM is modified which is defined in equation (22)
(22)
With the constraints as follows:
(23)
(24)
typicality and the cluster centers are update as follows
,
(25)
,
(26)
(27)
The FPCM is hybridization of PCM and FCM. The result of FPCM is better than FCM which is proved already but some of the disadvantages are solved here by this modified FPCM. The objective function of FPCM is modified by introducing histogram-based weight. This modified method achieves more desirable performance compared with standard FPCM and FCM.
This proposed algorithm accounts for pixel spatial information which helps to keep continuity on neighboring pixel values of the cells. The clustering technique depends on pixel levels, this objective function various for different pixel levels in the image. It mainly focused for spatially weighting clustering of FPCM and thus fine clustering can be possible with this clustering.
4. EXPERIMENTAL RESULTS
To evaluate the techniques results, the experiment is conduction on various blood cell images. The blood smear image samples are collected from Dr.Rajeshkumar, Pathologist. The blood cell image contains RBC, WBC and platelets. From those the WBC are alone segmented and its number of WBC detected by various techniques is compared with actually present in the image which is manually obtained.
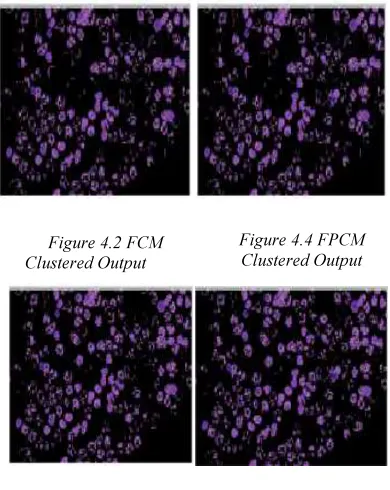
The figure 4.1 is taken as an input image which consists of RBC, WBC and platelets in which WBC alone is clustered by various techniques. The figure 4.2 gives the clustered result of FCM; Figure 4.3 shows the clustered output of MFCM, figure 4.4 displays the clustered output of
[image:6.595.87.289.164.331.2]FPCM and finally figure 4.5 gives the clustered output of proposed MFPCM.
Figure 4.1 Sample Input Blood Cell Images
[image:6.595.351.471.177.275.2]Figure 4.2 FCM Clustered Output
Figure 4.4 FPCM Clustered Output
Figure 4.3 MFCM Clustered Output
Figure 4.5 MFPCM Clustered Output
The detection rate accuracy is calculated by number of WBC detection to the actual number of WBC actually present in the image. The percentage of detection rate is calculated using equation (28).
(28)
And the False Rate is the percentage of cells which are not correctly detected or miss detected. The calculation is defined in equation (29).
[image:6.595.310.505.297.542.2]Table 4.1 Comparative detection performance for various techniques
Techniq ues
Number of
WBC Detectio n Rate
in Percent age (%)
False Rate in Percent age (%) Actual
ly Presen
t
Detect ed
FCM 92 73 79.34 20.66
MFCM 92 78 84.78 15.22
FPCM 92 84 91.30 8.7
MFPCM 92 87 94.56 5.44
The table 4.1 shows the detection rate of various proposed techniques for WBC detection. From the table we can find that Modified FPCM shows maximum result than the FPCM, MFCM and FCM.
The false alarm rate is miss detection or not correctly detected which must be always low. From the table 4.1 MFPCM shows less false alarm rate when compared with FPCM, MFCM and FCM.
0 20 40 60 80 100
C
lu
st
e
r
in
g
A
c
c
u
r
a
c
y
(
%
)
Techniques
[image:7.595.303.505.166.330.2]FCM MFCM
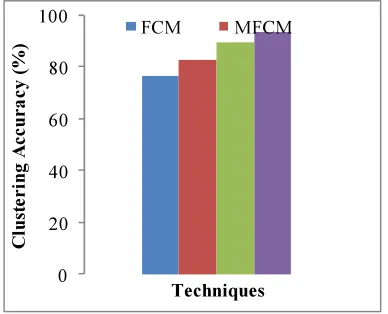
Figure 4.5 Comparision of Clustering Accuracy
The figure 4.5 shows the comparative graph of clustering accuracy based on number of WBC detected. This figure shows that MFPCM
processes better result than FPCM, MFCM and FCM.
0 5 10 15 20 25 30 35
F
a
ls
e
A
la
rm
R
a
te
(%)
Clustering Techniques
FCM MFCM
FPCM MFPCM
Figure 4.6 Comparative False Rate for Clustering
[image:7.595.309.505.386.532.2]Techniques
Table 4.2: Processing time in seconds
Techniques Execution Time (sec)
FCM 3.1594
MFCM 2.9146
FPCM 2.5311
MFPCM 1.3974
The table 4.2 shows the execution time required for the clustering technique. From the table we can see that MFPCM took less time when compared with FPCM, MFCM and FCM clustering technique.
5. CONCLUSION
[image:7.595.93.287.527.684.2]Images. From the result the efficient result in reduced time is achieved by Modified FPCM technique which is shown in experimental results. Thus this technique can be used for successful segmentation of WBC.
REFERENCES:
[1]Sordo.M([email protected]), “Introduction to Neural Networks in Healthcare,” Usenet post to http://www.openclinical.org/neural
networks.html, October 2004.
[2]“Blood”, Keith Breden Taylor and Julian B. Schorr, Colliers Encyclopaedia, Vol 4, 1978 [3]Shitong,W, W. Min. “A New Detection
Algorithm (NDA) Based on Fuzzy Cellular Neural Networks for White Blood Cell Detection”, IEEE trans Information Technology in Biomedicine. vol. 10, no.1, pp.5-10, 2006.
[4]Montseny,E, P. Sobrevilla, S. Romani. “A Fuzzy Approach to White Blood Cells Segmentation in Color Bone Marrow Images”. FUZZ-IEEE 2004, pp.173-178, 2004.
[5]Deshmukh, K, G. N. Shinde. “An adaptive neuro-fuzzy system for color image segmentation”, J. Indian Inst. Sci., vol. 86, pp.493–506, 2006.
[6]Shihabp, A.I. “Fuzzy Clustering Algorithms and Their Application to Medical Image Analysis”. Thesis dissertation, University of London, 2000.
[7]Shitong, W, F. Duana, X. Mina and H. Dewen. “Advanced fuzzy cellular neural network: Application to CT liver images”, Artificial Intelligence in Medicine. vol.39, pp.65- 77, 2007
[8]Milan Sonka, Vaclaw Hlavac and Roger Boyle, “Image processing, Analysis and Machine Vision”, Chapman and Hall, London, 1993. [9]Ferdinand van der Heijden, “Image Based
Measurement Systems, Object Recognition and Parameter Estimation”, John Wiley &Sons, West Sussex, England, 1995.
[10]Sadeghian, Z. Seman, A.R. Ramli et.al (2009). "A Framework for White Blood Cell Segmentation in Microscopic Blood Images Using Digital Image Processing," Shulin Li (ed.), Biological Procedures Online, Volume 11, Number 1.
[11]Bikhet, S. F and A. M. Darwish and H. A. Tolba and S. I. Shaheen, “Segmentation and Classification of White Blood Cells,” IEEE International Conference On Acoustics,Speech
and Signal Processing, ICASSP, pp. 2259-2261, 1999.
[12]Hengen, H , O. Gabel, A. Hajra, T. Paulus, M. Ross and S. Spoor, “Development of a system for the analysis and classification of blood and bone marrow cell images to support morphological diagnosis of leukemia,” Kaiserslautern, Germany, February 2004. http://www.eit.uni-kl.de/pandit/
main/forschung/blutzellene.htm
[13]Sabino, D. M. U, L. da F. Costa, E. G. Rizzatti and M. A. Zago, “A texture approach to leukocyte recognition,” Real-Time Imaging, Vol.10, pp. 205–216, Usenet post to http://www.cse .iitd. ernet.in/~csa03027, February 2004.
[14] Yang, L, P. Meer and D. J. Foran, “Unsupervised Segmentation Based on Robust Estimation and Color Active Contour Models,” IEEE, Usenet post to http://www.caip.rutgers.edu/riul/research/ papers/ pdf/ snake.pdf, January 2004.
[15]Sinha, N ([email protected]) and A. G. Ramakrishnan ([email protected]), “Automation of Differential Blood Count,” Bio-Medical Lab, Department of Electrical Engineering, Indian Institute of Science, Bangalore, IEEE, 2003.
[16] Ongun,G, U. Halici, K. Leblebicioglu and V. Atalay, “Feature Extraction and Classification of Blood Cells for an Automated Differential Blood Count System,” IEEE International Joint Conference on Neural Networks, pp. 2461-2466, 2001.
[17]Zhang, D and Y. Wang. (2006) Medical image segmenta-tion based on FCM clustering and rough set. Chinese Journal of Scientific Instrument, 27, 1683–1687.
[18]Bezdek,J C, “Pattern Recognition with Fuzzy Objective Function Algorithms”, New York, Plenum, 1981.
[19]Krishnapuram, R and J. Keller, “A possibilistic Approch to Clustering”, IEEE Trans. on Fuzzy Systems,vol. 1, n. 2, May 1993.
[20]Jia-Yin Kang, Cheng-Long Gong, Wen-Juan Zhang (2009), “ Fingerprint image segmentation using modified fuzzy c-means algorithm” J. Biomedical Science and Engineering, 2009, 2, 656-660 doi: 10.4236/jbise.2009.28096
MultiConference of Engineers and Computer Scientists 2009 Vol I IMECS.