SAG VOLTAGE IDENTIFICATION ON 30 KV SYSTEMS
AFFECTED BY ELECTRIC ARC FURNACE USING
WAVELET TRANSFORMATION METHOD
1,2WAHYUNI MARTININGSIH, 1M. ASHARI, 1ADI SOEPRIJANTO, 3DIAN SAWITRI 1
Department of Electrical Eng., Sepuluh Nopember Institute of Tech
2Department of Electrical Eng., Sultan Ageng Tirtayasa University
3Department of Electrical Eng., Dian Nuswantoro University
E-mail: [email protected], [email protected]
ABSTRACT
This paper presents sag voltage identification on 30 kV system with electric arc furnace load. The identification of disturbance using wavelet transformation. The proposed method can precisely identify sags caused by 3 disturbances: single-phase, two-phase, and three-phase short circuits, which occur in internally process of an electric arc furnace (EAF). The identification procedure consists of 3 steps: preparation, wavelet energy calculation, analysis for identification. The types of short circuit are detected from the amount of energy during the EAF operation. The highest energy required indicates a three-phase short circuit; however the lightest is for single-phase short circuit. Simulation results from a typical data show that a sag voltage in 0.55-0.75 pu for 0.201 seconds, containing wavelet energy average 0.434733, is caused by 3 types of short circuit in certain subsequent time.
Keywords: Power Quality, 30 kV System, Electric Arc Furnace, Short Circuit disturbances, Wavelet
transformation
1. INTRODUCTION
Problems of electrical disturbances are commonly faced on distribution system in a typical industry area. The disturbances may disrupt the production process internally or outside of the source. The disruptions will affect to the costs. The electric disturbances relate to the power quality, which include outage, power factor, harmonics, sags, swells, and unbalanced conditions[1][2][3].
A satisfied quality of power is required for sensitive equipment to work normally. When the quality of power reduces below the standard, it operates the circuit breaker, and also reducing the power factor[4]. Three important disturbances that are considered include voltage stabilization, continuity, and waveform. The voltage stabilization is identified such as Under-voltage, Over-voltage, Voltage Sag, Voltage Swell, Phase Shift, Flicker and Frequency. The continuity problems terms the momentary Interruption, Temporary Interruption, and Sustained Interruption, transient, Three Phase Voltage Unbalance, Harmonic Voltage, Current Notch [5].
Voltage sags are the rms value of the voltage reduction with short duration. It can be characterized by residual voltage and duration[2][6]. According IEEE Standard 1159 defines voltage sag as reduction in the rms voltage between 0.1 and 0.9 p.u. of the nominal voltage, for duration of 0.5 cycle to1 min.[2].
Unsatisfied power quality causes equipment damage and under-overvoltage. The permitted under or over voltage shall be in the range of -10% - 5% . This under – over voltage occurs in long-duration voltage variationor inshort-duration voltage variation..
swells frequently occur. High harmonic distortions may also appear due to the internal process of EAF [9]. This will affect the equipment surrounding the disturbance sources. Power transformers may be overheating, dips on lighting systems, or failure if the dip voltage is deeper than 35% [10]. To identify the internal short circuit process in EAF become vey interesting topics, followed by action for compensation.
This paper discusses a method to identify sag voltage due to Electric Arc Furnace operation. It analyses the sag characterisics using wavelet transformation. The wavelet transforms disturbance signals into detail signal and approximate signal [11]. Then, the signals are categoryzed as formed by single phase, inter phase, or three phase short circuits. The wavelet method is suitable for transforming event which occurs in a short duration.
2. SYSTEM MODELING
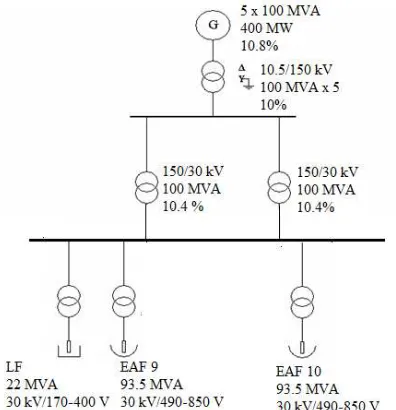
[image:2.612.373.470.246.574.2]The system study is modeled as an infinite bus 150 kV with short circuit capacity 7702 MVA supplying a step down transformer 30 kV with short circuit capacity 1607 MVA, through transmission line, as shown in Figure 1.
Figure 1: Single line diagram
The Electric Arc Furnace in this study has a capacity 130 tons, 50 MW, and modeled as an inductive load 45 MVAR, 30 kV. The melting process of steel inside the EAF is due to the heat generated from short circuit among the electrodes.
The short circuits types include 1-phase, 2-phase, and 3-phase. It appears according to the stages of melting process and position of the elwctroda-iron.
3. IDENTIFICATION METHOD
The short circuit, which occurs inside the EAF, is identified applying 4 steps: modeling of distribution system, Clark transformation, discrete wavelet transformation, calculation wavelet energy, analysis. The flowchart is ilustrated in Figure2.
Figure 2: Flowchat system
3.1 Modeling of Distribution system
Single line diagram in Figure 2 is modeled using Matlab version 7.8.0 (R2099a). By using existing data in section 2, it can be modeled as in Figure 3. The results of the model simulations will be obtained the data of three-phase voltages are known Va, Vb and Vc .
start
Modeling of distribution system
using Matlab
Clarke transformation
Wavelet transformation
Calculation of wavelet energy
[image:2.612.92.290.434.639.2]Figure 3: Modeling of distribution system
3.2 Clarke Transformation
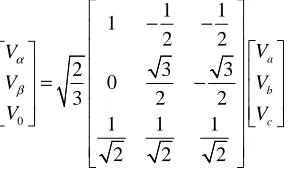
Clarke transform is for converting voltage or current waveform in time domain into alpha, betha axis. This simplified the analysis from 3 phase into single calculation [12]. In this study, three-phase voltage (Va, Vb and Vc) are converted into
two-phase voltages i.e Vα and Vβ. Clark transformation is calculated using matrix as follows:
0
1 1
1
2 2
2 3 3
0
3 2 2
1 1 1
2 2 2
a b c V V V V V V α β − − = − (1)
3.3 Wavelet Transformation
Wavelet transformation has the objective to detect any disturbance. This paper used discrete wavelet transform (DWT) with wavelet daubechies as mother wavelet. Transformed signal is voltage Vα (positive sequence phasor). Original signal is decomposed into approximation and detail signals[7][9]. Wavelet orthogonal consist scaling function (( (x)) and wavelet function (( (x)) in equation (2)
∑ ∑ − = − = − = − = 1 0 1 0 ) 2 ( ) ( ) 2 ( ) ( J t k J t k t x b x t x a x φ ψ φ φ (2)
(a0 – aJ-1) is scaling sequence and (b0 – bJ1) is
wavelet sequence. Scaling function is assosiated with low-pass filterswith coefisient
{
h
(
n
),
n
∈
z
}
, and wavelet function is asssosiated with high-pass [image:3.612.93.238.357.443.2]filterwith coeficient
{
g
(
n
),
n
∈
z
}
, (Figure 4).Figure 4: Wavelet decomposition 2 levels
Some important traits for low pass filter and high pass filter are:
1. ( )2=1
∑
n n
h and
∑
=n n g( )2 1
(3)
2.
∑
( )= 2n
n
h and
∑
=n n
g( ) 0 (4)
3. Filter g(n)is alternative from filter h(n), which is an odd integer N so:
) ( ) 1 ( )
(n h N n
g = − n −
(5)
Based on implementation from figure 5, correlation of approximation coefficient with detail coefficient defined as: ) ( ) 2 ( )
(k h k n cA 1 n
cA
n j
j = ∑ − − (6)
∑
− −= n
j
j k g k n cA n
cD ( ) (2 ) 1( ) (7)
j
cA
andcD
j represent approximation coefficient and detail coefficient from signal to the level-j.3.4 Wavelet Energy
The wavelet energy is the sum of square of detailed coefficients. To distinguish the disturbance signal can be viewed by the energy distribution of the wavelet transform. Energy values for each detail signal and approximation signal can be calculated by equation(8) and (9).[14][15]:
2
( )
dj n j n
E =
∑
d (8)2 ( )
ai n i n
Edj is energy of detail signal to-j and Eai is the
energy of approximation signal to-i for n-level decomposition.
Scales of the wavelet energy coefficients varying depending on the input signal. The distorted signal has energy can be partitioned at different resolution levels and in different ways depending on the power quality problems [16].
4. RESULTS AND DISCUSSION
Simulation result of Single line diagram before the EAF operation is shown in figure 4. Voltage 3-phase signal is transformed Clarke with equation 1, the result is as Figure 5. Then Vα (Figure5) is decomposed into approximation and detail signals using wavelet transform 3-level as shown in figure 8(a).
Figure5: Simulation result before EAF operation
[image:4.612.316.524.76.206.2]The simulation results before the EAF operation is a pure sine wave, these results transformed Clarke (Figure 6).
Figure 6:Clarke Transformation signal before EAF operation
Clarke transformation results, obtained Vo, Vα and Vβ. Then Vα is transformed using wavelet transform to detect the disturbance.
After EAF operation, the electrode reaches the surface of the scrap with the same gap and assumed 3-phase short circuit. The simulation results shown at Figure 7, Figure 8, and Figure 9(b).
[image:4.612.316.519.266.374.2]Figure 7: Simulation result after EAF operation
Figure 7. Signal of simulation result when EAF has been operated and assumed a three-phase short circuit fault.
Figure 8: Clarke Transformation after EAF operation
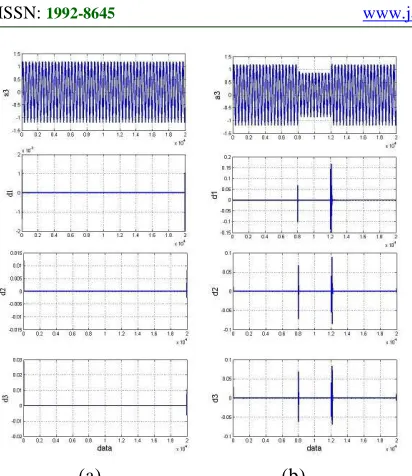
[image:4.612.95.297.495.604.2](a) (b)
Figure 9: Wavelet transformation 3-level (a) before EAF operation (b)after EAF operation (short circuit 3-phase)
The calculations results of wavelet energy detail signals (Table 1), show that the conditions before EAF operated and after the EAF operated (3-phase short circuit) has an average wavelet energy detail signals (Edaverage) 6.67x 10
-7
[image:5.612.92.298.75.313.2]and 0.434733, respectively.
Table 1. Wavelet energy for some conditions of EAF operation
Before EAF operation
Short circuit type during EAF operation 1-phase 2-phase 3-phase
Ea 99.9999 99.9998 99.997 99.9945
Ed1 0.3 x10⁻⁶ 10.5 x 10⁻⁶ 153.1 x 10⁻⁶ 4.2 x 10⁻³
Ed2 6.1 x 10⁻⁶ 10 x 10-6 10 x10-6 0.4
Ed3 13.6 x 10⁻⁶ 141.1 x 10⁻⁶ 141.1 x 10⁻⁶ 0.9
From Table 1, it can be explained that in the event of a short circuit of 3-phase has the largest
Ed value among other conditions. This suggests
that the higher the value of Ed, the energy loss is also higher.
5. CONCLUSSION
In this paper, disturbance voltage detection method with wavelet analysis has been developed and tested. The test result show powerful capabilities of the proposed method based on wavelet transform to detect sag voltage occurs at
0.55-0.75 p.u for 0.201 seconds. Based on the value of wavelet energy, it is known that the energy value greater in the occurrence of short circuits than without short circuits. This value will be greater in multi phase short circuits.
In the next experiment, wavelet transform is used to detect disturbance of power quality (harmonic, flicker, etc) at electric arc furnace based on the measurement data.
REFERENCES:
[1] M. A. S. Masoum, S. Jamali, and N. Ghaffarzadeh, “Detection and classification of power quality disturbances using discrete wavelet transform and wavelet networks,” IET
Sci. Meas. Technol., vol. 4, no. 4, p. 193, 2010.
[2] S. Chattopadhyay, M. Mitra, and S. Sengupta, “Sag, Swell, Interruption, Undervoltage and Overvoltage,” in Electric Power Quality, Dordrecht: Springer Netherlands, 2011, pp. 39–42.
[3] A. Sannino, J. Svensson, and T. Larsson, “Power-electronic solutions to power quality problems,” Electr. Power Syst. Res., vol. 66, no. 1, pp. 71–82, Jul. 2003.
[4] M. Ashari, C. V. Nayar, and S. Islam, “A novel scheme for mitigation of line current harmonics and compensation of reactive power in three phase low voltage distribution systems,” vol. 3, pp. 1324–1329.
[5] T. Ise, Y. Hayashi, and K. Tsuji, “Definitions of power quality levels and the simplest approach for unbundled power quality services,” vol. 2, pp. 385–390.
[6] Zvonimir Klaić, Srete Nikolovski, and Zorislav Kraus, “Voltage Variation Performance Indices in Distribution Network,”
Teh. Ki Vjesn., vol. 18, no. 4, pp. 547–551,,
2011.
[7] Swapnil Arya and Bhavesh Bhalja, “Simulation of Steel Melting Furnace in MATLAB and its effect on power Quality problems,” Natl. Conf. Recent Trends Eng.
Technol., May 2011.
[8] Bincy K Jose, “Evaluation of Power Quality in Arc Furnace Using Iec Flicker Meter,” Int. J.
Emerg. Technol. Adv. Eng., vol. 3, no. 9, Sep.
2013.
[9] A. A. Gomez, J. J. M. Durango, and A. E. Mejia, “Electric arc furnace modeling for power quality analysis,” 2010, pp. 1–6. [10] Chen Chunling, Wu Pengfei, and Xu Tongyu,
“Analysis of power quality transient disturbance signal based on wavelet packet transform,” 2011, pp. 3760–3763.
[11] C. Gargour, M. Gabrea, V. Ramachandran, and J.-M. Lina, “A short introduction to wavelets and their applications,” IEEE Circuits Syst.
[12] S. Chattopadhyay, M. Mitra, and S. Sengupta, “Clarke and Park Transform,” in Electric
Power Quality, Dordrecht: Springer
Netherlands, 2011, pp. 89–96.
[13] M. R. Candido and L. C. Zanetta, “A wavelet-based algorithm for power quality detection in electric arc furnace,” 2008, pp. 1–6.
[14] Girisha Garg, Shruti Suri, Rachit Garg, and Vijander Singh, “Wavelet Energy based Neural Fuzzy Model for Automatic Motor Imagery Classification,” Int. J. Comput. Appl.
0975 – 8887, vol. 28– No.7, Aug. 2011.
[15] D.-M. Li, X.-Y. Yu, X. Wang, and T.-Q. Tang, “Power Quality Disturbances Fuzzy Identification Based on DQ Conversion and Wavelet Energy Distribution,” 2012, pp. 1403–1407.
[16] Sudipta Nath and Priyanjali Mishra, “Wavelet based feature extraction for classification of Power Quality Disturbances,” Int. Conf.
Renew. Energ. Power Qual. ICREPQ’11, Apr.